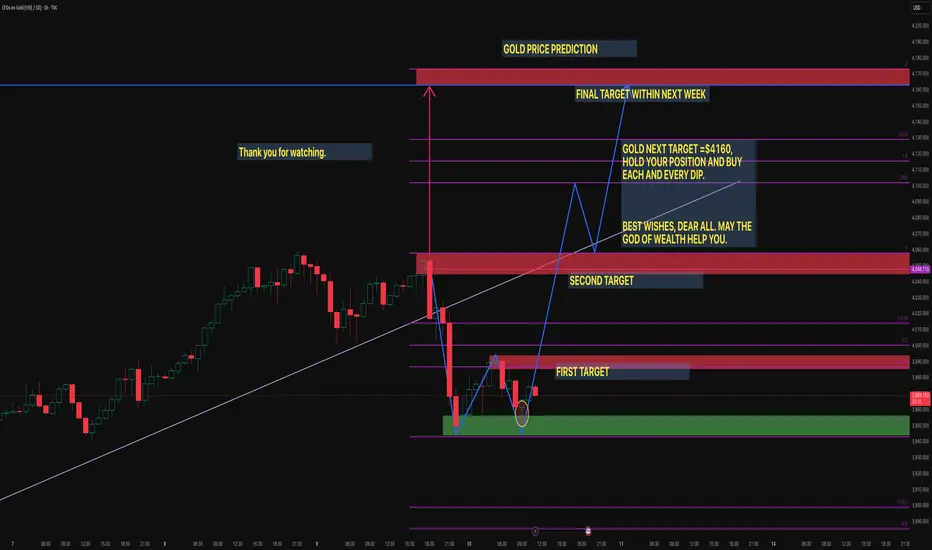
XAUUSD GOLD 15 MINTUS ANANLYSIS BULLISH OUTLOOK 📊 Technical Analysis:
1. Pattern Identification
Double Bottom Formation:
Found near the support area — indicates a reversal from bearish to bullish.
Price bounced twice from the same zone, showing strong buyer activity.
Breakout Confirmation:
After forming the double bottom, the price broke above the neckline/trendline, confirming a bullish reversal.
Upward Channel:
The price movement after breakout is confined between parallel ascending lines, showing a controlled bullish trend.
Each dip to the lower boundary offers a buy opportunity within the channel.
Double Top Formation (Near Resistance):
This pattern forms at the top of the bullish channel, indicating a potential short-term correction or pullback before continuation.
---
💹 Key Levels:
Support Area: Around $3,960 – $3,980
Resistance Area: Around $4,040 – $4,060
Entry Point: Near $3,980 (bottom of the channel / breakout retest zone)
Target Point: Around $4,140+ (upper resistance & measured move target)
Stop Loss (Suggested): Below $3,950 (to protect from false breakouts)
---
📈 Market Sentiment:
Overall Trend: Bullish (due to breakout + double bottom confirmation)
Short-term Risk: Possible minor pullback from double top area before resuming upward.
Bias: Wait for small correction → look for bullish confirmation candle near support → enter long targeting resistance.
Trade ideas

XAUUSD GOLD BULLISH NOW 4028📈 XAU/USD (Gold) Trade Alert ✨
Gold (XAU/USD) is showing strong bullish momentum, presenting an excellent buy opportunity at the entry point of 4028. The support level at 4001 provides a solid foundation for this upward move, indicating potential strength in price action. Our target point is set at 4100, offering an attractive risk-to-reward setup for traders. Keep an eye on the resistance area around 4060, as a breakout above this zone could confirm continued bullish momentum. Manage your positions wisely and follow price action closely for optimal results.

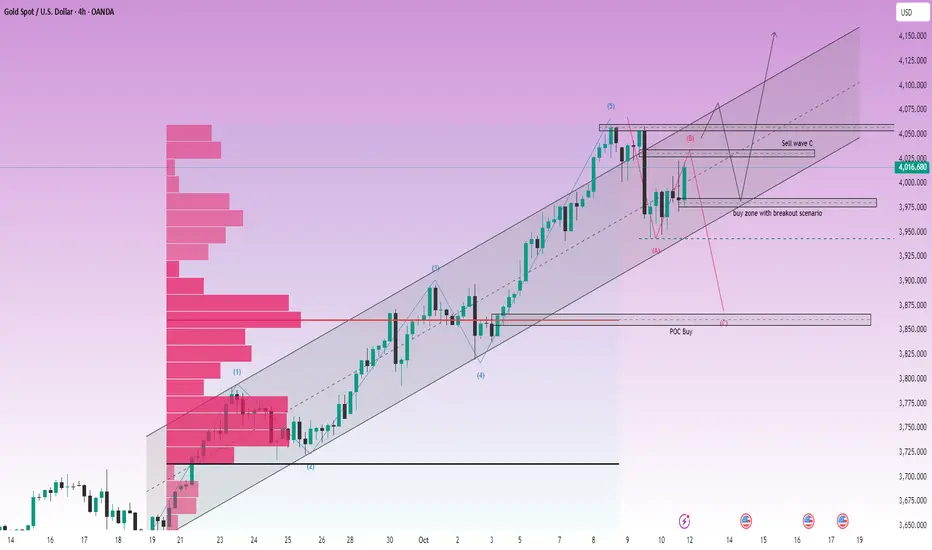
LiamTrading – GOLD: Risk of ABC Correction Wave..LiamTrading – GOLD: Risk of ABC Correction Wave, Short-term Sell at 4028
Hello traders,
Gold has had an impressive growth week, but as prices hit new highs, the risk of correction always increases. Let's examine this week's Gold scenario based on wave analysis and market liquidity.
📊 Technical Analysis (Chart H4 – XAUUSD)
Based on the H4 chart, Gold (GOLD) seems to have completed the Push Wave 5 (Elliott Wave 5) in the current uptrend cycle, reaching strong resistance around 4050–4060.
Current Structure:
The price is within a sustainable Uptrend Channel.
The 4050–4060 range is a significant resistance where selling pressure may emerge.
An ABC correction wave scenario appears after completing Wave 5.
Key Liquidity Zones:
Potential Resistance Zone (Sell Wave C): Around 4028–4033 (Price area to watch for the reaction of the final Wave C).
Confirmed Drop Support Zone: 3972 (Critical price area confirming if selling pressure is strong enough).
Attractive Buy Zone: 3976 (Temporary liquidity if price corrects, waiting for Breakout confirmation).
Long-term Buy Zone (POC Buy): ~3850 (Price area with a huge Volume Profile, ideal for long-term buy orders).
🎯 New Week Trading Scenario
📉 Short-term Sell
This scenario is based on the expectation of an ABC correction wave starting from the resistance zone.
📍 Entry: 4033
🛑 SL: 4040 (Very tight SL, suitable for short-term Sell strategy at the wave peak)
🎯 TP: 3976 → 3943 → POC (~3850)
📈 Long-term Buy
This setup waits for a correction to lower liquidity zones to enter Buy orders with optimal R:R ratio.
📍 Entry: 3976 (Temporary liquidity buy zone)
🛑 SL: 3970
🎯 TP: 4040 → 4090 → 4150
🛑 Failure Scenario (Wait for Breakout Confirmation)
If the price breaks the 4060 peak and creates a new ATH (All-Time High), the ABC wave scenario will fail.
Action: Continue to prioritize Buying. The best entry is to wait for the price to retest the broken liquidity zone (Breakout Retest) around 3976.
🧭 Fundamental & Long-term Analysis
Macroeconomic Sentiment: The Royal Bank of Canada (RBC) forecasts Gold to rise to $4,500 in the next two years, bolstered by long-term inflation concerns. This confirms the long-term uptrend of Gold remains intact.
US Dollar Impact (USD): The traditional view is that USD rises as investors seek liquidity during market stress. However, Gold's rise alongside USD shows the market prioritizes gold as an inflation hedge rather than just a safe haven.
Long-term Strategy: The buy zone at POC (~3850) according to Volume Profile is extremely suitable. Large liquidity here will help traders enter optimal orders and hold long-term, leveraging the pressure from the Seller's Liquidity to push prices up.
📌 Conclusion
Gold is at a critical crossroads. Although the long-term trend is up, the short-term correction risk (ABC Wave) at the 4028–4033 zone is very high.
Priority: Watch for short-term sells at the resistance zone with a tight SL.
Safe strategy: Wait to Buy at liquidity support zones like 3976 or POC (~3850) to optimize risk/reward (R:R).
I will continue to update Gold scenarios daily with insights from 8 years of trading experience.
👉 Follow me to not miss important updates!
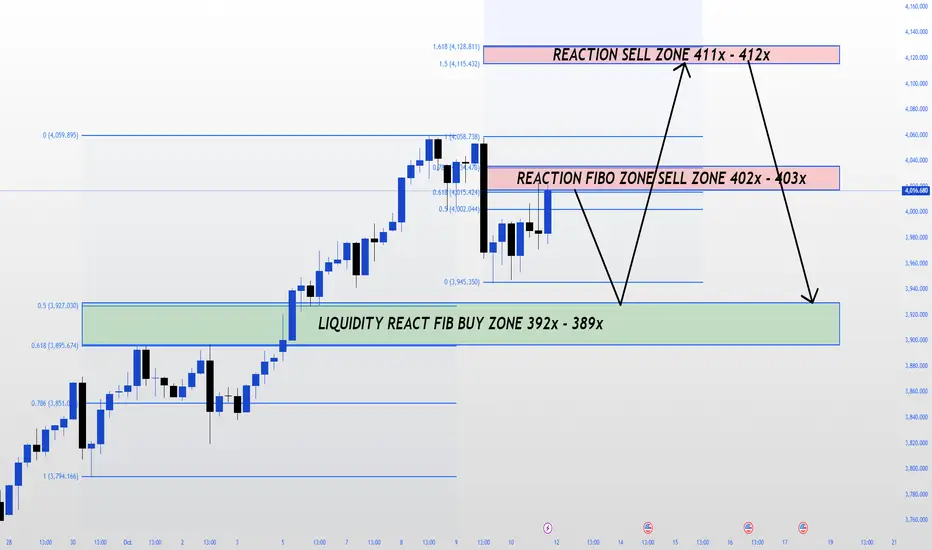
$4,000 RECLAIMED! Targeting Fibo Extremes on H4.The big picture is clear: Gold has strongly pushed past the $4,000 mark, driven by major safe-haven demand amidst US-China tensions. Buyers are pushing for an eighth straight weekly gain!
But where are the high-probability zones?
🔑 THE FRANCI$$_FIBOMATRIX PLAN (H4)
We're keying in on two critical Fibo Reaction Zones for the perfect entry:
1. SELL ZONE (Correction/Reversal Focus):
Zone 1 (FIBO): 402x - 403x (4,025.424 - 4,032.844). Action: Look for H1/H4 candle rejection here to initiate a corrective short trade.
Zone 2 (Extension): 411x - 412x (4,115.422 - 4,128.811). Action: The ultimate target if momentum holds; watch this for the major supply zone.
2. BUY ZONE (Trend Continuation):
The Sweet Spot: 392x - 389x (3,907.030 - 3,895.674). This is our key Liquidity React Fibo Buy Zone. Action: Wait for the deep pullback here, confirm with bullish signals, and join the main trend with a target back to the 402x/411x range.
🚨 Critical Risk Alert:
A decisive weekly close below $3,962 signals a high risk of deep correction towards $3,900. Manage your Longs tightly below this level!
XAUUSDLadies & Gentlemen, you all are seeing this is the chart of gold (XAUUSD). This is one of the most popular charts in the world. Everyone wants to predict.
We have started counting this cycle from the low created by Gold on 6 October 2023. We have done two cycles in it, the first cycle is of 63 trading days, and the second is its double i.e. 126 trading days.
In the shorter cycle (63 BAR), you will see that it has maximum given 10 to 18% returns till date within EVERY 90 days
It has more than doubled in the last two years.And no down train cycle has started yet. And this is nine Cycles from Small Cycle.
Do you think this cycle will continue to grow like this in the future?

13 oct my ideaI use here only 15 tf for support and resistance. Because now a days the volatility of gold is awesome. So 15 timeframe is good. Take entry based on 5 minutes.

Gold 4H – Bullish Setup Ahead of Fed & CPI Week🥇 XAUUSD – Weekly Smart Money Plan | by Ryan_TitanTrader
📈 Market Context
Gold continues to trade near the ₹4,000 mark as traders brace for a volatile week driven by the U.S. CPI release and Federal Reserve remarks.
Recent Fed comments hint that policymakers are open to rate cuts if inflation cools further, boosting gold’s appeal as a hedge against policy easing and market uncertainty.
Meanwhile, tensions in the Middle East and strong central bank demand for gold continue to provide underlying bullish momentum, though short-term pullbacks remain likely.
🔎 Technical Analysis (4H / SMC Style)
• The higher-timeframe BOS (Break of Structure) confirms that gold remains in a bullish market phase, with buyers defending every major retracement.
• The current pullback could target the Potential Reaccumulation Zone around 3947, where liquidity may be swept before the next bullish impulse.
• The Discount Demand Zone (3873–3875) aligns with strong 4H imbalance and previous structure support — ideal for a high-probability buy setup.
• The Premium Supply Zone (4134–4132) is positioned as a liquidity target, where price may react for short-term corrections.
🟢 Buy Zone: 3873–3875
SL: 3866
TP targets: 3947 → 4020 → 4050 → 4130+
🔴 Sell Zone: 4134–4132
SL: 4141
TP targets: 4080 → 4020 → 3950
⚠️ Risk Management Tips
• Wait for H1 ChoCH / BOS confirmation before executing positions.
• Anticipate liquidity hunts near 3950–3970 ahead of CPI or Fed events.
• Use partial scaling and secure partial profits once the structure confirms continuation.
• Avoid entering during the first 15 minutes of major news releases to reduce slippage risk.
✅ Summary
Gold remains structurally bullish on the 4H timeframe, with potential retracement opportunities offering premium entries.
Smart Money may induce a liquidity sweep into 3873–3875 before pushing toward 4130+, where a reaction from institutional supply is likely.
With major macro catalysts this week, traders should expect sharp volatility and manipulative moves before the next major leg develops.
🔔 Stay patient — let the market reveal its intent before entering.
Premium buys remain favored above 3870 while watching for potential distribution near 4130.

GOLD: The Dollar Blinks! Time to 'Pay' at the 0.618 Fibo (4018) The Macro Play: USD Retreat Sets the Stage for Gold's Counter-Attack
The precious metal is catching a bid as the US Dollar softens after hitting its recent highs. The fundamental backdrop is keeping Gold buoyant:
Fed Pivot Narrative: Despite the hawkish undertones in the last FOMC meeting minutes, the market's conviction in two potential Fed rate cuts by year-end remains a powerful tailwind, making non-yielding Gold more attractive.
Geopolitical Fog: While the short-term truce news caused a minor retreat, the overarching safe-haven demand driven by global tensions and the looming US government funding crisis provides critical floor support.
Bottom Line: Gold is navigating a choppy consolidation phase. Short-term pressure exists, but the Long-Term Macro Thesis favors a cautious recovery.
📊 The MatrixFibo PTKT: SCALP Zones Are Active!
Price action shows clear reaction points within the recent sharp move lower. Our plan is to Trade the Reactions at these high-probability confluence zones.
1️⃣ The Aggressive SELL Zone (SELL SCALP Setup)
We are looking for the market to exhaust its short-term recovery rally at major resistance levels.
Primary SELL ZONE: 3997 - 4000 (0.5 Fibo Level):
This area is critical psychological resistance and the 50% retracement of the latest impulse down.
PLAN: Await a failed breakout or clear bearish rejection signal (Pinbar, Bearish Engulfing) at 3997 - 4000.
TARGET: The move should aim to clear the lows, heading straight for 3915 - 3910.
The Ultimate SELL Reversal: 4014 - 4018 (0.618 Fibo Downtrend Zone):
This is the REACTION FIBO 0.618 DOWNTREND H1 ZONE. This level is our strongest strategic SELL point if the bounce extends deeper.
2️⃣ The Key BUY Zone (BUY SCALP Setup)
We treat this area as the final line of defense for the current uptrend structure.
Key Support & BUY SCALP REACT ZONE: 3915 - 3910:
This zone is a Major Confluence point: Key Support, the 0.786 Fibo, and the Uptrend Channel Bottom.
PLAN: Look for strong buying pressure to emerge as price tests 3915 - 3910. Requires a solid Bullish Price Action Confirmation.
TARGET: A successful bounce targets the liquidity back at 3997 - 4000.
🛑 FranCis MatrixFibo Risk Policy
Volatility Alert: Expect large swings around US data and Fed commentary. NEVER TRADE WITHOUT A HARD STOP LOSS (SL) on SCALPS.
Strategy Focus: The market is range-bound. Stick to a Two-Sided Scalping Plan defined by the identified price levels.
Discipline: Only enter trades at or with clear confirmation from the React Zones.

LiamTrading – XAUUSD: Structure BreakLiamTrading – XAUUSD: Structure Break, Preparing for a STRONG DOWNTREND?
Hello trader,
The Gold market has undergone a significant Market Structure Shift, breaking the previous sustainable uptrend. After the key support area around 4000 was breached with high volume, the Bears have taken short-term control.
Currently, the price is experiencing a slight correction after a sharp drop, but overall, it is forming Lower High – Lower Low patterns on the H1 chart, confirming the downward movement.
📊 Technical Analysis (Chart 1H – XAUUSD)
The recent sharp decline has broken the upward structure (Break of Structure - BOS) and created significant inefficiencies/imbalances that need to be filled:
Liquidity Zone (Resistance): $4050 – $4060. This is the resistance peak to watch.
Sell Liquidity Zone (FVG Sell Zone): $4030 – $4040. This is the ideal Fair Value Gap for Bears to re-enter.
Key Support/Buy Scalping Zone: $3925 – $3935 (Confluence area of Fibonacci Extension 2.272).
Swing Buy/Accumulation Zone: $3905 – $3915 (Confluence area of Fibonacci Extension 2.618).
🎯 Main Trading Scenario (Short-term BEARISH)
Sell entry 4000 – 4002
SL 4008
TP 3986 – 3965 3950 – 3923
Sell Entry 4028 – 4031 (FVG)
SL 4036
TP 4022 – 4010 4000 – 3960
Buy Scalping
3926 – 3928
SL 3921
TP 3939 – 3955 3970 – 3990
Buy Bottom Zone 3900 – 3908
SL 3895
TP 3922 – 3945 3970 – 3988
Export to Spreadsheet
🧭 Fundamental View & Market Sentiment
The downward momentum is being driven by the following factors:
Monetary Policy: Fed official Williams' remarks supporting continued rate cuts seem to be reducing the safe-haven demand for Gold. Although rate cuts typically support Gold in the long term (due to "cheap money"), a slowing labour market is a short-term negative signal.
CPI News: The Bureau of Labour Statistics recalling staff to compile the CPI report amid a government shutdown highlights the importance of this data. If CPI is not as expected, it could cause significant volatility.
Market Sentiment: After the structure break, technical selling sentiment may dominate, especially if the price cannot quickly recover to the 4000 level.
📌 Conclusion & Recommendations
Gold has confirmed a short-term structure change to a downtrend. While the long-term trend is not yet clearly defined, the current priority is to seek Sell opportunities when the price retraces to key resistance and FVG areas (such as $4000 and $4030).
Advice: Always adhere to SL (Stop Loss) and prioritise risk reduction when the market shows reversal signals. DO NOT BUY when the downtrend structure is prevailing.
👉 Follow me for detailed updates and the latest trading plans during the session!

Master Technical Indicators1. Understanding Technical Indicators
A technical indicator is a mathematical calculation based on price, volume, or open interest of a security or asset. Indicators are plotted on charts to help traders visualize trends, reversals, and potential entry or exit points.
Traders use these indicators to simplify the complexity of raw price data. Rather than analyzing each candle or tick, indicators smooth out noise and highlight the underlying strength or weakness of a trend. They are particularly effective when used alongside chart patterns, price action, and market sentiment analysis.
Why Are Technical Indicators Important?
They help identify the direction of a trend (up, down, or sideways).
They signal potential entry and exit points.
They assist in determining market strength and volatility.
They provide confirmation for trade setups.
They help in risk management by defining stop-loss and target zones.
2. Types of Technical Indicators
Technical indicators are generally classified into four main categories:
a. Trend Indicators
These show the direction and strength of a market trend.
Examples: Moving Averages, MACD, Average Directional Index (ADX), Parabolic SAR.
b. Momentum Indicators
These measure the speed of price movements, helping traders spot overbought or oversold conditions.
Examples: RSI, Stochastic Oscillator, CCI, Momentum Indicator.
c. Volatility Indicators
They measure the rate of price change or fluctuations, showing how much an asset moves over a specific time period.
Examples: Bollinger Bands, ATR (Average True Range), Donchian Channels.
d. Volume Indicators
Volume-based indicators analyze the strength behind price movements, helping traders confirm trends or reversals.
Examples: On-Balance Volume (OBV), Volume Oscillator, Chaikin Money Flow (CMF).
3. Top Technical Indicators Every Trader Should Master
Let’s dive deep into the most powerful and widely used technical indicators.
a. Moving Averages (MA)
The Moving Average is one of the simplest yet most powerful tools in technical analysis. It smooths price data to identify the direction of the trend.
Types:
Simple Moving Average (SMA) – Calculates the average price over a specific period.
Exponential Moving Average (EMA) – Gives more weight to recent prices, making it more responsive.
How Traders Use It:
Trend Identification:
When price is above the moving average, it indicates an uptrend; below it indicates a downtrend.
Crossovers:
Golden Cross: When the short-term MA crosses above the long-term MA (bullish signal).
Death Cross: When the short-term MA crosses below the long-term MA (bearish signal).
Dynamic Support & Resistance:
MAs often act as support or resistance zones.
Popular Settings:
50-day and 200-day MAs for long-term trends, 9-day and 21-day EMAs for short-term trading.
b. Relative Strength Index (RSI)
Developed by J. Welles Wilder, the RSI measures the magnitude of recent price changes to determine overbought or oversold conditions.
Formula:
RSI = 100 – ,
where RS = Average Gain / Average Loss.
Interpretation:
RSI above 70: Overbought zone (potential sell signal).
RSI below 30: Oversold zone (potential buy signal).
RSI between 40–60: Neutral or consolidation phase.
Pro Tips:
Watch for divergences (price makes a new high, but RSI does not). This often signals a reversal.
RSI can also act as trend confirmation when it stays above 50 (bullish) or below 50 (bearish).
c. Moving Average Convergence Divergence (MACD)
The MACD is a powerful trend-following momentum indicator. It shows the relationship between two EMAs (typically 12-day and 26-day).
Components:
MACD Line: 12-day EMA – 26-day EMA.
Signal Line: 9-day EMA of MACD line.
Histogram: Difference between MACD and Signal line.
How to Use:
Crossover Signals:
Bullish when MACD line crosses above the Signal line.
Bearish when it crosses below.
Zero Line Cross:
When MACD crosses above zero → bullish momentum.
When MACD crosses below zero → bearish momentum.
Divergences:
If price makes new highs while MACD fails to, it signals a weakening trend.
d. Bollinger Bands
Developed by John Bollinger, these bands measure volatility using standard deviations around a moving average.
Structure:
Middle Band: 20-day SMA.
Upper Band: SMA + 2 standard deviations.
Lower Band: SMA – 2 standard deviations.
How to Interpret:
Squeeze: When bands contract, it indicates low volatility and possible breakout soon.
Expansion: When bands widen, it shows high volatility.
Touch of Upper/Lower Band:
Price touching the upper band signals overbought.
Touching the lower band signals oversold.
Pro Tip: Combine Bollinger Bands with RSI or MACD for confirmation.
e. Average Directional Index (ADX)
The ADX, created by Wilder, measures the strength of a trend — not its direction.
Scale:
0–25: Weak or no trend.
25–50: Strong trend.
50–75: Very strong trend.
75–100: Extremely strong trend.
Usage:
A rising ADX indicates strengthening trend momentum.
A falling ADX indicates weakening momentum.
Traders often combine ADX with +DI and -DI lines to detect whether bulls or bears are in control.
f. Stochastic Oscillator
This momentum indicator compares the closing price of an asset to its price range over a set period (usually 14 days).
Formula:
%K = × 100
%D = 3-day SMA of %K.
Interpretation:
Above 80: Overbought.
Below 20: Oversold.
Crossovers between %K and %D lines indicate potential reversals.
Pro Tip: Use with trend direction to avoid false signals — only buy oversold signals in an uptrend and sell overbought signals in a downtrend.
g. Average True Range (ATR)
The ATR measures market volatility by calculating the average range between high and low prices over a given period.
Usage:
Higher ATR: Indicates more volatility (use wider stop-losses).
Lower ATR: Indicates less volatility (use tighter stop-losses).
It helps traders adjust position sizing and risk management strategies.
h. On-Balance Volume (OBV)
The OBV indicator links price movement with volume to measure buying and selling pressure.
Formula:
If today’s close > yesterday’s close → OBV = Previous OBV + Volume.
If today’s close < yesterday’s close → OBV = Previous OBV – Volume.
Interpretation:
Rising OBV confirms upward momentum (buying pressure).
Falling OBV confirms downward momentum (selling pressure).
Divergences between OBV and price can signal reversals.
4. Combining Indicators for Better Accuracy
No single indicator is perfect. The best traders combine multiple indicators to create a confluence of signals that increase trade accuracy.
Popular Combinations:
Trend + Momentum: Moving Average + RSI or MACD.
Volatility + Momentum: Bollinger Bands + Stochastic.
Volume + Trend: OBV + Moving Average.
For example, a trader might go long when:
The price is above the 50-day EMA (uptrend).
RSI crosses above 40 from oversold levels.
OBV is rising — confirming strong buying interest.
5. Common Mistakes Traders Make
Even the best indicators can mislead when misused. Here are some common pitfalls:
Overloading charts with too many indicators:
This creates confusion and conflicting signals.
Ignoring price action:
Indicators should confirm, not replace, price structure analysis.
Using the same type of indicators together:
Combining multiple momentum indicators (like RSI and Stochastic) adds redundancy.
Not adjusting settings:
Default settings may not suit every market; fine-tune them to your asset and time frame.
Trading without confirmation:
Always wait for indicator alignment before entering a trade.
6. Building a Strategy Using Technical Indicators
A robust trading strategy built around indicators should include:
Market Trend Filter:
(e.g., 50 EMA or ADX to determine direction)
Entry Signal:
(e.g., RSI crossing above 30 or MACD bullish crossover)
Exit Signal:
(e.g., RSI reaching overbought or MACD turning bearish)
Stop-Loss and Take-Profit Rules:
(e.g., ATR-based stop-loss for volatility adjustment)
Risk Management:
Risk only 1–2% of capital per trade.
By backtesting your strategy on historical data, you can evaluate its accuracy and profitability.
7. Adapting Indicators for Different Markets
Each market behaves differently. For instance:
Stocks: Indicators like RSI, MACD, and OBV work best due to volume data.
Forex: Moving Averages, ADX, and Bollinger Bands help identify trends in volatile environments.
Crypto: Volatility-based indicators (ATR, Bollinger Bands) are more effective because of rapid price swings.
Adjust your settings and time frames accordingly:
Short-term traders (scalpers/day traders) → 1-min to 15-min charts.
Swing traders → 1-hour to daily charts.
Long-term investors → weekly/monthly charts.
8. The Psychology Behind Indicators
Technical indicators ultimately reflect trader psychology.
When RSI is overbought, it shows euphoria and overconfidence.
When moving averages flatten, it reflects indecision.
High ATR reflects fear and panic; low ATR reflects calmness.
Understanding this emotional rhythm helps traders align technical signals with real-world behavior — the essence of market sentiment analysis.
9. Future of Technical Indicators
With advancements in AI and algorithmic trading, indicators are becoming more adaptive. Machine learning models can now optimize indicator parameters dynamically, improving accuracy. However, human intuition still plays a key role — especially in interpreting false signals and reading macroeconomic trends.
Conclusion
Mastering technical indicators is not about memorizing dozens of formulas; it’s about understanding the story they tell about price, volume, and emotion. The best traders use a balanced approach — combining trend, momentum, volume, and volatility indicators — to develop high-probability trading setups.
To truly master them:
Keep your chart simple.
Focus on 2–3 core indicators.
Always confirm signals with price action.
Backtest your strategy before applying it live.
When used with discipline, patience, and proper risk management, technical indicators can become your guiding compass in the ever-changing ocean of financial markets.
Good will make new ATH next week buy on dip Gold buy on dip recommended bounce from support area , levels given on chart
How My Harmonic pattern projection Indicator work is explained below :
Recent High or Low :
D-0% is our recent low or high
Profit booking zone ( Early / Risky entry) : D 13.2% -D 16.1 % is
range if break them profit booking start on uptrend or downtrend but only profit booking, trend not changed
SL reversal zone (Safe entry ) : SL 23.1% and SL 25.5% is reversal zone if break then trend reverse and we can take reverse trade
Target : T1, T2, T3, T4 and .
Are our Target zone
Any Upside or downside level will activate only if break 1st level then 2nd will be active if break 2nd then 3rd will be active.
Total we have 7 important level which are support and resistance area
Until , 16% not break uptrend will continue if break then profit booking will start.
If break 25% then fresh downtrend will start then T1, T2,T3 will activate
1,3,5,10,15,20 minutes are short term levels.
30 minutes 60 minutes , 2 hours,3 hours, ... 1 day and 1 week chart positional and long term levels

Gold Analysis and Trading Strategy | October 10✅ 4-Hour Chart Analysis
Gold is currently hovering around the MA5 and MA10 (near 3990), with short-term direction still undecided. The MA20 (around 4004) has shifted from support to resistance, indicating that short-term bullish strength is limited.
The Bollinger Bands are narrowing, showing reduced volatility and suggesting the market has entered a consolidation phase. The middle band (4004) is acting as a key upper resistance. After the recent decline, gold is showing a weak rebound but remains within a corrective structure. If it fails to break above 4000–4005, the rebound is likely to be limited, with the risk of another pullback.
✅ 1-Hour Chart Analysis
Short-term moving averages (MA5/MA10) are turning upward, and the price is consolidating around 3995–4000, showing some rebound momentum. However, the MA20 and MA60 above are acting as resistance, limiting further upside potential.
The Bollinger mid-band (around 3978) has been reclaimed, and the price is now near the upper band, but without a clear breakout, indicating insufficient bullish momentum. The 1-hour chart shows a short-term rebound, but with heavy resistance above, if gold cannot hold above 4000–4005, it may quickly retreat again.
🔴 Resistance Levels: 3995–4005
🟢 Support Levels: 3945–3925
✅ Trading Strategy Reference:
🔻 Watch the 3995–4005 zone; if the price is rejected, consider short positions targeting 3970–3950.
🔺 If the price pulls back to 3945–3925 and stabilizes, consider light long positions targeting 3980–4000.
🔥Trading Reminder: Trading strategies are time-sensitive, and market conditions can change rapidly. Please adjust your trading plan based on real-time market conditions.
Part 3 Trading Master Class With ExpertsTypes of Option Traders
Different traders use options for different purposes. Here’s how:
Speculators – Trade options to profit from short-term market moves.
Hedgers – Use options to protect their existing investments (like insurance).
Income Traders – Sell options regularly to collect premium income.
Arbitrageurs – Exploit price differences between spot and derivatives markets.
For example, a portfolio manager holding stocks may buy put options to safeguard against sudden market falls. Meanwhile, a retail trader may sell call options to earn regular premium income.

Part 1 Trading Master Class With ExpertsBasic Terminology in Option Trading
Before diving deep, let’s get familiar with key terms used in options:
Call Option – Gives the buyer the right (not obligation) to buy the underlying asset at a certain price before expiry.
Put Option – Gives the buyer the right (not obligation) to sell the underlying asset at a certain price before expiry.
Strike Price – The fixed price at which the option holder can buy (for calls) or sell (for puts) the underlying asset.
Premium – The price paid to buy the option contract. This is the cost of obtaining the right.
Expiry Date – The date when the option contract expires. After this, the contract becomes invalid.

Elliott Wave Analysis – XAUUSD (10/10/2025)
________________________________________
🔹 1. Momentum
In the October 9th plan, based on H1 momentum and wave structure, I anticipated a strong bearish move, which indeed occurred during yesterday’s late session.
D1 Momentum:
Currently turning downward, meaning the main trend in the coming sessions remains bearish to bring D1 momentum into the oversold zone.
H4 Momentum:
Now showing signs of reversal from the oversold area, suggesting that a short-term recovery wave may appear soon.
H1 Momentum:
Currently approaching the oversold zone, so within the next 1–2 hours, a minor corrective upward move could take place.
________________________________________
🔹 2. Wave Structure
D1 Wave Structure:
We can now see a confirmed bearish reversal candle, whose body is larger than previous bearish candles.
This indicates that the yellow wave ⑤ has likely completed, and I expect a deeper corrective move to unfold — potentially reaching the 3700 area.
H4 Wave Structure:
As mentioned yesterday, we use the price channel for observation, and now the price has closed back inside the channel.
This gives us additional confirmation that wave ⑤ has completed.
With H4 momentum preparing to turn upward, the market is likely to form a corrective upward wave on this timeframe.
H1 Wave Structure:
Currently, a blue ABC correction has formed after yesterday’s strong decline.
Notably, wave C is twice the length of wave A, showing that the panic selling yesterday may have exhausted the sellers.
Combining this with the H4 momentum reversal, it suggests a potential upward move ahead.
Furthermore, after a complete ABC structure, according to Elliott theory, the market often forms another ABC pattern or a 5-wave structure in the opposite direction,
→ therefore, we will now look for Buy opportunities.
________________________________________
🔹 3. Liquidity Zones
Observing the liquidity areas on the chart, there are two key zones to focus on:
• 3953
• 3933
These are the two zones where we will look for Buy setups.
Yesterday’s oversold decline (an irregular wave C) suggests, by Elliott principles, that a strong rebound from the 0.618 retracement up to the previous high is likely —
this will be important for determining our Take-Profit levels.
________________________________________
🔹 4. Trading Plan
Buy Zone 1:
• Entry: 3956 – 3953
• SL: 3943
• TP: 3989
Buy Zone 2:
• Entry: 3934 – 3931
• SL: 3922
• TP: 3953
________________________________________
💡 Note:
This rebound is a technical correction after an oversold sell-off, so it’s recommended to monitor price reaction near TP and consider moving SL to breakeven to secure profits.

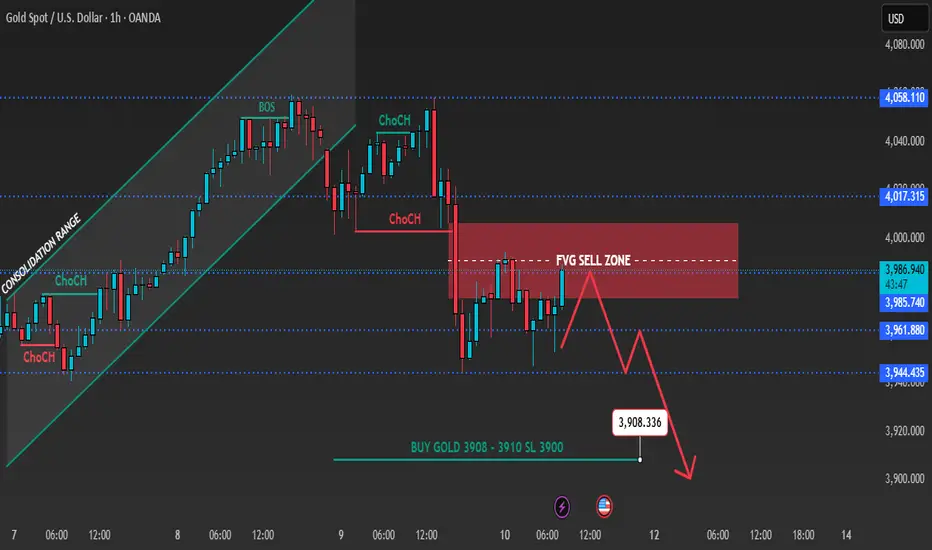
Gold 1H – Price Reaction Ahead of U.S. CPI DataXAUUSD – Intraday Trading Plan | by Ryan_TitanTrader
________________________________________
📈 Market Context
Gold prices remain steady around $3,975, as traders await the U.S. CPI data release later today — a key event that could shape expectations for the Fed’s next rate move.
If inflation cools, the dovish sentiment may boost gold’s safe-haven appeal; however, a hotter CPI print could trigger renewed dollar strength and short-term pressure on XAUUSD.
Market volatility is expected to spike near the release, so liquidity grabs and false breaks are likely before the true direction forms.
________________________________________
🔎 Technical Analysis (H1 / SMC Style)
• The recent Change of Character (ChoCH) confirms short-term bearish control after breaking the bullish structure near 4017.
• FVG Sell Zone (4015–4017) aligns with premium imbalance and prior liquidity — ideal for short setups if price retests that zone.
• BOS to the downside was confirmed at 3960, showing sellers in control.
• The discount zone 3908–3910 is a strong demand area where buyers may step in after liquidity sweep below 3910.
________________________________________
🟢 Buy Zone: 3908–3910
SL: 3900
TP targets: 3920 → 3940 → 3960+
🔴 Sell Zone: 4015–4017
SL: 4022
TP targets: 4000 → 3985 → 3970
________________________________________
⚠️ Risk Management Tips
• Wait for M15 ChoCH / BOS confirmation before entering either side.
• Use partial position sizing around CPI release — volatility may cause large wicks.
• Watch for liquidity hunts near 3980–3990 before CPI, then confirm structure direction.
________________________________________
✅ Summary
Gold is consolidating below key resistance while awaiting U.S. inflation data.
Smart money may engineer a liquidity sweep toward 4015–4017 (FVG) before resuming the bearish leg into 3910.
However, if CPI comes in softer than expected, buyers may defend 3908–3910, sparking a recovery back toward 3980+.
🔔 Stay alert around CPI release hours — expect manipulative price action and confirm structure breaks before committing to directional trades.
XAUUSD – Breakdown After Ceasefire & Fed Comments📉 Market Overview
Gold (XAUUSD) dropped over 2%, sliding from $4,012/oz to $3,945/oz, marking a sharp $67 decline overnight.
The selloff came as two key catalysts hit the market:
🕊 Israel–Hamas ceasefire agreement cooled down geopolitical tensions.
💬 Fed’s Barr pushed back against October rate cuts, sending USD higher and pressuring gold.
Despite the drop, price action suggests a temporary corrective phase, with gold now stabilising near a short-term support zone.
📊 Technical Structure (MMFLOW View)
Gold has confirmed a Head & Shoulders (H&S) breakdown pattern, with a neckline retest around $4,014 – $4,033 acting as resistance.
After the breakdown, price rebounded slightly but continues to trade below the structure, showing that bears remain in control short-term.
The short-term support zone sits around $3,945, and if broken, could accelerate the decline towards $3,912 – $3,885, aligning with deeper liquidity areas.
🔑 Key Zones to Watch
Resistance (Breakdown Zone): 4,014 – 4,033
Support (Short-term): 3,945 – 3,912
Liquidity/Buy Zone: 3,885 – 3,878
💡 MMFLOW Trading Scenarios
🔵 BUY SCALP Zone: 3,912 – 3,910
🔴 Stop Loss: 3,905
✅ Take Profit: 3,916 – 3,920 – 3,925 – 3,930 – 3,940 – 3,950 – ???
Trading View:
The market is still digesting recent fundamentals; volatility remains high.
A short-term rebound from 3,910 is possible as liquidity builds up near this demand zone.
However, unless price reclaims 4,014, any bounce may only be corrective before further downside continuation.
🧭 MMFLOW Insight
Even though gold faces bearish momentum, macro risks still support a long-term bullish narrative:
U.S. government shutdown risks remain unresolved.
Fed may turn dovish later in Q4 if labour data weakens.
Liquidity gaps below $3,900 could attract smart money accumulation zones.
⚠️ Trading Notes
✅ Always set Stop Loss – NFP-style volatility can occur post-Fed comments.
✅ Avoid chasing after breakdown candles. Wait for pullback entries at key levels.
✅ Be patient — the best setups form when liquidity is fully absorbed.
📍 Summary
Gold continues to trade under pressure after geopolitical easing and hawkish Fed tones.
Watch for price action around $3,910 – $3,945; this range will likely define the next major impulse.
Stay alert — once liquidity clears, MMFlow will be watching for smart-money reentry signals from key OB/CP zones.

GOLD (XAUUSD) 1H CHART ANALYSIS – BEARISH SETUP AHEADGOLD (XAUUSD) 1H CHART ANALYSIS – BEARISH SETUP AHEAD
🔍 Technical Overview
Current Price: Around $4,036 – $4,040
Trendline: A key uptrend line (blue) has been broken, signaling weakening bullish momentum.
Resistance Zone: Between $4,058 – $4,062, marked by red arrows 🚫
Support Zone: Near $3,930 – $3,940, highlighted by the purple box 🟪
📊 Market Structure
The market recently made a lower high formation after failing to break above $4,062, indicating bearish divergence.
Multiple rejection candles at the resistance zone confirm selling pressure 💣.
The blue projection lines suggest a potential bearish retracement back toward the support zone around $3,930.
🧭 Key Levels
Type Price Level Notes
🔺 Resistance 4,058 – 4,062 Double top zone, strong sellers present
⚖️ Mid-Level 4,000 Psychological round number, interim support
🟣 Support 3,930 – 3,940 Major buying interest, possible reversal zone
📉 Expected Price Action
🔻 Scenario 1 (Primary):
Price may retest $4,050 – $4,060 resistance area, form another rejection, and drop toward $3,940 support.
Potential short entry near $4,050 – $4,060
Target $3,940
Stop loss above $4,070
🔄 Scenario 2 (Alternative):
If the price holds above $4,060, a breakout could trigger a bullish continuation toward $4,100+.
🧠 Trader’s Insight
⚠️ Bearish bias remains valid while below $4,060.
🕒 Watch for price reaction around the trendline retest and confirmation candles (bearish engulfing or pin bars).
📈 Smart traders might wait for confirmation below $4,000 before adding short positions.
💬 Summary
➡️ Bias: Bearish below $4,060
➡️ Target: $3,940
➡️ Invalidation: Break and close above $4,070
📍 “Trendlines break fast, but support zones hold stronger — trade smart, not fast.”

XAUUSD- Trend Reverse for a short term Daily It's need a little pullback back to the daily FVG
4H - We have one candle close in our Direction which is bearish
15M - Entry in a 15M FVG with a conformation of the Engulying candle

Gold Neowave Bulletin| 10/10/2025
Namaskaram Everyone
Welcome to intelligent investor, we provide market insights by synchronising and combining all the price action waves from different time frames and gives you single trend.
Here are all our previous gold analysis, with this you will understand how with Neowave Theory you will have an edge in the market.
Previous Neowave Bulletin
09/12/2025
07/10/2025
01/10/2025
30/09/2025
29/09/2025
OANDA:XAUUSD FOREXCOM:XAUUSD FX:XAUUSD VANTAGE:XAUUSD MCX:GOLD1!

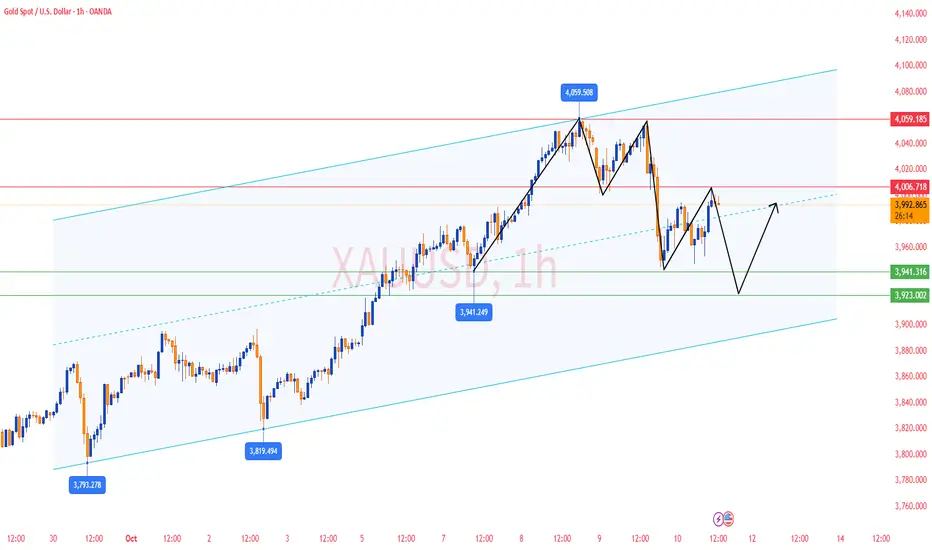
A strongly bullish outlook for goldThe current price is testing the 0.382 ($3,982.313) retracement level, a common support area for a Wave 4 correction.
A Fibonacci extension tool projects potential targets for the upcoming Wave 5. The key target area highlighted is near the 2.0 extension level at $4,247.340, with other potential levels noted, such as the 1.618 level at $4,140.453.
The gold is in a powerful uptrend. The recent pullback is interpreted as a temporary and normal correction (Wave 4) within this larger trend. According to this Elliott Wave count, if the price holds support around the current level (~$3,980), the expectation is for a new upward impulse (Wave 5) to begin, potentially targeting the $4,250 area. The bullish outlook is strongly supported by the signals from the Ichimoku Cloud indicator.

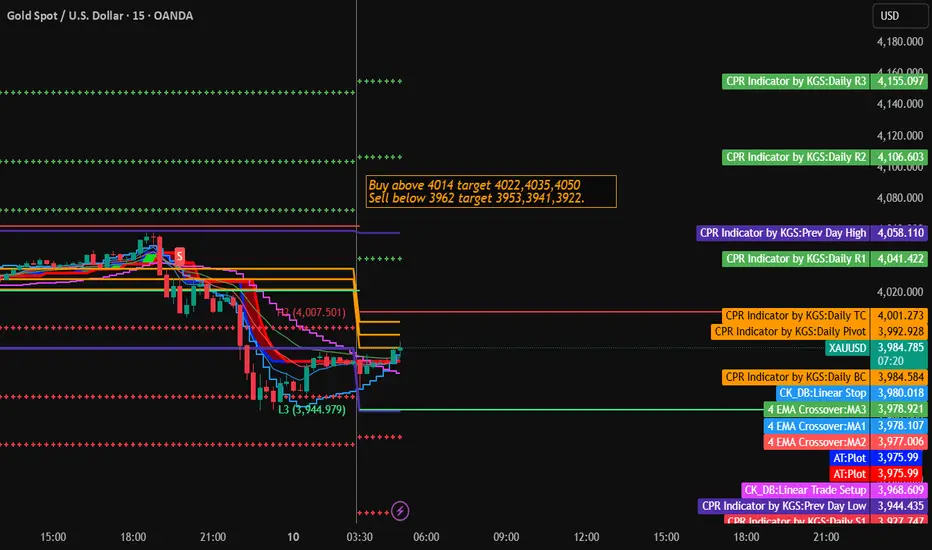
Gold Trading Strategy for 10th October 2025💰 GOLD (XAU/USD) Trading Setup
⏰ Timeframe: 1 Hour & 15 Minutes
🟢 Buy Setup
💹 Entry: Buy above the high of the 1-hour candle — once it closes above $4014
🎯 Targets:
🎯 Target 1: $4022
🎯 Target 2: $4035
🎯 Target 3: $4050
🛡️ Stop Loss: Below $4005 (adjust with risk tolerance)
📈 Trade Logic:
If the hourly candle closes above $4014, it indicates bullish strength. Look for confirmation before entering a long position. Momentum above this level could push prices towards the next resistance zones.
🔴 Sell Setup
💹 Entry: Sell below the low of the 15-minute candle — once it closes below $3962
🎯 Targets:
🎯 Target 1: $3953
🎯 Target 2: $3941
🎯 Target 3: $3922
🛡️ Stop Loss: Above $3975 (adjust with market conditions)
📉 Trade Logic:
If the 15-min candle closes below $3962, bearish momentum is likely to continue. Break below this level may open room for further downside.
⚠️ Disclaimer
📜 This analysis is for educational and informational purposes only.
💼 Not financial advice. Always conduct your own research or consult with a certified financial advisor before making any trading decisions.
📊 Trading in commodities and financial markets involves significant risk. Past performance is not indicative of future results.