Daily Plan: Gold Targets 7th Straight Weekly Gain |MMFLOWTRADING📊 Market Context
Gold holds firm above $3,850, aiming for its 7th consecutive weekly gain.
🔥 Main driver: Risks from a prolonged U.S. government shutdown.
📉 54% probability of the shutdown lasting 29 days (Polymarket) → directly impacting gold sentiment.
🛡 Safe-haven demand & BUY-side FOMO keep fueling momentum.
⚖️ Still, profit-taking at higher resistance zones could trigger sharp swings before the next directional move.
🔎 Technical Analysis (H1/H4)
📈 Main trend: Bullish, but consolidating near 3,850.
🚧 Key Resistances: 3882–3884 & 3934–3936 (Liquidity Sell Zones).
🏦 Key Supports: 3797–3795 & 3756–3754 (Buy Zones).
🎯 Key Levels: 3850 – 3880 – 3900.
📈 Trading Scenarios & Plan
✅ SELL ZONE 1: 3882–3884
SL: 3890
TP: 3878 – 3874 – 3870 – 3865 – 3860 – 3850 – 3840 – ???
✅ SELL ZONE 2: 3934–3936
SL: 3940
TP: 3930 – 3925 – 3920 – 3910 – 3900 – ???
✅ BUY ZONE 1: 3797–3795
SL: 3790
TP: 3800 – 3810 – 3820 – 3830 – 3840 – ???
✅ BUY ZONE 2: 3756–3754
SL: 3750
TP: 3760 – 3770 – 3780 – 3790 – 3800 – ???
⚠️ Risk Management Notes
🌀 U.S. shutdown headlines may spark unexpected volatility.
🕵️♂️ Focus on BUY setups at support, avoid chasing FOMO at highs.
❌ Consider SELL only if clear rejection signals form at resistance zones.
✅ Summary
Gold remains supported by safe-haven flows, eyeing a 7-week winning streak.
🎯 Strategy:
BUY setups: 3797–3795 & 3756–3754.
SELL setups: 3882–3884 & 3934–3936.
📢 Follow MMFLOW TRADING for real-time updates & BIGWIN setups!
Trade ideas
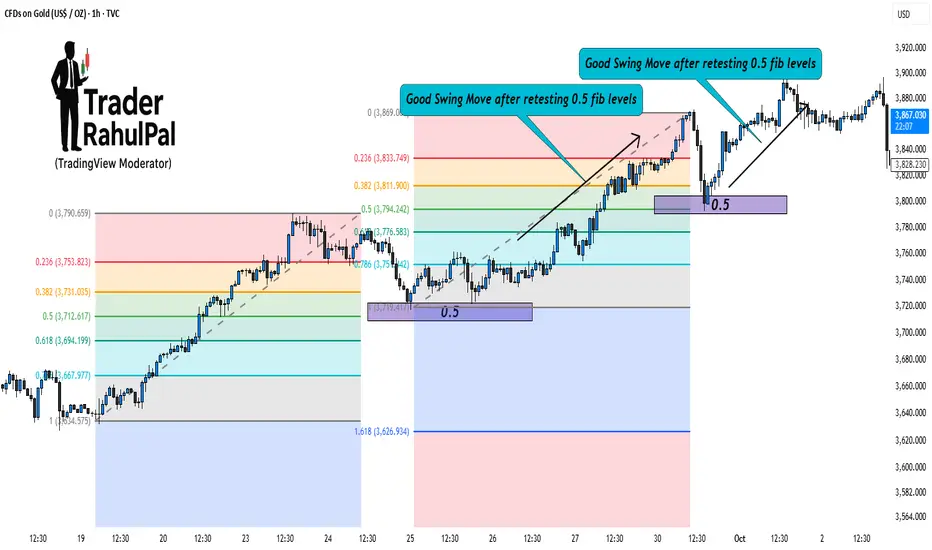
1 of the best Gold Swing Trading Strategy with Fibonacci Levels!Hello Traders!
Gold (XAU/USD) is a perfect instrument for swing trading because of its clean technical reactions.
One of the most reliable tools to trade gold swings is the Fibonacci retracement .
When used correctly, it helps you catch pullbacks and ride the next wave in the trend. Let’s break it down step by step.
1. Identify the Swing Move
First, find a strong impulse move on gold, either bullish or bearish.
This becomes your “anchor move” for drawing Fibonacci levels.
The idea is to wait for price to retrace part of this move before continuing in the main direction.
2. Draw Fibonacci Levels
Take the swing low to swing high (for bullish) or swing high to swing low (for bearish).
Mark key retracement levels: 38.2%, 50%, and 61.8% .
These levels often act as strong support or resistance zones for gold.
3. Look for Confirmation
Don’t trade blindly at a Fib level. Wait for confirmation like reversal candlesticks (pin bars, engulfing) or RSI divergence.
Volume spikes near Fibonacci zones also confirm institutional buying/selling.
4. Entry & Risk Management
Enter trades near 38.2%, 50%, or 61.8% retracements when confirmation appears.
Place stop loss just beyond the next Fibonacci level.
Set targets at previous swing highs/lows or Fibonacci extension levels like 127% and 161.8%.
5. Why It Works Well on Gold
Gold respects technical levels strongly due to high liquidity.
Institutions also use Fibonacci retracements to scale in and out of positions.
This makes Fibonacci one of the most effective tools for swing traders in gold.
Rahul’s Tip:
Always combine Fibonacci with structure. If a Fib level aligns with a key support/resistance, that zone becomes even stronger.
Conclusion:
Swing trading gold with Fibonacci retracements is simple yet powerful.
By focusing on impulse moves, waiting for retracements, and confirming with price action, you can trade gold with more confidence and less guesswork.
If this post gave you a clear strategy, like it, share your thoughts in comments, and follow for more practical gold trading setups!
SELL XAU USDThis setup on XAUUSD is based on a bullish reversal pattern. After multiple rejections near support, a long entry was taken with a defined stop loss below the recent swing low. The target is set at a 3.3 Risk-to-Reward ratio, aligning with momentum and price structure.
Entry: After bullish confirmation candle
Stop Loss: Below the rejection zone
Take Profit: At projected resistance zone (3.3R)
Reasoning: Price showed strong rejection wicks, increasing buy pressure, and higher volume support.
This trade idea focuses on risk management first — accepting a small controlled loss while targeting a larger potential gain.

Cross-Market Arbitrage Opportunities1. Understanding Cross-Market Arbitrage
Arbitrage is the simultaneous buying and selling of an asset to profit from price differences in different markets or forms. Cross-market arbitrage occurs when an asset, security, or derivative is traded across two or more markets (such as stock exchanges, commodity markets, or currency markets), and a trader exploits the temporary price mismatch.
1.1 Basic Concept
Imagine a stock listed on two exchanges—say, Exchange A and Exchange B. If the stock trades at $100 on Exchange A but $102 on Exchange B, a trader could theoretically buy at $100 on Exchange A and sell at $102 on Exchange B, locking in a risk-free profit of $2 per share (ignoring transaction costs). This opportunity exists because markets are not perfectly efficient at all times. Cross-market arbitrage seeks to exploit such temporary inefficiencies.
1.2 Importance in Financial Markets
Cross-market arbitrage contributes to:
Market efficiency: By exploiting price differences, arbitrageurs help align prices across markets.
Liquidity enhancement: Arbitrage strategies increase trading activity and liquidity.
Risk management: Investors use cross-market arbitrage in hedging strategies to manage exposure to price fluctuations.
2. Types of Cross-Market Arbitrage
Cross-market arbitrage can be categorized based on the types of assets, markets, and instruments involved. Below are the most common types:
2.1 Stock Arbitrage Across Exchanges
Stocks listed on multiple exchanges often exhibit price discrepancies due to differences in trading hours, liquidity, and investor behavior.
Example: An Indian company’s stock listed both on the NSE (National Stock Exchange) and BSE (Bombay Stock Exchange). If NSE trades at ₹1,000 and BSE at ₹1,005, arbitrageurs can buy on NSE and sell on BSE simultaneously.
2.2 Currency Arbitrage
Foreign exchange markets provide cross-market opportunities when the same currency pair trades at slightly different rates in different markets.
Triangular arbitrage is a common method, where traders exploit discrepancies among three currencies in different forex markets.
Example: USD/INR trades at 83.50 in New York and 83.60 in London. Buying USD in New York and selling in London can yield a profit.
2.3 Commodity Arbitrage
Commodities like gold, oil, and agricultural products are often traded in multiple markets. Price differences can arise due to storage costs, transportation costs, and market demand.
Example: Gold trades at $1,900 per ounce on the London Bullion Market and $1,905 in Mumbai. Traders can buy in London and sell in Mumbai after accounting for transaction costs.
2.4 Derivative and Futures Arbitrage
Arbitrage opportunities exist between the spot market and the futures market or across derivative exchanges.
Cash-and-carry arbitrage is a common example where traders buy an underlying asset in the spot market and sell futures contracts if the futures price is overpriced relative to the spot price.
Reverse cash-and-carry occurs when futures are underpriced.
3. Mechanics of Cross-Market Arbitrage
To execute a cross-market arbitrage strategy, traders follow these steps:
3.1 Identify Price Discrepancies
The first step is to monitor multiple markets and identify assets trading at different prices. Sophisticated traders use algorithmic systems, real-time data feeds, and market scanners to detect these differences within milliseconds.
3.3 Simultaneous Execution
Cross-market arbitrage requires executing buy and sell orders almost simultaneously to avoid market risk (the risk of prices changing before both trades are completed). This is often achieved through:
High-frequency trading (HFT) algorithms
Direct market access (DMA) platforms
Automated trading bots
3.4 Risk Management
Even “risk-free” arbitrage carries risks such as:
Execution risk
Liquidity risk
Regulatory restrictions
Currency or settlement risk in international markets
Professional arbitrageurs hedge these risks using derivatives or diversification strategies.
4. Popular Cross-Market Arbitrage Strategies
4.1 Dual-Listed Stock Arbitrage
Concept: Exploit price differences in a stock listed on two exchanges.
Example: Infosys Ltd., dual-listed in India and the US as ADRs (American Depository Receipts). Traders can arbitrage price differences between NSE/BSE and NYSE markets.
4.2 Index Arbitrage
Concept: Exploit differences between a stock index and its futures contract.
Mechanism: If the futures price is higher than the fair value implied by the index, traders buy the index components and sell futures simultaneously.
4.3 Cross-Currency Arbitrage
Triangular arbitrage involves three currencies. For instance, if USD/INR, USD/EUR, and EUR/INR exchange rates are misaligned, traders can make a profit by converting currencies sequentially.
4.4 Commodity Arbitrage
Traders exploit price discrepancies in commodities across global exchanges, often factoring in shipping, storage, and hedging costs.
Example: Oil traded in NYMEX versus Brent crude in ICE Europe.
4.5 Derivative Arbitrage
Exploiting differences between options, futures, and underlying assets.
Example: Convertible bond arbitrage, where traders hedge the bond portion and speculate on the stock portion to lock profits.
5. Advantages of Cross-Market Arbitrage
Risk-Adjusted Returns: Offers relatively low-risk profits when executed correctly.
Market Efficiency: Aligns prices across markets, reducing mispricing.
Liquidity Generation: Arbitrage trading increases market depth.
Diversification: Arbitrage can diversify an investor’s portfolio by introducing trades that are market-neutral.
Predictability: Unlike directional trades, arbitrage profits rely on price discrepancies rather than market trends.
6. Challenges and Risks
Despite being considered “low-risk,” cross-market arbitrage has challenges:
6.1 Execution Risk
Delays in order execution can erase profits. Markets move quickly, so any lag can turn an arbitrage opportunity into a loss.
6.2 Transaction Costs
Trading fees, broker commissions, and taxes can reduce or nullify arbitrage gains.
6.3 Liquidity Risk
Insufficient market liquidity can prevent traders from executing trades at desired prices.
6.4 Regulatory Risk
Different countries have distinct trading rules and capital controls, especially for cross-border arbitrage.
6.5 Currency Risk
For international arbitrage, fluctuations in exchange rates can impact profits.
6.6 Competition
High-frequency trading firms and institutional players dominate cross-market arbitrage, making it less accessible for retail traders.
7. Future Trends
AI-Powered Arbitrage: AI models will identify patterns and predict mispricings with greater accuracy.
Blockchain and Cryptocurrencies: Cross-exchange crypto arbitrage is gaining traction due to high volatility and fragmented exchanges.
Global Market Integration: Increased connectivity may reduce arbitrage opportunities but also create short-lived micro-opportunities.
Retail Access: As technology becomes more accessible, retail investors may participate in smaller-scale arbitrage.
8. Conclusion
Cross-market arbitrage is a sophisticated, yet fundamentally simple, trading strategy that capitalizes on temporary price discrepancies across markets. It requires speed, precision, and careful risk management. While large institutional players dominate this space, technology is gradually enabling wider participation.
Arbitrage benefits markets by enhancing efficiency, improving liquidity, and contributing to price discovery. However, it is not without risks. Transaction costs, execution delays, and regulatory hurdles are significant challenges. Understanding the mechanics, types, and tools of cross-market arbitrage is essential for traders seeking to profit in an increasingly competitive global market.
Ultimately, successful cross-market arbitrage combines market insight, technological proficiency, and disciplined execution, making it a cornerstone strategy for risk-conscious investors in the 21st century.

LiamTrading – Gold Plan: Wide Range + US Politics Exert PressureLiamTrading – Gold Plan: Wide Range + US Politics Exert Pressure
Gold continues to fluctuate within a wide range as market sentiment is heavily influenced by news from the United States. On 3rd October, the US Senate is expected to re-vote on the temporary budget bill. If it fails, the federal government could shut down, extending into the next week. This will undoubtedly have a significant impact on safe-haven flows, making gold more sensitive to key technical resistance zones.
📊 Technical Analysis – Chart H1
Gold is moving within a wide sideways structure, oscillating around strong resistance – support zones.
Fibonacci Resistance + Psychological level around 3878–3881 → suitable for short-term Sell scalping.
Confluence support (Retest + Volume) around 3828–3830 → ideal zone to watch for Buy, expecting a recovery wave.
The larger trend still leans towards an increase, however, in the short term, the market will experience several liquidity sweeps.
🎯 Trading Scenario
Sell (short-term – prioritise on M15):
Entry: 3878–3881
SL: 3886
TP: 3860 – 3855 – 3840 – 3822 – 3810
Buy (retest support + volume):
Entry: 3828–3830
SL: 3822
TP: 3845 – 3860 – 3877 – 3890
📌 Conclusion
Today's range is quite wide, suitable for scalping according to psychological resistance zones.
Short-term Sell at Fibonacci resistance points.
Buy when price retests confluence support with volume.
Political news from the US will be a catalyst causing significant gold volatility, so it's crucial to maintain disciplined capital management.
👉 Keep a close watch on the scenarios, I will update regularly as the market experiences new movements.

Elliott Wave Analysis XAUUSD – 10/03/2025📊
________________________________________
🔹 Momentum
• D1 timeframe: Momentum is currently declining → the corrective process is likely to continue until D1 enters the oversold zone and reverses.
• H4 timeframe: Momentum is preparing to turn upward → today we may see a bullish move.
• H1 timeframe: Momentum is heading into the oversold zone → the current H1 decline is weakening, which may lead to a bullish move aligned with H4. This potential rally could last for about 4–5 H4 candles.
________________________________________
🔹 Wave Structure
• D1: Price is still within the wave 5 target zone without a clear breakout. However, D1 momentum suggests that a corrective decline may continue.
• H4: An ABC structure has formed → the current rebound may be:
o The start of a new uptrend.
o Or part of a more complex correction.
• H1: Showing a rebound, which could be:
o Wave 1 of a new uptrend.
o Or wave A of a corrective 3-wave ABC move.
⏩ In either case, the current decline can be identified as wave 2 (purple) or wave B (blue).
• Downside targets:
o Zone 1: 3842
o Zone 2: 3830
Afterward, the market is expected to rise:
• If it is wave C → target equals wave A at 3885 (after 3842 support) or 3874 (after 3830 support).
• If it is wave 3 (purple) → minimum target = 1.618 of wave 1 (purple).
________________________________________
🔹 Trading Plan
Scenario 1
• Buy Zone: 3843 – 3841
• SL: 3833
• TP1: 3862
• TP2: 3874
• TP3: 3885
Scenario 2
• Buy Zone: 3831 – 3829
• SL: 3818
• TP1: 3862
• TP2: 3874
• TP3: 3885
________________________________________
👉 Main strategy: Look for buy entries around 3842 or 3830 support zones, targeting 3874 – 3885.

Gold Trading Plan | Limited Downside, Key Fibo Zones in Play🌍 Market Context
Gold is facing renewed selling pressure after yesterday’s bounce from the $3,820 area.
Risk-on sentiment and fresh USD buying are weighing on XAU/USD.
However, expectations of Fed rate cuts later this year and geopolitical tensions remain supportive, limiting deeper downside moves.
📊 Technical Analysis – Fibo Matrix Setup
🔴 SELL Reaction Zones
386x – 388x (Fibo retracement 0.5 – 0.618 + 0.786 confluence)
→ Intraday SELL scalp zone with strong rejection probability.
3881 – 3892 (Fibo 1.5 – 1.618 downtrend extension)
→ Key SELL liquidity zone for deeper rejection.
🟢 BUY Support Zones
3820 – 3819 (short-term recovery base) → Initial intraday support.
3795 – 3793 (Fibo 1.5 – 1.618 recovery zone) → Major liquidity pocket, ideal for BUY setups if tested.
🎯 Trading Scenarios
1️⃣ SELL Setup
Entry: 386x – 388x (watch rejection candlesticks).
Target: 3820 → 3795.
Stop Loss: Above 3892.
2️⃣ BUY Setup
Entry: 3795 – 3793 with bullish confirmation.
Target: 3860 → 3880.
Stop Loss: Below 3785.
⚡ Key Notes
USD momentum is crucial – if dollar strength continues, Gold may retest 379x zones.
Fed’s rate cut outlook and geopolitical headlines remain the “floor” for Gold.
Stick to clear Fibo reaction zones for best risk-to-reward setups.
💬 Community Insight:
Do you expect Gold to hold 3820 before bouncing, or will we see a flush into 379x liquidity?
Drop your setups below 👇

XAUUSD – Prioritise Sell After Breaking Trendline
Hello Traders,
Gold has experienced a strong upward movement for several consecutive days, but currently, the market is showing significant reversal signals. The upward trendline on H4 has been broken, confirming the weakening buying momentum. In the medium term, the preferred scenario will be selling rather than continuing to chase buys.
Basic Context
The US Treasury has just repurchased an additional 2 billion USD in bonds, raising the total repurchase this week to 4.9 billion USD. This move indicates an effort to stabilise the bond market but also reflects significant pressure on the USD and the US financial situation.
In the short term, the injection of additional bond liquidity makes gold's movement more unpredictable, and the trendline break at this time is an important warning signal.
Technical Perspective
Breaking the upward trendline → confirms a structural change.
MACD signals weakening, with buyers losing clear strength.
The 3865 – 3868 zone is a beautiful resistance retest point to Sell.
If the price falls deeply, the support zones around 3830 – 3810 – 3790 will be the next targets.
Today's Trading Scenario
Sell (main priority):
Entry: 3865 – 3868
SL: 3875
TP: 3855 – 3832 – 3810 – 3790
Buy Scalping (counter-trend – high risk):
Entry: 3803 – 3805
SL: 3795
TP: 3822 – 3835 – 3850
Conclusion
Gold has broken the trendline, prioritising Sell in the short and medium term.
News from the US bond market further emphasises the risk of instability, making counter-trend Buy moves suitable only for short-term Scalping.
Follow me for the earliest updates on scenarios as price paths change.

Gold Holds Above 3850 But Faces Resistance at 3890–95 ZoneAfter printing a rejection candle on Wednesday, gold followed up with further weakness yesterday, but once again bulls managed to defend and push the price back above 3850, securing a daily close above this level. This makes 3850 the immediate support to watch, and only a confirmed H4 close below it could open the door for a deeper test of the 3810–3800 zone, which remains the next key support area. The current price action suggests that the much-expected pullback is underway, though it looks more like a healthy cooldown rather than a reversal, as the broader structure remains bullish. On the upside, the 3890–3895 zone is acting as immediate resistance and will be the key hurdle for bulls in the short term.

Gold Day Trading Outlook: Resistance Holding! Gold is showing signs of weakness as the resistance around 3860–3865 continues to hold strong, keeping the intraday sentiment tilted to the bearish side. As long as price stays below this band, the market is vulnerable to further downside pressure with immediate support seen near 3827 and an extended target towards 3798. Any minor pullbacks into the 3855–3860 region may attract sellers, maintaining the short-term bearish structure. However, a decisive hourly close above 3865 would invalidate this bearish view and shift the bias back to the upside, opening the door for a possible retest of 3880–3900. Until then, day trading leans bearish with sellers holding the upper hand. Trade safe !

Gold Retreats $80 from $3998 New Record, Bulls Defending $3850US government shutdown raised fiscal concerns triggering bullish rally reaching new ATH at $3898 which quickly prompted retail profit booking though initial footprints may point towards institutional games to sideline retail buyers.
All the same, the dip was gradually bought and the metal is seen stabilizing around $3850 after mild retracement from $3863 resistance.
Bulls face immediate hurdle at $3863-$3868 which keeps recovery capped. Decisive break above $3868 followed by $3873 will place the rally forward on the golden path aiming retest of $3898 followed by $3908-$3914
On the flip side, rejection from $3863-$3873 fence will indicate willingness to revisit $3820-$3805

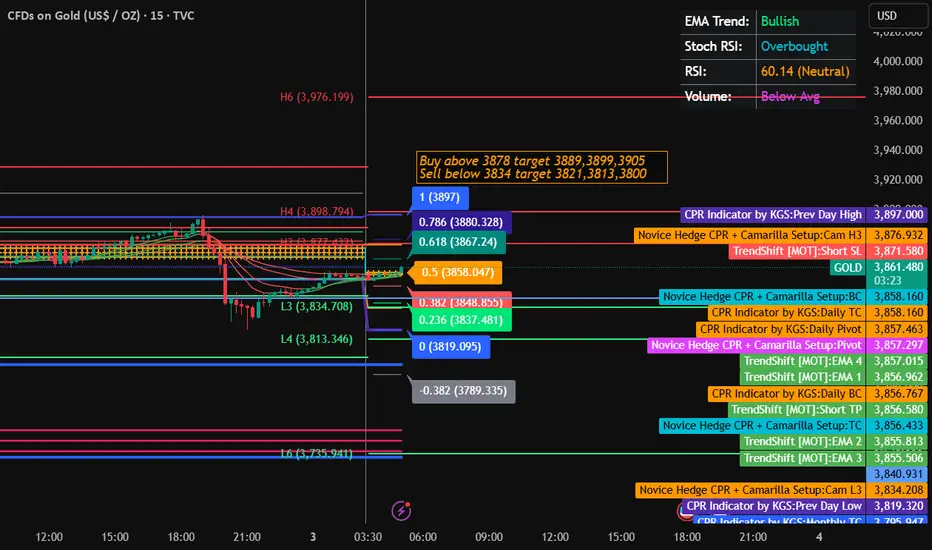
Gold Trading Strategy for 03rd October 2025Gold Intraday Trade Setup
📊 Trade Setup
✅ Buy Opportunity
Condition: Enter long above the High of 15-minute candle, if it closes above $3878
Targets:
🎯 Target 1: $3889
🎯 Target 2: $3899
🎯 Target 3: $3905
❌ Sell Opportunity
Condition: Enter short below the Low of 15-minute candle, if it closes below $3834
Targets:
🎯 Target 1: $3821
🎯 Target 2: $3813
🎯 Target 3: $3800
💰 Trade Execution Notes
⏱️ Timeframe: 15-minute chart
📌 Levels are trigger-based (not market orders).
🧾 Keep strict stop-loss at opposite side of trigger.
⚖️ Use proper position sizing and risk management.
⚠️ Disclaimer:
This trade setup is for educational and informational purposes only. It is not financial advice or a recommendation to buy/sell securities. Trading gold, commodities, and derivatives involves high risk of financial loss. Please consult with a certified financial advisor before making any investment decisions. Past performance does not guarantee future results.
LiamTrading – INTRADAY TRADING SCENARIO
When we look at the global financial landscape, an interesting picture emerges:
Equities – All Time High (ATH)
Housing Prices – ATH
Bitcoin – ATH
Gold – ATH
Money Supply – ATH
National Debt – ATH
CPI Inflation – averaging 4% per year since 2020, double the Fed’s “target”
Federal Reserve – continuing rate cuts this month
Clearly, easy money combined with inflationary pressure is a powerful driver pushing gold to new historical levels. This makes buying with the trend more reasonable than ever.
📊 Technical Analysis – H1 Chart
Gold is moving within a well-defined upward channel.
Volume Profile highlights the POC around 3840–3850, a key zone to watch for scalping buys.
The VAL coincides with the rising trendline near 3820–3822, offering strong confluence for medium-term buys.
If price breaks above 3895 to confirm a new ATH, trend-following buys remain the priority.
Key resistance: 3913–3915, suitable for short-term scalping sells.
🎯 Trading Scenarios
Buy scalping: 3845 | SL 3839 | TP 3856 – 3870
Buy zone (main): 3820 – 3822 | SL 3816 | TP 3832 – 3845 – 3860 – 3875 – 3890
Sell scalping: 3915 – 3913 | SL 3920 | TP 3900 – 3885 – 3872 – 3860
Buy breakout: If price breaks ATH 3895 and confirms, continue buying with the trend → Open targets towards 3915+
📌 Conclusion
Gold remains in a strong uptrend, both fundamentally and technically. Short-term pullbacks are simply opportunities to add to buy positions. However, traders should watch the immediate resistance zones to optimise entries.
👉 This is my personal outlook on XAUUSD, not financial advice.
Follow me to stay updated with the latest daily gold scenarios 🔥

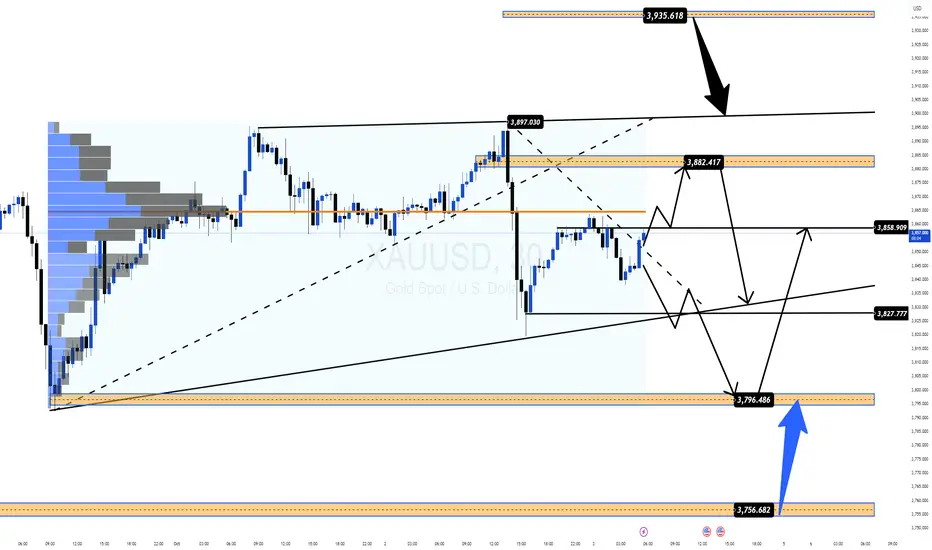
Gold Market Outlook – Bullish Trend Building MomentumGold continues to follow a structured bullish cycle, where each consolidation phase has been followed by a breakout and expansion. Market behavior shows liquidity being collected in sideway ranges, then released to fuel upward momentum.
At the current stage, price is trading around $3,870, showing signs of a potential short-term pullback to gather liquidity from the mid-zone. Once this corrective move stabilizes, the chart suggests a renewed bullish impulse with a projected upside target toward the $3,965 level.
This pattern highlights that the market remains in a controlled bullish phase, where temporary retracements are acting as setups for continuation rather than reversal. The underlying flow still favors higher levels as long as buyers maintain activity after corrections.

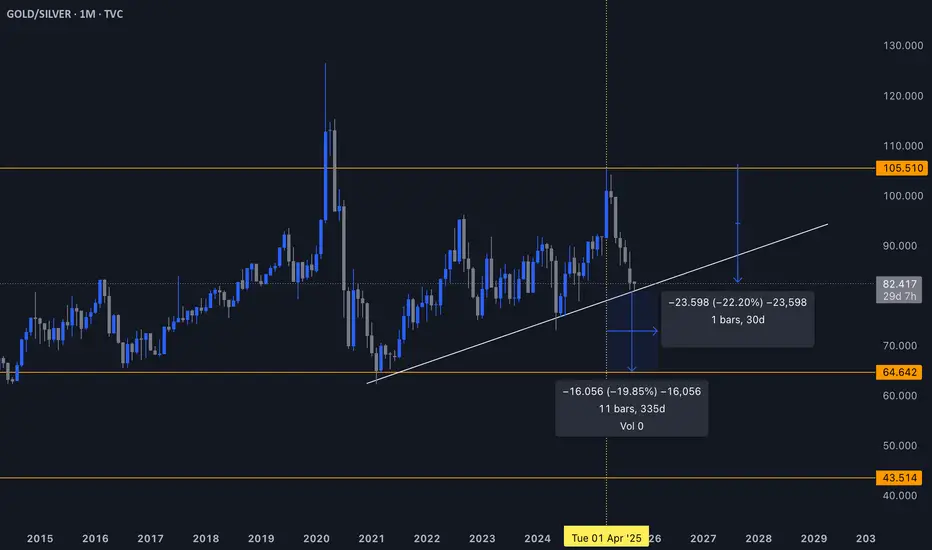
The Gold/Silver Ratio: Why It Matters So Much?The Gold/Silver ratio (GSR) measures how many ounces of silver it takes to buy one ounce of gold. It’s one of the oldest indicators in commodity markets, with data going back centuries.
Long-term average: ~65
Extreme high: 105 in 2020 (COVID panic, gold as pure safe-haven while silver crashed)
Current level: ~80
1. Why the Ratio Is So Powerful
When the GSR is high (above 90–100), it means silver is undervalued relative to gold.
When the GSR falls, it signals that silver is outperforming gold – usually during the most explosive parts of precious metals cycles.
In simple terms:
👉 High ratio = silver cheap
👉 Falling ratio = silver catching up/outperforming
2. The Recent Move
At the 105 peak (2020), silver was ignored and gold was everyone’s safe-haven. That extreme stretched the ratio to historic highs.
Since then, the ratio has broken down to ~80. This collapse in the ratio coincided with silver’s recent 48–50% rally since April 2025.
So there’s already a tight correlation between GSR falling and silver surging.
3. Forward Projection
If we assume the ratio continues mean-reverting towards its historical average (~65):
From 80 → 65 = a ~20% decline in the ratio.
Given how silver has tracked ratio moves so far, that could translate to another ~50% upside.
🖊️ That math gives me:
Current silver ~$50 → my target range $70–73
Which also aligns with the inflation-adjusted 2011 top of Quarterly Silver chart
This alignment across technical (Cup & Handle), ratio math, and inflation-adjusted targets strengthens the conviction.
4. Where This Gets Interesting
The GSR chart you provided shows a trendline break risk:
If the ratio decisively breaks down from ~80, it confirms silver is in outperformance mode.
A breakdown projects to ~65 (mean), and potentially overshoot lower if momentum builds.
Historically, when the GSR enters a sustained downtrend, silver rallies parabolically.
🎈 Key Takeaway:
The Gold/Silver ratio is not just a technical indicator here – it’s the bridge linking your macro thesis (ETF demand, industrial pull, Fed distrust) with your chart targets.
The ratio tells us that:
Silver’s catch-up has already started.
There’s room for another 50% upside.
This lands silver in the $70–73 zone – exactly where the inflation-adjusted 2011 high sits.
(XAU/USD) – Gold likely to touch $4,000/oz: Ideal buying levels?1. Market Structure & Trend Outlook
On the H1 chart, gold is sustaining its bullish structure with higher highs and higher lows.
After the BoS (Break of Structure), price retraced near 3,862 Buy Zone and bounced upward.
At present, price trades above EMA34 and EMA89, keeping bullish bias intact.
2. Important Levels
Buy Zone: 3,862 – 3,865. Acts as short-term support. Holding above strengthens the bullish case.
OB1: 3,806 – 3,810. Next support in case Buy Zone breaks.
OB2: 3,763 – 3,770. Deeper support, triggered only if market corrects heavily.
Sell Scalping Zone (Fibo): 3,912. A short-term resistance, profit booking expected.
Sell Zone / ATH: 3,933 – 3,935. Breakout here may lead to fresh record highs.
3. Trade Setups
Bullish Setup: Buy on retest of 3,862 – 3,865.
SL: Below 3,850.
TP1: 3,912.
TP2: 3,933 – 3,935.
Bearish Setup (Defensive): If below 3,860, expect test of 3,806 – 3,810.
If this fails, price may decline towards 3,763 – 3,770.
4. Conclusion
Trend remains positive on H1. Best strategy: Buy on dips near support, manage SLs carefully, and book partial profits near resistances. Sustaining above 3,933 may open doors for new highs.

US Government Shutdown Sends Gold Flying HigherWhat's Happening With Gold?
Gold continues recording new high despite monthly RSI reading of 89-90 signalling extremely overbought conditions and casual pullbacks are attracting buyers on any dip towards value areas resuming higher high and higher low structure which is precisely bullish.
Disappointing ADP numbers keep dollar under pressure and Gold gets substantial support as bond yields remain neutral or dull.
Recent record high of $3895 witnessed a minor pullback to $3852 which was quickly absorbed by buyers retesting $3893 today and prices stand at striking distance of record high.
What's Driving the Bullish Rally?
Fundamental Drivers:
The US government shutdown and fiscal stress has caused global concerns triggering increased bets for risk off sentiments driving investors for higher Gold prices on safe haven buying.
Continued Dollar Weakness below critical resistance 98 is supportive for dollar denominated Gold reducing opportunity cost of holding the non yielding asset.
Sticky Inflation makes Gold a preferred hedge against inflation as store of value.
Geo political concerns across Europe, mid east keep safe haven demand strong and boost Gold prices further.
Robust buying by major Central Banks create further structural demand for Gold as several central banks continue increasing Gold in reserve than dollar and no central bank selling Gold despite record high prices.
Any surprise hawkish message from the Fed members or strong economic data can cause a pullback in Gold prices while any dovish tone by Fed will further boost Gold prices.
Technical Drivers:
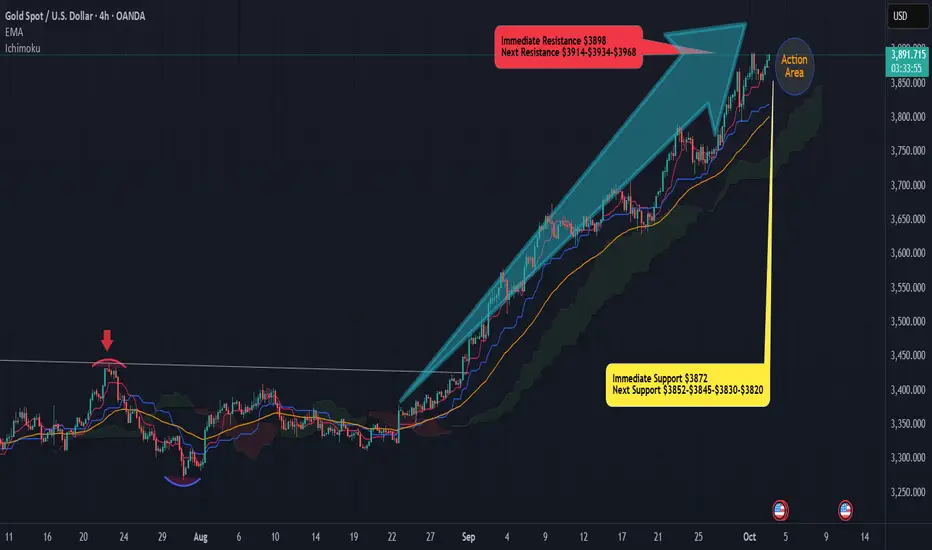
Technical structure is still bullish favouring further continuation supported by price stability above immediate support $3852 and moving within a strong ascending bullish parallel channel as seen on the 4 hourly chart while further bullish extension requires strong break and stability above immediate resistance $3898 which targets next leg higher $3914 followed by $3934
Overbought conditions on Monthly RSI reading 89-90 urges caution on heights as break below crucial support may trigger profit booking pressure, especially if some news about potential agreement on US shutdown strengthens dollar and treasury yields.
If Gold breaks below $3872, expect a retest of $3860-$3858 while break below $3852 will expose $3845 followed by $3830-$3820
Elliott Wave Analysis – XAUUSD 2/10/2025🔎
________________________________________
Momentum
• D1 timeframe: Momentum is preparing to reverse → this signals that the bullish trend is becoming very weak.
• H4 timeframe: Momentum is turning upward → today we may see a recovery move, with price either rising further or moving sideways to push H4 momentum into the overbought zone.
• H1 timeframe: Momentum is about to enter the overbought zone → the recovery continues for now, but once H1 reverses inside the overbought zone, the next downward move may begin.
________________________________________
Wave Structure
• D1 timeframe
o Price reached the second target yesterday.
o Momentum on D1 is showing signs of reversal → if today closes with a bearish candle, it may confirm that the yellow wave 5 top has been completed.
o In that case, a 3-wave correction on D1 will unfold.
o The duration of this correction will likely be longer than the previous yellow wave 2 and wave 4 corrections.
• H4 timeframe
o A downward move has completed, and momentum is turning upward.
o If H4 enters the overbought zone without creating a new high, it provides strong evidence that the purple wave 5 has been completed.
o The current structure shows the confluence of multiple wave 5s, fulfilling the condition of an ending diagonal triangle:
Features: new highs and new lows are created, but they become progressively smaller, forming a rising triangle.
Once completed → a sharp decline is expected.
• H1 timeframe
The structure is noisy, so we consider 2 scenarios:
Scenario 1 – Black wave 5 has already completed
o Price is currently in a corrective structure.
o Combined with H4 momentum reaching the overbought zone and reversing:
If price fails to break above 3897, then:
1. Price drops from the current level 3866 → toward 3830. Then retraces back to 3865 → this offers a very good shorting opportunity.
2. Price rallies to 3885 → but only if H4 momentum is in the overbought zone and starts to weaken → this also provides a great short setup.
Scenario 2 – Price breaks the high
o In this case, we consider the possibility of an ending diagonal triangle, combining channel structure and H4 momentum to find the short entry.
________________________________________
Trading Plan
• Although we already have potential targets, placing limit orders at this stage is not effective.
• The key condition to wait for: H4 momentum must reach the overbought zone and reverse → that will provide a clearer and safer entry.
• I will update the entry point once H4 momentum reaches the overbought zone, to avoid the same situation as yesterday: correct wave direction, but wide volatility caused stop-loss hits.

Gold Record: Shutdown 'Blinds' the Fed Hello, traders!
Gold shows absolutely no sign of slowing down, closing the October 1st session at $3,866.66/oz, while futures contracts hit a record high of $3,897.50/oz. The precious metal has climbed nearly 50% year-to-date and just set its 39th record high this year!
Fundamental Analysis: Shutdown Risk Hits at the Worst Time
While government shutdowns usually have a minor impact, the timing of this one is critical:
Delayed Jobs Data: The crucial jobs report (scheduled for Oct 3rd) will be postponed. This uncertainty will leave the market and the Fed 'blind' regarding the economy's health just weeks before the next policy meeting, triggering strong demand for safe-haven assets (Gold).
Threat of Staff Cuts: President Trump threatened to use the shutdown to cut "a lot of" federal employees, escalating tensions beyond typical closures and increasing political instability.
Technical Analysis & Trading Strategy
Gold accelerated past the $387x region during the US session, confirming the upward momentum is still very strong. However, the market is prone to more "Stop Loss hunting" (liquidity sweeps). Continue to Prioritize Buy, but manage SL carefully due to wider price swings.
Resistance: $3887, $3895, $3904
Support: $3870, $3854, $3843
Suggested Trading Strategy (Absolute Risk Management):
BUY ZONE
Zone: $3870 - $3868 / SL: $3860
TP: $3878 - $3888 - $3898 - $3908
SELL ZONE (High Risk)
Zone: $3903 - $3905 / SL: $3913
TP: $3895 - $3885 - $3875
Gold is running on a foundation of fear. Do you think the $3900 mark will be breached this session? 👇
#Gold #XAUUSD #ATH #Fed #GovernmentShutdown #TradingView #FinancialMarkets #RecordHigh

Buy gold time frame 15Good day everyone. My long position, which I expect to reach yesterday's high, is currently likely to form a bullish cup pattern. With a break of the 3880 level and a pullback to the same level, it could be a re-entry point. Be sure to observe risk management.

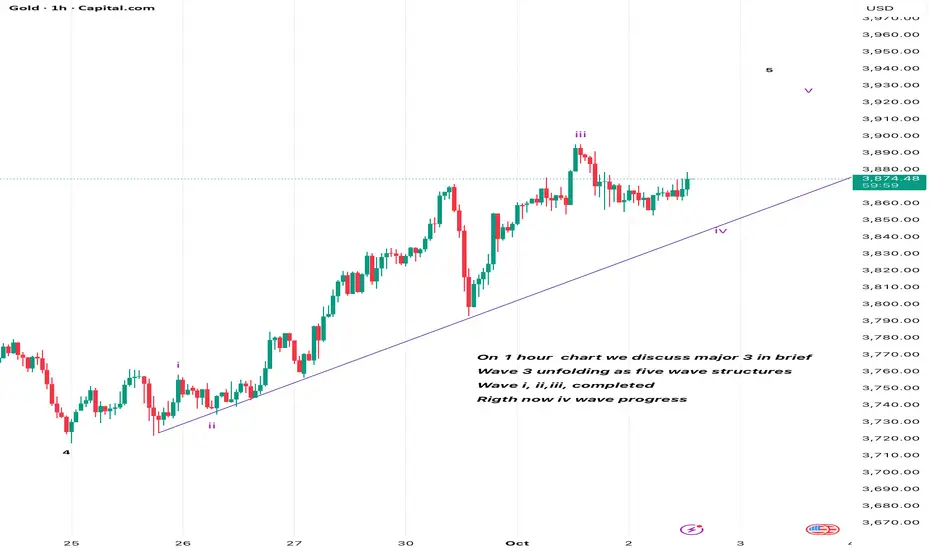
GoldOn 1 hour chart we discuss major 3 in brief
Wave 3 unfolding as five wave structures
Wave i, ii,iii, completed
Rigth now iv wave progress
Disclaimer : do research before before investing / do trade at your own risk
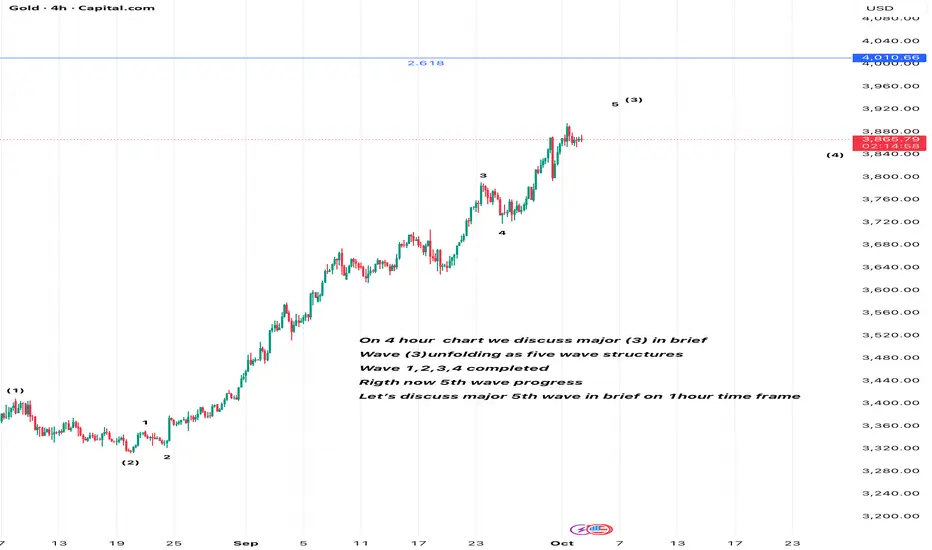
GoldOn 4 hour chart we discuss major (3) in brief
Wave (3)unfolding as five wave structures
Wave 1,2,3,4 completed
Rigth now 5th wave progress
Let’s discuss major 5th wave in brief on 1hour time frame
Disclaimer : do research before investing/ do trade at your own risk
GoldOn Daily chart we discuss major (v) in brief Right
Wave (v) unfolding as five wave structures
Wave (1)and (2)completed
Rigth now (3) wave progress
Let’s discuss major (3) wave in brief on 4 hour time frame
Disclaimer : do research before investing / do trade at your own risk
