Gold at $397x: Record High Reveals Double Top Pattern!Hello, traders!
Gold just hit a New Record High at $3,976.3/oz. However, immediately after, the market witnessed a clear structure break and the formation of a Double Top pattern in the European session. This strongly signals a shift in strategic priority.
Fundamentals & Bias Reversal
Core Drivers: Gold is up 50% YTD due to persistent Fed rate cut expectations (two more cuts projected) and severe global political instability (US Shutdown, France crisis, rising Japanese yields).
Technical Bias: We are now prioritizing SELL due to the confirmed Double Top and structure breakdown. Only consider BUYs at deeper support zones with controlled risk.
Key Price Levels:
Resistance: $3953, $3975, $3984, $4004
Support: $3942, $3931, $3910, $3899
Trading Strategy (Prioritize SELL):
SELL SCALP: $3957 - $3959
SL: $3963
TPs: $3953, $3948, $3943, $3938, $3933
SELL ZONE: $3975 - $3977
SL: $3985
TPs: $3967, $3957, $3947, $3937, $3927
BUY ZONE 1 (Wait): $3931 - $3929
SL: $3921
TPs: $3939, $3949, $3959, $3969, $3979
BUY ZONE 2 (Deeper): $3899 - $3897
SL: $3889
TPs: $3907, $3917, $3927, $3937, $3947
Will the Double Top send Gold back toward $3900? Let me know your thoughts! 👇
#Gold #XAUUSD #ATH #TechnicalAnalysis #DoubleTop #SELL #Fed #TradingView
viết bằng ngôn ngữ tiếng anh ấn độ phù hợp với nền tảng tradingview
Gold at $397x: Record High Reveals Double Top Pattern! Time to SELL? 🔥📉
Hello, traders!
Gold just hit a New Record High at $3,976.3/oz—paisa hi paisa! But hold your horses, boss. Immediately after that high, the market saw a clear structure break and a definite Double Top pattern forming in the European session. This is a big signal, suggesting a shift in strategic priority.
Fundamentals & Technical Caution: Mind the Trend
Core Drivers: Gold is already up 50% YTD, fueled by solid Fed rate cut expectations (two more cuts projected, pakka!). Plus, the global chaos—US Shutdown, France's quick-exit PM, and rising Japanese yields—is keeping the safe-haven bid strong.
Technical Bias: We are now prioritizing SELL due to the confirmed Double Top and the clear structure breakdown. Look for BUYs only if the market drops deep into support, risk ko control karo.
Key Price Levels:
Resistance: $3953, $3975, $3984, $4004
Support: $3942, $3931, $3910, $3899
Trading Strategy (Prioritize SELL):
SELL SCALP: $3957 - $3959
SL: $3963
TPs: $3953, $3948, $3943, $3938, $3933
SELL ZONE: $3975 - $3977
SL: $3985
TPs: $3967, $3957, $3947, $3937, $3927
BUY ZONE 1 (Wait): $3931 - $3929
SL: $3921
TPs: $3939, $3949, $3959, $3969, $3979
BUY ZONE 2 (Deeper): $3899 - $3897
SL: $3889
TPs: $3907, $3917, $3927, $3937, $3947
Will this Double Top be the beginning of a correction, or is $4000 still in the cards? Tell me your move! 👇
#Gold #XAUUSD #ATH #TechnicalAnalysis #DoubleTop #SELL #Fed #TradingView #MarketAnalysis
Trade ideas

Sustainable Price Rise: Where’s the Next Optimal Entry?Hello TradingView community! 🚀
Gold (XAU/USD) is in an extremely sustainable upward structure. Instead of lengthy analysis, let's dive straight into the action plan: What is the optimal entry point and what target is Gold aiming for? Check out the details below.
1. Market Structure Analysis: The Strength of the Bulls 🐂
Looking at the chart, the first thing that catches our eye is a series of "BoS" (Break of Structure).
Every time Gold breaks an old peak, it not only creates a Higher High but also confirms that the upward trend is very strong and sustainable. This indicates that buying power is completely overwhelming and shows no sign of weakening. Smart Money is continuously pushing the price higher, and our job is to ride this "wave."
2. Potential Buying Zones - Where to Catch the Wave? 🧐
To optimize profits and minimize risks, finding a beautiful entry point after a price correction is extremely important. Based on the chart, we have 2 noteworthy potential buying zones:
Buying Zone 1 - Fibonacci Confluence ($3885): This is an extremely ideal "Buy Zone," coinciding with the golden Fibonacci ratio of 0.618. In technical analysis, this is a very strong support level, where prices often tend to reverse and continue the main trend. Professional traders always hunt for pullbacks to this zone.
Buying Zone 2 - Exploiting FVG ($3914 - $3933): Slightly higher, we have the FVG (Fair Value Gap) area at $3914 and the "Buy Scalping" zone at $3933. These are "price gaps" created by supply-demand imbalances when prices rise too quickly. The market tends to return to fill these gaps before continuing its journey. This could be an opportunity for those wanting to catch an earlier wave.
3. Target Conquest - What’s Gold’s Next Destination? 🎯
Once we have a buying position, where will our target be?
Short-term target: The "Sell Scalping FVG" zone around $3969 could be a minor resistance point where some traders will take profits.
Main target: The ultimate destination this structure is aiming for is the "Sell Gold Liquidity" zone at $3998. This is an important "liquidity" area, concentrating many stop-loss orders of the Sellers. Prices are often attracted to these zones like a "magnet" to sweep liquidity before making further moves.
Summary & Advice
Main trend: UP.
Primary strategy: Buy on dip when prices correct to important support zones.
Potential buying zones: $3885 (Fibonacci) and $3914 - $3933 (FVG).
Price targets: $3969 (short-term) and $3998 (main target).
Always remember, risk management is the key to surviving in the market. Set reasonable Stop-loss for all your trades.
WHAT DO YOU THINK ABOUT THIS PLAN?
Will Gold retrace to the Fibonacci zone $3885 or react right at the FVG zone $3914? Leave your opinions and perspectives in the comments below. We will discuss together to find the best opportunities!
👇 Don't forget to Like 👍 and Follow my TradingView channel to not miss daily Gold analyses!

Gold 1H – Pullback Expected Before Key CPI Data💎 XAUUSD – Intraday Trading Plan | Ryan_TitanTrader
📈 Market Context
Gold is stabilizing below the $4,000 mark as traders await this week’s U.S. CPI data and fresh remarks from the Federal Reserve. After a strong multi-week rally, the metal is showing early exhaustion near premium liquidity zones, where engineered pullbacks often occur before continuation.
While the mid-term bias remains bullish, several analysts — including those from Citi and UBS — caution that gold could face short-term corrections if the dollar regains strength. The market continues to price in around a 65% probability of a December rate cut, keeping volatility elevated and sentiment uncertain.
🔎 Technical Analysis (H1/H4)
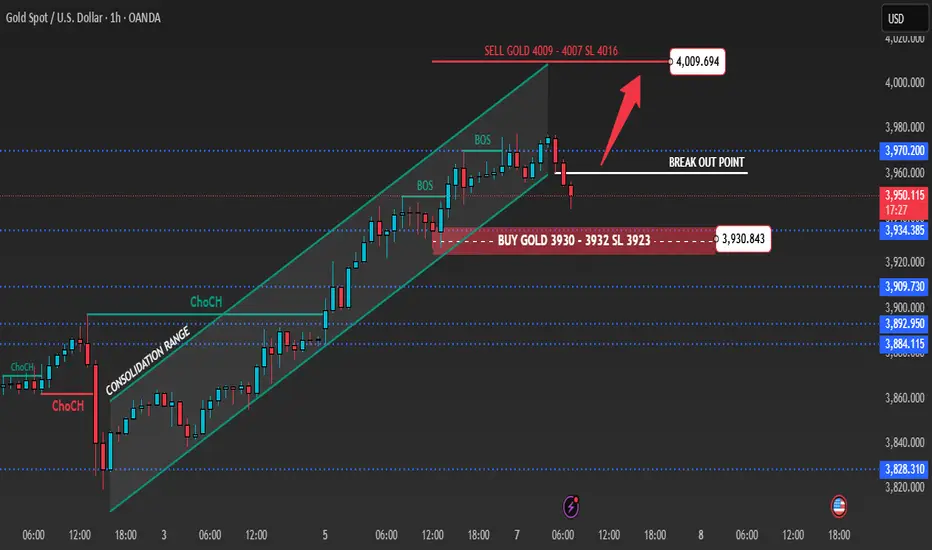
Price has slipped slightly below the ascending channel after consecutive BOS signals, indicating a potential short-term retracement before resuming the uptrend.
🟢 Buy Zone: 3932–3930 (Breakout & FVG zone) – an ideal discount area where buyers may re-enter the market.
🔴 Sell Zone: 4009–4007 (Premium liquidity) – a key region for short setups if price rejects strongly.
🔑 Key Levels
• BUY Zone: 3932–3930 (main support 3923)
• SELL Zone: 4009–4007 (liquidity reaction area)
• Psychological Resistance: 4000
💡 Trading Scenarios & Plan
🟢 BUY ZONE: 3932–3930
SL: 3923
TP: 3945 – 3955 – 3965 – 3975 – 3980+
🔴 SELL ZONE: 4009–4007
SL: 4016
TP: 3995 – 3980 – 3975 – 3965 – 3955
⚠️ Risk Management Notes
The 4000–4010 region acts as a high-liquidity magnet, where false breakouts and engineered sweeps may occur before reversals.
Wait for lower-timeframe confirmation (BOS or rejection candle) before entry.
Avoid overleveraging ahead of CPI — expect volatility spikes and rapid shifts in sentiment.
✅ Summary
Gold remains structurally bullish but vulnerable to intraday retracements near 4009–4007. Ryan_TitanTrader anticipates potential buy reactions from 3932–3930 and short-term rejections near 4009–4007. Holding above 3923 keeps the bullish outlook intact with upside targets toward 3970–3980.
🔔 Follow Ryan_TitanTrader for real-time updates, live setups, and advanced SMC insights as gold reacts to CPI data this week!
XAUUSD SHOWING A GOOD DOWN MOVE WITH 1:10 RISK REWARDXAUUSD SHOWING A GOOD DOWN MOVE WITH 1:10 RISK REWARD DUE TO THESE REASON
A. its following a rectangle pattern that stocked the marketwhich preventing the market to move any one direction now it trying to break the strong resistant lable
B. after the break of this rectangle it will boost the market potential for breakC. also its resisting from a strong neckline the neckline also got weeker ald the price is ready to break in the outer region
all of these reason are indicating the same thing its ready for breakout BREAKOUT trading are follws good risk reward
please dont use more than one percentage of your capitalfollow risk reward and tradeing rules that will help you to to become a bettertrader
thank you

AI Predicts Market Moves1. The Foundation: How AI Understands Market Behavior
AI predicts market movements by analyzing enormous amounts of structured and unstructured data. Unlike traditional models that rely on past prices and fixed formulas, AI adapts dynamically to changing market conditions.
Here’s how the process works:
Data Collection: AI systems gather information from multiple sources — stock prices, volumes, social media sentiment, macroeconomic indicators, corporate filings, and even satellite images.
Feature Engineering: Machine learning algorithms identify key features (price momentum, volatility, correlations) that may impact future movements.
Model Training: AI models, especially deep learning networks, are trained using historical data to learn patterns that precede bullish or bearish trends.
Prediction: The trained model predicts probable outcomes, such as price direction, volatility range, or breakout levels.
Feedback Loop: The system continuously learns from real-time data, refining its accuracy over time.
This self-learning nature makes AI a powerful force in financial prediction, as it becomes more accurate and efficient the longer it operates.
2. Machine Learning Models That Power Market Predictions
Several AI techniques are used to predict market movements. Each serves a unique role depending on the type of market data and the trading objective.
A. Supervised Learning
Supervised models are trained on labeled data (e.g., past price data with known outcomes). Common algorithms include:
Linear and Logistic Regression: Useful for basic price trend forecasts.
Random Forests and Gradient Boosting: Handle complex, nonlinear relationships between variables.
Support Vector Machines (SVM): Ideal for identifying trend reversals.
B. Unsupervised Learning
Unsupervised models detect hidden patterns without pre-labeled outcomes.
Clustering (e.g., K-means): Groups similar stocks or market behaviors.
Principal Component Analysis (PCA): Reduces data complexity to identify dominant market factors.
C. Deep Learning and Neural Networks
These models simulate how the human brain processes information.
Recurrent Neural Networks (RNNs) and LSTM (Long Short-Term Memory): Designed to analyze sequential data like time series, making them perfect for price prediction.
Convolutional Neural Networks (CNNs): Surprisingly effective for pattern recognition in candlestick charts or heatmaps.
Transformers (like those used in ChatGPT): Emerging models that can process multiple forms of data — text, numbers, sentiment — simultaneously for market insight.
D. Reinforcement Learning
In this model, AI acts as an agent that learns by taking actions and receiving feedback (reward or penalty). It’s widely used in algorithmic trading to optimize execution strategies or portfolio balancing.
3. Sentiment Analysis: Reading the Market’s Mood
The market is not purely mathematical — it’s emotional. Investor sentiment can drive markets up or down faster than fundamentals. AI sentiment analysis decodes these emotions from textual and social data sources.
Natural Language Processing (NLP) allows AI to read news articles, analyst reports, earnings calls, and social media posts.
By detecting tone and language, AI gauges whether market sentiment is bullish, bearish, or neutral.
Sentiment data is then quantified and fed into predictive models to anticipate short-term movements.
For example, a sudden surge in positive social media mentions about a stock may indicate upcoming bullish momentum. Conversely, a negative news trend could trigger an early warning for a price drop.
4. Big Data Meets AI: The New Market Edge
Market prediction used to depend primarily on numerical data — prices, volumes, and indicators. Today, AI uses big data to analyze patterns across multiple dimensions simultaneously.
Key data types AI analyzes include:
Price and Volume Data: Traditional market information.
Fundamental Data: Balance sheets, earnings reports, P/E ratios.
Macroeconomic Data: Inflation, interest rates, GDP growth.
Alternative Data: Satellite imagery (e.g., tracking retail traffic), credit card spending, or shipping volumes.
Behavioral Data: Search engine trends, social media posts, and online sentiment.
AI’s ability to merge these data types into a single predictive framework creates a far more holistic understanding of market dynamics — something human analysts can’t achieve manually.
5. High-Frequency Trading (HFT) and Predictive Algorithms
AI plays a crucial role in high-frequency trading, where thousands of trades occur in milliseconds. Here, even a microsecond advantage can yield significant profits.
AI systems in HFT:
Predict short-term price fluctuations based on market microstructures.
Execute trades automatically using reinforcement learning strategies.
Continuously adapt to new data and refine models to maintain a competitive edge.
For instance, if AI detects a sudden imbalance between buy and sell orders, it might predict a short-term breakout and place rapid-fire orders to capitalize on the move — all before human traders can react.
6. Predictive Portfolio Management and Risk Control
AI doesn’t just forecast prices; it predicts risk. Predictive portfolio models use AI to optimize allocations by analyzing correlations, volatility, and macroeconomic scenarios.
Predictive Asset Allocation: AI forecasts which assets are likely to outperform under certain conditions.
Dynamic Hedging: Machine learning models predict downside risk and automatically adjust hedges using derivatives.
Anomaly Detection: AI identifies abnormal price movements that may indicate fraud, manipulation, or systemic instability.
This predictive capability helps fund managers stay one step ahead of uncertainty, minimizing losses and enhancing long-term returns.
7. AI-Powered Tools Used by Traders
The global trading ecosystem now hosts numerous AI-based tools and platforms that help traders predict and react faster.
Examples include:
Bloomberg Terminal AI: Integrates NLP to summarize financial news instantly.
Kavout’s Kai Score: AI-driven stock ranking system.
Upstox and Zerodha (India): Implement algorithmic and data-driven recommendations powered by AI analytics.
AlphaSense: Scans millions of financial documents to detect sentiment and trends.
Even retail traders can now use AI-based trading bots that combine technical indicators, sentiment data, and reinforcement learning to generate predictive insights.
8. Limitations and Risks of AI Predictions
While AI has immense potential, it’s not infallible. Market predictions are inherently uncertain, and several challenges remain:
Black-Box Models: Deep learning models often lack transparency. Traders may not understand why a prediction was made.
Data Bias: If training data is skewed or incomplete, predictions may be inaccurate.
Overfitting: Models may perform well on past data but fail in new, unseen conditions.
Market Manipulation Risks: Predictive AI can be exploited by bad actors who manipulate data sources.
Flash Crashes: Rapid automated trading decisions can trigger sudden market collapses, as seen in past HFT incidents.
Thus, while AI enhances prediction power, it must be used responsibly, with human oversight and ethical guardrails.
9. The Human-AI Partnership in Trading
Despite automation, human intuition still matters. The most successful traders today combine AI-driven insights with human experience.
AI handles the data overload, filtering millions of variables into actionable signals.
Humans interpret context, political events, and macroeconomic nuances that models might miss.
Hybrid Strategies — where AI predicts and humans confirm — are proving to be the most effective approach for modern trading.
This collaboration ensures that traders harness the computational power of AI without losing the strategic foresight that only human judgment provides.
10. The Future of AI Market Predictions: What Lies Ahead
The next generation of AI in trading will go beyond prediction — it will move toward autonomous financial decision-making.
Emerging trends include:
Quantum AI Trading: Combining quantum computing with AI to handle even more complex datasets.
Generative AI Models: Creating simulated market scenarios for predictive testing.
Explainable AI (XAI): Making black-box models transparent so traders understand the “why” behind predictions.
Emotion AI: Measuring real-time trader sentiment through voice and facial analysis for behavioral prediction.
Global Integration: AI systems linking across markets — equities, commodities, forex, and crypto — for unified predictive analysis.
By 2030, it’s expected that over 70% of all trades globally will be AI-assisted or AI-driven, making machine intelligence the core of the financial ecosystem.
Conclusion: The Predictive Revolution in Trading
AI has evolved from being a buzzword to becoming the backbone of market prediction and trading. Its ability to process massive datasets, identify hidden correlations, and forecast potential moves with remarkable accuracy is transforming the very structure of financial markets.
Yet, while AI can predict patterns and probabilities, it cannot guarantee certainty — because markets are influenced by human behavior, policy shifts, and black swan events that defy logic.
The key lies in balance: leveraging AI’s speed, precision, and learning capability while maintaining human control and intuition. As AI continues to mature, those who adapt early — blending technology with insight — will dominate the next generation of global trading.

LiamTrading – Risk of correction before hitting the $4000 mark? LiamTrading – GOLD: Risk of correction before hitting the $4000 mark?
Hello everyone,
Gold is approaching the psychological price zone of $4000/oz, but before reaching this historic milestone, the market may be preparing for a short-term correction.
According to Bank of America's technical strategist – Paul Ciana, gold's upward momentum is “too hot,” and a mid-cycle correction could occur soon.
📉 Technical Analysis (Chart H1 – Wolfe Waves Formation)
Observing the chart, a Wolfe Waves pattern is clearly forming:
The Sell zone 3988–3990 is the convergence point of wave number 5 – a potential short-term reversal zone.
The Buy zone 3963–3965 is the retest point of local support, where sellers often tend to take short-term profits.
The Wolfe trend line indicates the possibility that the price will take liquidity above the peak zone before a corrective decline appears.
If a correction occurs, the 3940–3955 zone will be the first reaction area, where strong buying support is present.
🎯 Trading Scenario
Buy retest:
📍 3963–3965
🛑 SL: 3960
🎯 TP: 3972 – 3985 – 4000
Sell following Wolfe wave:
📍 3988–3990
🛑 SL: 3995
🎯 TP: 3972 – 3955 – 3945
🧭 Medium-term Outlook
Although the upward momentum remains dominant, the momentum is gradually decreasing and the market needs to “cool down” to create a new accumulation rhythm.
Dense liquidity zones around POC 3957–3960 may trigger a short-term pullback, before gold gains momentum to advance to the ATH zone of $4000 in the late-week sessions.
📌 Conclusion
Gold remains in a medium-term uptrend, but a short correction is necessary to maintain a sustainable upward structure.
Traders should prioritize flexible scalping, observing reactions at Fibo zones – Volume Profile – and especially the developing Wolfe Waves pattern.
I will continue to update the latest scenario details for XAUUSD daily.
👉 Follow me to not miss important wave rhythms!

Elliott Wave Analysis – XAUUSD (October 7, 2025)📊
________________________________________
🔹 Momentum
D1 Timeframe:
Yesterday’s D1 candle closed and confirmed that the upward move is still continuing.
However, momentum has started to turn in the overbought zone, indicating that the upside move may not last long — this is a typical overextension signal, often seen at the top of a wave.
H4 Timeframe:
Momentum on H4 is reversing in the overbought zone, meaning the short-term uptrend can still continue today, but traders should be cautious as this is a sensitive area for potential reversals.
H1 Timeframe:
Momentum on H1 is turning upward, suggesting there could be one more short-term bullish push before exhaustion.
➡️ Conclusion:
Over the past few days, price has diverged from momentum across multiple timeframes — a classic sign of a potential top formation.
👉 Be extremely cautious with long-term positions.
________________________________________
📈 COT (Commitment of Traders) Analysis
Commercials:
Currently 18% Long / 82% Short — this means hedgers are heavily shorting to protect against downside risk.
This behavior is typically seen at major tops.
Institutional Traders:
Holding 83% Long / 17% Short, showing extreme bullish sentiment among large funds.
Such sentiment often appears near market peaks.
Retail Traders:
69% Long / 31% Short, indicating that retail traders are FOMO-buying, which reflects a classic crowd behavior at the top.
🧭 Summary:
The current COT data strongly warns of a potential top formation in the market.
Notes:
• Commercials: Hedgers trading against the main trend to reduce business risk.
• Institutionals: Large speculative funds trading with the main trend.
• Retail Traders: Small investors, usually following market emotion.
________________________________________
🌊 Wave Structure
D1 Timeframe:
Price remains within wave 5 (yellow).
Momentum is in the overbought zone, so a correction could occur anytime.
→ For now, use the wave structure and price channel to observe potential topping reactions.
H4 Timeframe:
Wave 5 (purple) is approaching the Fibonacci 0.618 target around 3986.
Combined with D1 momentum still slightly rising within the overbought zone, price may continue higher for 1–2 more days before turning down.
According to additional H1 measurement, the second target lies at 4006.
H1 Timeframe:
The 5-wave (black) structure has been relabeled based on the latest data.
Calculated projection shows Wave 5 = 0.618 of Waves 1–3, targeting 4006.
→ The potential target zone is 3985 – 4006.
Currently, momentum divergence against price is developing — this typically happens in the final wave of a trend.
Combined with COT’s top warning, the market is now slow and choppy, consistent with a distribution and topping phase.
________________________________________
🧭 Trading Plan
• Maintain strict discipline at this stage.
• Reduce position size and avoid holding long-term trades.
• Wait for clear top confirmation before planning the next swing setup.
________________________________________
👉 Summary: Wave 5 is likely completing. Both momentum and COT warn of a potential top — stay patient, observe reactions, and avoid large positions until a confirmed reversal appears.

Gold Neowave UpdateNamaskaram Everyone
Welcome to intelligent investor, we provide market insights by synchronising and combining all the price action waves from different time frames and gives you single trend.
Degree Information
FX:XAUUSD OANDA:XAUUSD FOREXCOM:XAUUSD

Gold Trading Strategy for 07th October 2025💰 GOLD TRADING PLAN – (XAU/USD)
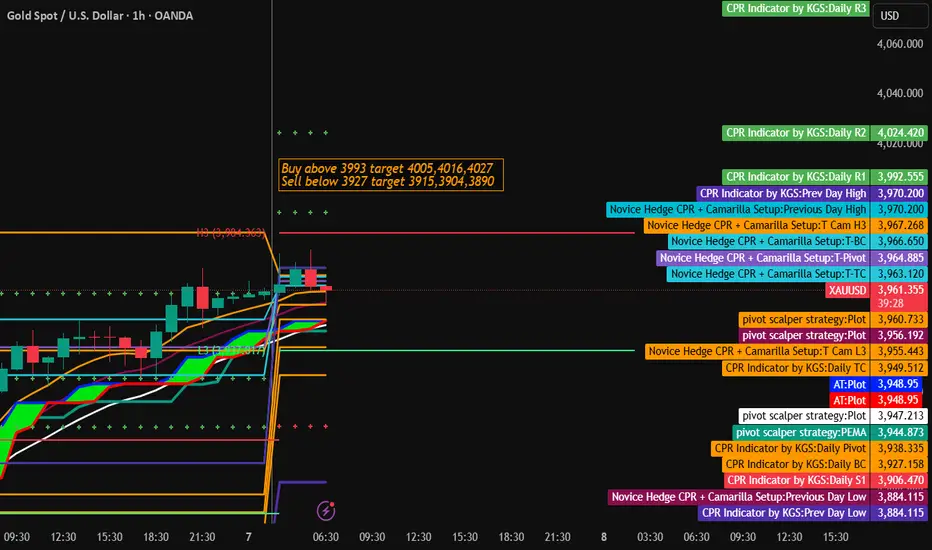
📈 BUY Setup:
🔸 Condition: Buy above the high of the 1-hour candle that closes above $3993
🎯 Targets:
1️⃣ $4005
2️⃣ $4016
3️⃣ $4027
🛑 Stop Loss: Place below the candle low
📉 SELL Setup:
🔸 Condition: Sell below the low of the 1-hour candle that closes below $3927
🎯 Targets:
1️⃣ $3915
2️⃣ $3904
3️⃣ $3890
🛑 Stop Loss: Place above the candle high
⚠️ Disclaimer:
📜 This analysis is for educational and informational purposes only. It does not constitute financial advice or a buy/sell recommendation. Trading in gold and other financial instruments involves substantial risk, and you should trade only with capital you can afford to lose.
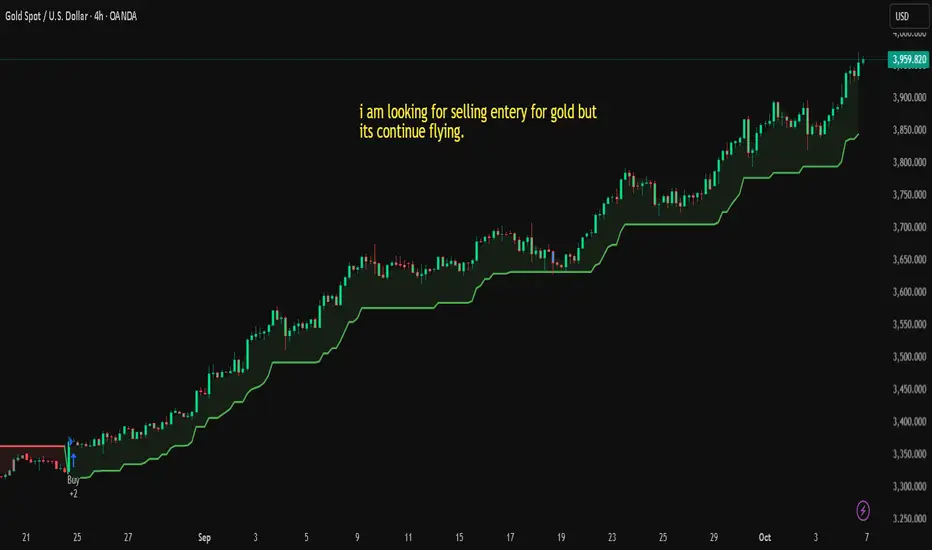
i am looking for gold shorts but here is no confirmation i will update you guys when wars begins i am connected with you here .
GOLD → Structural Rebalance Before Next Bullish LegGOLD → Structural Rebalance Before Next Bullish Leg
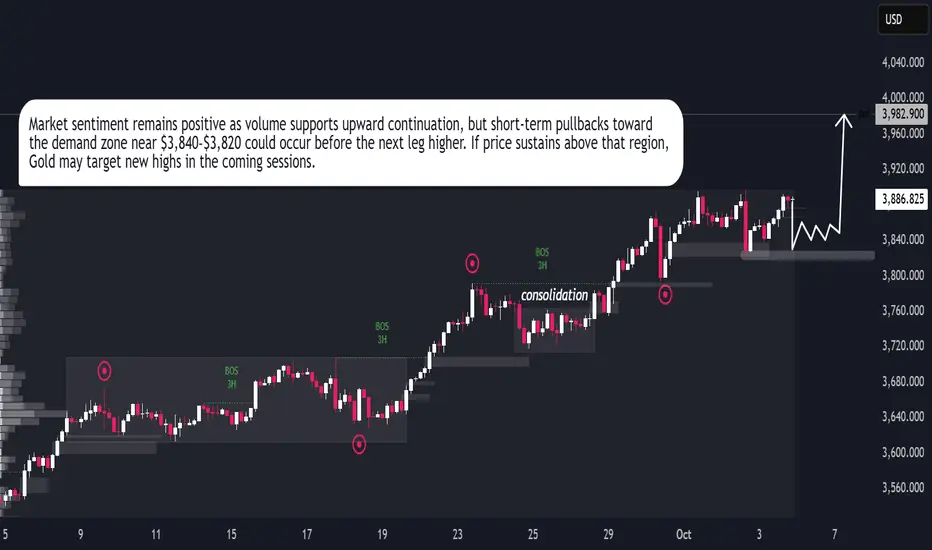
Gold remains in a strong bullish structure, showing consistent higher highs and steady momentum after each correction. The market has been consolidating above the $3,800 zone, where buyers continue to absorb liquidity and prevent deeper declines. This zone acts as a solid base for potential upward expansion. Current market behavior indicates controlled accumulation, suggesting that institutional buyers are maintaining dominance. If gold holds above $3,840–$3,820, the next bullish leg may target the $3,960–$4,000 region. A short-term retracement could occur, but overall momentum favors continuation. The price structure and volume behavior both support further upside, reflecting strong buyer control and stable sentiment in the market.
Gold Ready for Next Leg Up?Gold (XAU/USD) is approaching a key breakout level at 3897.77. I’m watching for a bullish breakout followed by a pullback entry on a retest of that level.
If support holds, I’ll look to go long toward the next resistance/target at 3950.
A clean breakout-retest setup with solid R:R potential.
Entry: After breakout & retest of 3897.77
Target: 3950
Stop Loss: Below retest low / structure
#GOLD
#XAUUSD
#Breakout
#TechnicalAnalysis
#TradingStrategy
#LongSetup
#ChartAnalysis
#PriceAction
#SupportResistance
#Bullish

“Gold Price Action: Bullish Momentum with Key Correction ZonesAnalysis of XAU/USD (Gold Spot)
The chart shows a clear uptrend channel, supported by higher highs and higher lows.
Price recently pulled back after testing the $3,915 zone, which is acting as a short-term resistance.
Multiple support zones are highlighted (around $3,760 and $3,700), which can provide strong buying opportunities on retracement.
The structure suggests impulse–correction–impulse movement, aligning with bullish continuation patterns.
Bullish Scenario
If price holds above the $3,760–$3,780 support, continuation towards $3,915 (previous high) is expected.
A breakout above $3,915–$3,920 will open the door for further upside, targeting $3,960–$3,980.
Bearish Scenario
If price breaks below the trendline support (~$3,760), deeper correction is possible toward $3,680–$3,640 (TP1 zone).
That zone is mentioned on the chart as a strong re-entry point for long positions.
✅ Suitable Target (Bullish):
Immediate Target: $3,915 (previous high)
Extended Target: $3,960 – $3,980
⚠️ Correction Target (Bearish Pullback):
$3,680 – $3,640 (strong buy zone for re-entry)

Gold Breaks $3900: Safe-Haven Demand Soars & Fed Fuels the Rally📊 Market Context
Gold continues to assert its strength by breaking the psychological barrier of $3,900, becoming the central asset amidst financial and political turmoil.
US government shutdown → defensive capital flows strongly into gold.
Fed expected to cut interest rates by another 0.25 points → further strengthens the advantage for the non-yielding precious metal.
Lack of economic data → investors closely follow private reports, adding uncertainty and supporting gold's role as the “number 1 safe haven”.
👉 Market sentiment is perfectly aligned: USD under pressure, capital moving away from risky assets, BUY side FOMO continues to amplify → gold stands before the opportunity to climb and conquer the 3950–3990 range.
🔎 Technical Analysis (H1/H4)
Main trend: Strong uptrend, price holding above the rising trendline.
BUY ZONE 1: 3904–3902 → Volume CP Zone, supports momentum.
BUY ZONE 2: 3885–3883 → Retest old ATH, accumulation zone for the next rally.
SELL Zone: 3949–3950 → Liquidity Zone, prone to liquidity traps.
Extended target: 3994 (Fib 3.618).
🔑 Key Levels
BUY Zones: 3904–3902, 3885–3883
SELL Zone: 3949–3950
Resistance: 3950, 3994
Support: 3900, 3880
📈 Scenario & Trading Plan
✅ BUY ZONE 1: 3904–3902
SL: 3898
TP: 3910 - 3915 - 3925 - 3935 - 3945 - ???
✅ BUY ZONE 2: 3885–3883
SL: 3878
TP: 3895 - 3905 - 3920 - 3935 - 3945 - ???
⚠️ SELL ZONE (scalp/trap): 3949–3950
SL: 3955
TP: 3940 - 3935 - 3925 - ???
⚠️ Risk Management Notes
Liquidity may sweep above 3950 before adjusting → need to wait for price action confirmation.
Avoid FOMO at the peak, prioritize BUY only when price adjusts to support zones.
Order volume should be slightly reduced before unexpected Fed policy announcements.
✅ Summary
Gold is in the “golden phase” of an uptrend: political instability + dovish Fed + safe haven demand = BUY is the main strategy. Plan to accumulate around 3904–3902 and 3885–3883, with an extended target of 3950–3990. SELL is only a short-term strategy at the liquidity zone.
📢 Follow MMFLOW TRADING for real-time updates & BIGWIN setups with the team!

GOLD Marching Toward $4,000 Zone? Gold Holds Firm Above 3,900Gold starts the week with relentless bullish momentum, breaking through 3,900 USD for the first time and eyeing new record highs.
The rally is fueled by safe-haven demand as the US government shutdown drags on and market expectations grow for an upcoming Fed rate cut. Despite a stronger USD and risk appetite in equities, gold buyers remain firmly in control.
🔎 Technical Outlook (H1 – FIBO Matrix)
📍 Reaction Buy Zones
3884 – 3880 (Fibo 0.5 support) → Short-term demand pocket.
386x (Fibo 0.618 H1) → Stronger liquidity-backed support, high-probability rebound zone.
📍 Reaction Sell Zones
393x – 394x (Fibo Extension 1.5 – 1.618) → Intraday resistance, possible rejection.
4,000 (Psychological Round Level) → Key psychological barrier; heavy liquidity likely.
🎯 Trade Plan
1️⃣ BUY Scenario
Entry: 3884 – 3880 / 386x, wait for bullish confirmation.
Targets: 3925 → 3940 → 4000.
Stop Loss: Below 3850.
2️⃣ SELL (Short-term Scalp)
Entry: 393x – 394x or rejection at 4000.
Targets: 3900 → 3884.
Stop Loss: Above 3952.
⚡ Key Insights
Trend bias remains bullish → Prefer long setups from strong Fibo supports.
3925 is the immediate hurdle, 4000 the ultimate psychological wall.
Watch USD volatility and Fed commentary for intraday direction.
💬 What’s your take, India?
Do you expect Gold to hit 4,000 this week, or will sellers defend the zone? Drop your setups 👇

Gold Maintains Bullish Momentum Above Uptrend SupportAnalysis:
The 1-hour chart of XAU/USD shows a strong upward trendline, which has been consistently respected by price action. After a clear bullish momentum breakout around September 25th, gold has continued to post higher lows, confirming buyers’ control of the market.
Currently, gold is trading at $3,878, consolidating just below the $3,924–$3,935 resistance zone. The chart suggests two possible scenarios:
Continuation: If the price respects the upward trendline and breaks above the $3,924–$3,935 resistance, gold could aim for new highs, extending the bullish run.
Short-Term Pullback: A minor correction to retest the trendline is possible, but as long as the trendline holds, the bullish structure remains intact.
Technical Outlook:
Support: $3,855 / $3,785
Resistance: $3,924 – $3,935
Trend: Strongly bullish, supported by ascending trendline
Bias: Buy on dips towards the trendline, targeting a breakout above $3,935

Gold Hits $394x! New ATH: Fed & BoJ Drive the Rally.Hello, traders!
Gold (XAU/USD) has just delivered a massive breakthrough in the Asian session, setting a New ATH around $394x after comfortably breaching that $3900 level. This strength, bhai, is getting serious support from two big monetary policy moves: Fed rate cut expectations and the likelihood of the BoJ (Bank of Japan) delaying rate hikes due to the new PM. Paisa hi paisa!
Fundamentals & Technical Caution: Mind the FOMO
Dual Drivers: Market sentiment is clear—the Fed is expected to cut rates two more times, and the dovish BoJ outlook only adds more fuel, creating a rock-solid foundation for Gold.
Safe-Haven: The continuous US Shutdown drama and geopolitical tensions are keeping that safe-haven bid strong.
FOMO Warning: The momentum is fierce, but you must avoid buying the high. Prioritize Buying on pullbacks to FVG (Fair Value Gaps) to secure a safer entry point. Discipline is key, boss.
Key Price Levels:
Resistance: $3954, $3963
Support: $3910, $3895, $3883, $3870
Trading Strategy (Absolute Risk Management):
BUY SCALP: $3910 - $3908
SL: $3904
TPs: $3918, $3928, $3938, $3948, $3958
BUY ZONE (FVG): $3895 - $3893
SL: $3885
TPs: $3903, $3913, $3923, $3933, $3943
SELL ZONE (High Risk): $3964 - $3966
SL: $3974
TPs: $3956, $3946, $3936, $3926, $3916
Are you placing your bets on a $4000 target this week? Let me know your plan! 👇
#Gold #XAUUSD #ATH #Fed #BoJ #Shutdown #TradingView #MarketAnalysis #GoldFever

LiamTrading – GOLD approaches the $4000 mark LiamTrading – GOLD approaches the $4000 mark: The upward wave continues
Hello everyone,
Gold continues to maintain its impressive upward momentum as the DXY only slightly increases by 0.50% and is currently at 98.21 – a signal indicating that safe-haven flows still prioritise precious metals.
Currently, the technical structure on H1 shows gold is in a clear upward channel, with price reaction zones accurately identified through Fibonacci and trendline, aiming for the next major target of $4000/oz.
📊 Technical Analysis (H1)
Main Trend: Strong upward, Higher High – Higher Low structure remains intact
Main Support Zone: around 3890 – 3900, coinciding with Fibo 1.0 confluence + upward trendline
Psychological Resistance Zone: 3955 – 3999, corresponding to Fibo extension 2.0 – 3.6
RSI is moving into the 70+ zone, reflecting strong buying force but short-term correction signs need to be observed.
🎯 Today's Trading Scenarios
Buy scalping
📍 3909 – 3911
🛑 SL: 3904
🎯 TP: 3940 – 3955 – 3970 – 3990
Buy swing
📍 3888 – 3890
🛑 SL: 3882
🎯 TP: 3910 – 3925 – 3950 – 3975 – 3990
Sell scalping
📍 3956 – 3958
🛑 SL: 3964
🎯 TP: 3935 – 3910 – 3890
Sell swing
📍 3997 – 3999
🛑 SL: 4010
🎯 TP: 3975 – 3950 – 3925
🧭 Trend Analysis
With the current upward force and stable technical structure, the $4000 target is entirely feasible in the short term.
The preferred strategy is to BUY with the trend, watch for pullbacks to optimise entry, and avoid FOMO at the peak.
Adjustments to the support zone 3890–3900 will be a beautiful opportunity to open buy positions.
💡 I will continue to update detailed reaction zones & new plans in each session.
Follow me for the earliest updates on daily gold scenarios!

Gold Soars on FOMO – 1000-Pip Opportunity Ahead!GOLD PLAN FOR 06.10 | Captain Vincent
✳️ Hello to all traders,
Today, we are not only analysing Gold (XAU/USD) from a purely technical perspective ⚙️, but also witnessing the perfect confluence between technicals and fundamental news. A bullish storm is forming, promising attractive trading opportunities.
📊 1. Technical Analysis: Sustainable Bullish Structure
From a technical standpoint, the uptrend of Gold on the H1 chart is undeniable.
🔹 Break of Structure (BoS):
Gold continuously breaks previous highs, indicating that buying pressure is completely dominant.
Each BoS point is a clear affirmation of the strength of the uptrend.
🔹 Potential Demand Zone:
After each rally, the price often takes a “pause” to accumulate.
Currently, the price may adjust to the $3,883,020 - $3,911,169 zone, where the confluence between Fair Value Gap (FVG) and Bullish Order Block (Bullish OB) – creates an ideal launchpad for the next rally.
🏦 2. Fundamental Analysis: The Fire Has Been Lit
If technicals show the way, then fundamental news is the fuel driving the uptrend.
🔸 US Government Shutdown:
This event creates political and economic instability, causing capital to flee from risky assets.
Gold – the number one safe haven – is directly benefiting as investors seek to preserve their assets.
🔸 Fed Ready to Cut Interest Rates:
The market is almost certain that the Fed will cut interest rates by 0.25%.
This reduces the appeal of the USD, further strengthening Gold's advantage, which is a non-yielding asset.
🔸 “Thirst” for Economic Data:
The government shutdown also disrupts the release of important economic data, leaving the market lacking information and increasing uncertainty.
In this environment, Gold continues to hold its safe haven role.
🎯 3. Comprehensive Trading Plan
When technicals and fundamentals align, the reliability of the trading strategy is significantly enhanced.
Strategy:
Wait to buy (Long) when the price adjusts to the demand zone $3,883,020 - $3,905,169.
Entry signals:
Observe confirmation of a bullish reversal in this zone such as:
Pin bar candles, engulfing
Or BoS on the M15 chart
Targets:
Short-term: $3950 – $3990
Long-term: Target “+1000 pips”
Risk management:
Place Stop Loss below the Bullish OB to protect the account.
🧭 Conclusion
The current market sentiment is very favourable for the Buyers:
USD is under downward pressure
Defensive capital flows are strongly moving into Gold
The FOMO effect can stimulate an extended rally
The combination of a solid technical structure and strong fundamental support is creating an almost perfect bullish picture.
👉 Be patient, stick to the plan, and await this golden opportunity.
💼 Wishing everyone an effective and victorious trading day!

XAUUSD POSSIBLE MOVEMENT Hello traders here is my first idea about gold kindly share your opinion on this idea in comment section thank you
Key Points
Current price 3925
Target area 3990/4000
Support area 3910/3890
for more updates on gold stay with us and dont forget to follow us and share our idea with your friends and family who intrested in learning trading
thanks for your support and love

Gold 1H – Liquidity Plays Between 3794 and 3918Gold on the 1H timeframe is fluctuating within a defined range after multiple ChoCH signals, with liquidity concentrated at both premium supply and discount demand. Current price action suggests engineered sweeps remain likely: upside liquidity sits near 3918–3916, while downside support aligns with 3794–3796. This dual structure sets up both tactical sell and buy plays depending on liquidity grabs.
From the macro perspective, gold traders are balancing caution ahead of upcoming U.S. data releases with the backdrop of a resilient dollar and persistent geopolitical risks. These drivers reinforce intraday volatility, where engineered liquidity hunts at extremes provide clearer opportunities.
⸻
📌 Key Structure & Liquidity Zones (1H):
• 🔴 SELL GOLD 3918–3916 (SL 3925): Premium supply sweep zone. Downside targets at 3896 → 3872 → 3853.
• 🟢 BUY GOLD SUPPORT 3794–3796 (SL 3788): Discount demand aligned with structural lows. Upside targets at 3819 → 3853 → 3872+.
⸻
📊 Trading Ideas (Scenario-Based):
🔻 Sell Setup – Liquidity Grab at 3918–3916
• Entry: 3918–3916
• Stop Loss: 3925
• Take Profits:
• TP1: 3896
• TP2: 3872
• TP3: 3853
🔺 Buy Setup – Discount Demand at 3794–3796
• Entry: 3794–3796
• Stop Loss: 3788
• Take Profits:
• TP1: 3819
• TP2: 3853
• TP3: 3872+
⸻
🔑 Strategy Note
Gold remains liquidity-driven and range-bound, with engineered sweeps expected at both premium highs and discount lows. Flexibility is crucial: fade rallies into the 3918 supply zone, while preparing to scale into longs if liquidity clears into the 3794 demand base.

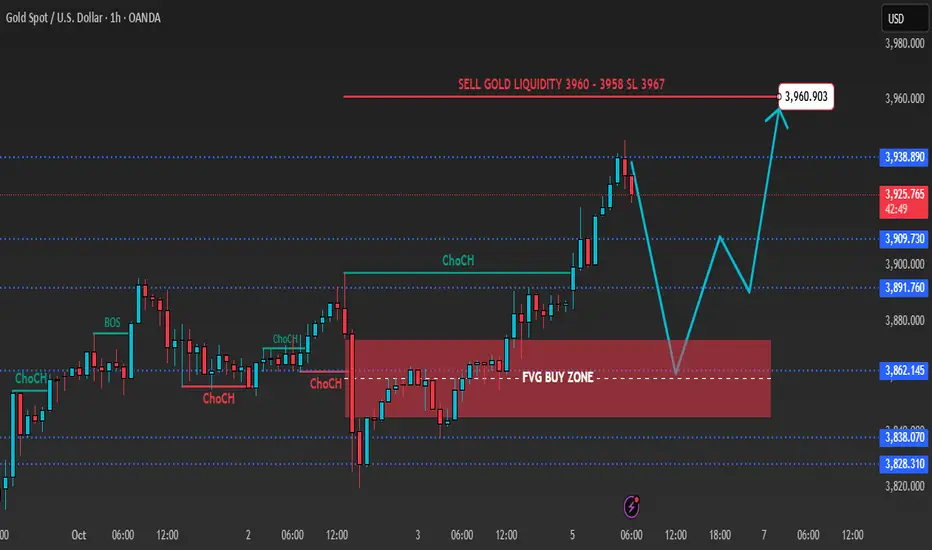
Gold 1H – Will CPI Repricing Push Gold Into FVG Reversal?Gold on the 1H timeframe is reacting near 3,928 after a clean structure break and buildup toward the premium zone 3960–3958, where liquidity remains above recent highs. Market structure shows a bullish impulse leg forming, but engineered sweeps at premium supply are likely before continuation. The defined FVG buy zone around 3840–3842 marks discount territory for potential re-entry if price retraces deeper.
From the macro side, gold is consolidating as traders brace for this week’s U.S. CPI data and renewed Treasury yield volatility. The dollar’s firm tone and cautious risk sentiment following stronger U.S. job figures are keeping gold capped near short-term supply. Still, geopolitical tensions and central-bank demand continue to provide underlying support, reinforcing the buy-on-dip narrative toward year-end.
________________________________________
📌 Key Structure & Liquidity Zones (1H):
• 🔴 SELL GOLD 3960–3958 (SL 3967): Premium liquidity sweep zone targeting retracement toward 3940 → 3900.
• 🟢 BUY ZONE 3840–3842 (SL 3833): Discount demand and FVG mitigation aligned with higher-timeframe support. Upside targets 3860 → 3880 → 3900+.
________________________________________
📊 Trading Ideas (Scenario-Based):
🔻 Sell Setup – Liquidity Sweep at 3960–3958
• Entry: 3960–3958
• Stop Loss: 3967
• Take Profits:
• TP1: 3940
• TP2: 3920
• TP3: 3900
🔺 Buy Setup – FVG Mitigation at 3840–3842
• Entry: 3840–3842
• Stop Loss: 3833
• Take Profits:
• TP1: 3860
• TP2: 3880
• TP3: 3900+
________________________________________
🔑 Strategy Note
Gold remains liquidity-driven within a mid-range structure. Expect engineered sweeps into 3960–3958 before deeper pullbacks into discount demand near 3840–3842. Tactical bias favors fading rallies at premium while preparing to join the continuation move from discount FVG support if CPI-related volatility clears the liquidity pools.
Gold Price Analysis — XAU/USD (Daily)Overview:
Gold has staged an impressive rally, climbing from the 3,200–3,300 area to the 3,870 region within a strong bullish structure. Price action shows higher highs and higher lows, signaling continued demand from buyers. 🚀
Technical Outlook:
• Trend: Both the medium- and long-term trends remain bullish, with price above the 50-day and 200-day moving averages.
• Momentum: Strong upward momentum confirmed by MACD histogram expansion and RSI hovering near overbought territory (~70).
• Key Levels:
⚠️ Resistance: ~3,900 (psychological & structural level).
✅ Support: 3,400–3,600 zone.
Trading Scenarios:
1️⃣ Bullish Continuation:
• Enter on pullbacks to support (3,600–3,700).
• Targets: 3,950–4,000.
• Use trailing stop to secure profits.
2️⃣ Rejection at Resistance (~3,900):
• Look for bearish candlestick patterns (pin bar, engulfing).
• Short-term correction toward 3,400–3,200.
• Stop-loss above 3,920 to manage risk.
3️⃣ Breakout Play:
• If price closes above 3,900 decisively with volume, expect continuation toward 4,100+.
• Ideal for breakout traders with risk managed via tight SL below breakout candle.
Risk Management:
⚠️ Do not risk more than 1–2% per trade.
✅ Use trailing stops to lock in gains.
💡 Accept losing trades early; capital preservation is priority.
Conclusion:
🎯 Bias remains bullish while above 3,600. Traders should monitor the 3,900 level closely — a breakout could extend the rally, while rejection could trigger a corrective pullback.
