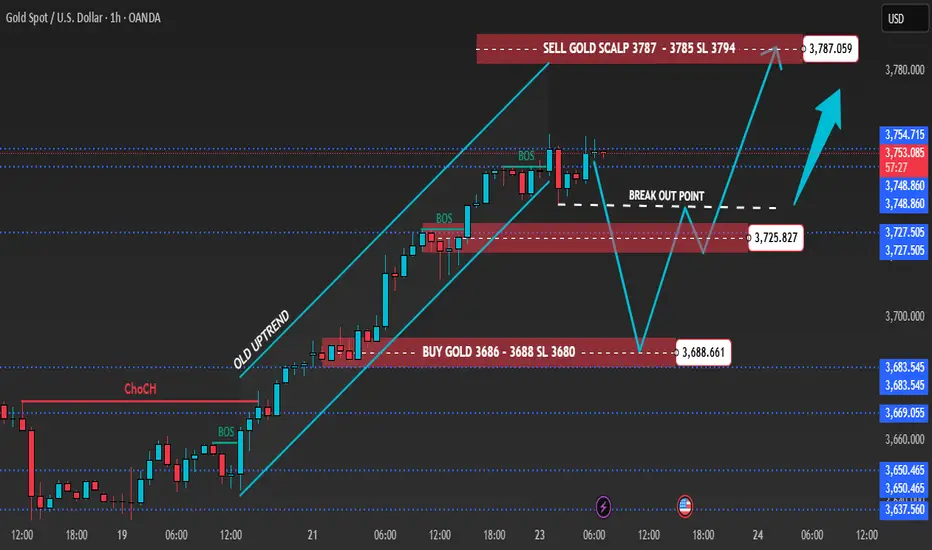
Gold 1H – Inflation Worries & Risk Sentiment Guide MovesGold on the 1H chart is hovering near 3,753 after multiple BOS confirmations, holding a firm bullish bias yet approaching premium resistance. Liquidity sits above 3,787–3,785, while fresh demand zones are placed at 3,725–3,723 and deeper at 3,688–3,686.
Today’s narrative around sticky U.S. inflation expectations and renewed geopolitical tensions in Eastern Europe is boosting safe-haven appetite. Still, intraday price action suggests possible liquidity sweeps into resistance before price retraces back towards demand zones.
________________________________________
📌 Key Structure & Liquidity Zones (1H):
• 🔴 SELL SCALP 3,787–3,785 (SL 3,794): Premium resistance where liquidity runs may spark short-term selling towards 3,780 → 3,775 → 3,770.
• 🟢 BUY ZONE 3,725–3,723 (SL 3,718): Pullback demand aligned with structure, favouring longs towards 3,740 → 3,755 → 3,770+.
• 🟢 BUY ZONE 3,688–3,686 (SL 3,680): Deeper discount demand area, attractive for positional buys targeting 3,700 → 3,715 → 3,730+.
________________________________________
📊 Trading Ideas (Scenario-Based):
🔺 Buy Setup – Pullback Demand (3,725–3,723)
• Entry: 3,725–3,723
• Stop Loss: 3,718
• Targets:
TP1: 3,740
TP2: 3,755
TP3: 3,770+
🔺 Buy Setup – Discount Demand (3,688–3,686)
• Entry: 3,688–3,686
• Stop Loss: 3,680
• Targets:
TP1: 3,700
TP2: 3,715
TP3: 3,730+
🔻 Sell Setup – Liquidity Sweep (3,787–3,785)
• Entry: 3,787–3,785
• Stop Loss: 3,794
• Targets:
TP1: 3,780
TP2: 3,775
TP3: 3,770
________________________________________
🔑 Strategy Note
Rising inflation concerns and safe-haven flows from geopolitical risks are keeping gold buyers in play. However, smart money could drive engineered stop-hunts near premium resistance before retracements set in. The bias remains buy-on-dips around key supports, while short-term scalps against liquidity sweeps near 3,787–3,785 should be approached with caution. Volatility is expected as markets digest U.S. inflation updates and risk headlines.
GOLD trade ideas
LiamTrading – XAUUSD H1LiamTrading – XAUUSD H1: Adjustment structure formed, awaiting confirmation below 3685
After the surge to 375x, gold is entering a correction phase in line with the structural pattern. On H1, the price clings to the upper edge of the rising wedge, with RSI cooling off from overbought levels, indicating that supply pressure is starting to dominate. Today's plan focuses on the adjustment structure, prioritising selling upon confirmation signals.
Key price zones (as per the attached chart)
Sell strong resistance 3775–3785: confluence of channel top + 2.618 extension. Look for weakening reactions to initiate short/medium-term sell orders.
Buy zone volume 3726–3720: a thin support area providing momentum for a rebound. Holding this zone could push the price to retest 3750–3775; conversely, losing 3720 may lead to a deeper decline.
Resistance + FVG 3715–3698: as the price drops, this area turns into supply; a failed retest here is an early signal for further decline.
Confirm sell 3688–3685: closing H1 below this zone confirms a short-term downtrend, targeting a lower buy zone.
BuyZone 3652–3646: confluence of channel bottom + old liquidity, expecting a strong bullish reaction if revisited.
Reference trading scenarios (adhering to risk management)
Sell reaction at peak: 3778–3783, SL 3792, TP 3755 → 3738 → 3722.
Sell on confirmation: wait for H1 to close below 3685, enter sell 3684–3682, SL 3696, TP 3673 → 3656 → 3648.
Buy scalp by volume: 3726–3720, SL 3715, TP 3738 → 3750 (only short-term if the larger structure remains corrective).
Buy swing at strong zone: 3652–3646, SL 3639, TP 3673 → 3698 → 3712 → 3740.
Operational notes
Prioritise waiting for rejection/closing signals at the mentioned zones; avoid chasing orders in between.
Order volume should be allocated according to confirmation levels (confirmation zone < breakdown < failed retest).
Avoid excessive leverage; adjust SL according to structure when in profit.
This is a personal perspective, not an investment recommendation. If you want the quickest updates on the next XAUUSD scenarios, follow me and join my community for discussions.

XAUUSD 09/24 – Scenario after the Fed's Key SpeechHello everyone,
Gold continues its upward momentum in recent sessions. Yesterday, the price touched the 1.618 Fibonacci level on the H4 chart and then declined, indicating a slight rejection right after the PMI news.
Technical Perspective
The Wolfe Waves structure remains intact, not yet broken.
If the price returns inside the trendline, the signal confirming the Wolfe pattern will become clearer.
Current key resistance area: 3790 – 3825, coinciding with Fibonacci 361.8.
Noteworthy short-term support area: 3650 – 3647.
Fundamental Perspective
In yesterday's speech, Chairman Powell emphasised: “If monetary policy is eased too quickly, efforts to curb inflation will fail.”
This indicates that the Fed continues to prioritise price stability over the market's expectations for rate cuts. This is a factor to consider when trading gold in the current phase.
Today's Trading Scenario
Sell Setup
Entry: 3825 – 3827
SL: 3833
TP: 3810 – 3790 – 3768 – 3755
Buy Setup
Entry: 3650 – 3647
SL: 3642
TP: 3672 – 3688 – 3695 – 3710 – 3750
Summary
In the short term, gold is in a correction phase after hitting resistance. Prioritise observing signals around 3790 – 3825 to find Sell opportunities, while 3650 is a notable buying point for a recovery scenario.
This is today's XAUUSD trading scenario according to the Wolfe Waves model. You can refer to and adjust according to your personal strategy.
Follow me for the latest analyses as the market changes.
Wishing you successful trading!

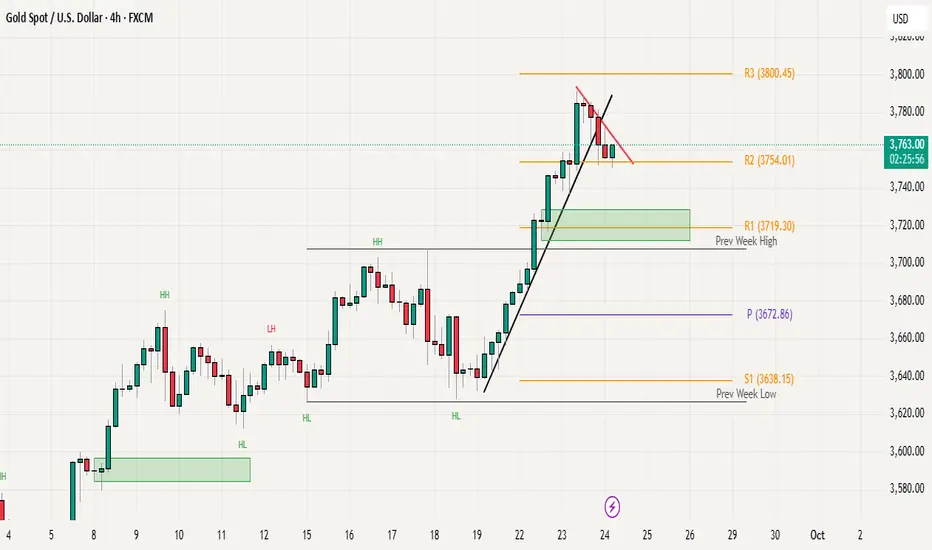
Gold Price Action: Trendline Break but Bulls Still in ControlGold posted a fresh all-time high yesterday near 3790 before entering a healthy pullback phase after an extended intraday rally. The higher-timeframe structure remains constructive, with the market still maintaining its higher-highs and higher-lows sequence. However, price action has broken below the rising trendline support we discussed in yesterday’s update, signaling a short-term pause in momentum.
At the moment, gold is consolidating just above R2 (3754), which continues to act as an important intraday support. For bulls to regain momentum and extend the rally, price needs to break above the declining red resistance trendline and sustain above the 3790–3800 zone. A breakout here could open the door for further upside continuation.
On the other hand, a confirmed H4 close below 3750 could invite deeper profit-taking, with the 3700–3710 area (previous week’s high) remaining the key demand zone and primary downside support.
Overall, the broader trend remains bullish, but price action is currently in a consolidation phase. Watching for either a breakout above resistance or a close below 3750 will provide clarity on the next directional move.
Gold Neowave Forecast
Update Type- Intraday
Yesterday wave-((iii)) Completed at the top, currently we are in wave ((iv))
after blue (a)(b)(c), market will continue the previous buy cycle for wave-((v))..
we will see after the structure we should buy or not
Learn More about trend here

Part 1 Support and Resistance1. Introduction: What Are Options?
In financial markets, traders and investors use different instruments to make profits or manage risks. Among these, options are one of the most powerful yet misunderstood tools. Unlike stocks, where you directly own a share in a company, or bonds, where you lend money, options are derivative contracts — meaning their value comes from an underlying asset (like a stock, index, commodity, or currency).
An option gives its buyer a right, but not an obligation, to buy or sell the underlying asset at a fixed price within a certain period. This ability to choose, without being forced, is why it’s called an option.
Options are widely used for three reasons:
Speculation – Traders use them to bet on price movements.
Hedging – Investors use them to protect against losses in their portfolios.
Income Generation – Some traders sell options to collect premium income.
Now, let’s break it down step by step.
2. Key Terms in Option Trading
Before going deeper, you need to know the language of options:
Call Option: A contract that gives the buyer the right to buy an asset at a set price within a specific time.
Put Option: A contract that gives the buyer the right to sell an asset at a set price within a specific time.
Strike Price (Exercise Price): The price at which the option buyer can buy (call) or sell (put) the underlying.
Premium: The price you pay to buy an option. This is like a ticket fee for getting the right.
Expiration Date: The date when the option expires. After this, the contract becomes worthless if not exercised.
In the Money (ITM): An option that already has value if exercised.
Out of the Money (OTM): An option that would not make money if exercised now.
At the Money (ATM): When the stock price and strike price are nearly equal.
Example: Suppose Infosys is trading at ₹1,500.
A Call option with a strike of ₹1,450 is ITM because you can buy lower than market.
A Put option with a strike of ₹1,550 is ITM because you can sell higher than market.
3. How Options Work
Think of options like an insurance policy.
When you buy a call option, it’s like booking a movie ticket in advance. You pay a small fee (premium) to reserve the seat (stock at a certain price). If the stock rises, you use your ticket. If not, you just lose the fee, not more.
When you buy a put option, it’s like buying insurance for your car. If something bad happens (stock falls), you can still sell at a higher strike price. If nothing happens, your premium is the cost of insurance.
This is the beauty of options: limited risk (only the premium), but potentially unlimited reward (especially for calls).

XAUUSD/GOLD 30 MIN BUY PROJECTION 23.09.25XAUUSD/Gold 30-min buy projection chart you shared for 23.09.25. Here’s the breakdown of what the chart indicates:
🔎 Chart Analysis
Trend: Price is moving within a bullish (upward) channel, shown by the blue trend lines.
Entry Zone: Around 3749.687 (marked as ENTRY, just above Support 1).
Stop Loss (SL): Around 3743.131, below the 30-min FVG (Fair Value Gap).
Supports:
Support 1: ~3749 zone
Support 2: ~3755–3757 zone
Take Profits:
TP1: Around 3765–3767 level (mid-channel target).
TP2 (ATH – All-Time High for this projection): Around 3783–3785.
Projection Path:
Price expected to bounce near entry zone → rise towards TP1 → possible pullback → continue bullish momentum towards TP2 ATH following the 30-min uptrend line.
⚡ Trading Idea (based on chart)
Buy Entry: ~3749
Stoploss: ~3743
TP1: ~3765
TP2: ~3783
This setup offers a risk-reward ratio > 1:3, which is strong for an intraday buy trade.
👉 Do you want me to calculate the exact risk-to-reward ratio (RRR) for this setup so you can evaluate position sizing?

Gold Trading Strategy for 23rd Sember 2025GOLD TRADING STRATEGY
🟢 Buy — Enter only when a 15-minute candle closes above 3765; buy a tick/point above that candle’s high. Targets: 3775, 3785, 3800.
🔴 Sell — Enter only when a 1-hour candle closes below 3728; sell a tick/point below that candle’s low. Targets: 3715, 3703, 3685.
BUY SETUP — 15-minute candle (very detailed)
🔎 Condition to enter
Wait for a 15-minute candle to close above 3765.
Only after the candle closes above 3765 do you prepare to buy.
🧭 Entry execution
Identify the high of that confirmed 15-min candle (call it C_high).
Place a Buy-Stop order a small tick above the candle high (e.g., Entry = C_high + 1 tick), so your order triggers only if price continues up.
🛡 Stop-loss (SL)
Place SL just below the low of the same candle (call it C_low - 1 tick).
This is a clean, candle-based SL — simple for beginners to manage.
🎯 Targets
Target 1: 3775
Target 2: 3785
Target 3: 3800
SELL SETUP — 1-hour candle (very detailed)
🔎 Condition to enter
Wait for a 1-hour candle to close below 3728.
Only after the hourly candle closes below 3728 do you prepare to sell.
🧭 Entry execution
Identify the low of that confirmed 1-hour candle (H_low).
Place a Sell-Stop order a small tick below H_low (e.g., Entry = H_low − 1 tick).
🛡 Stop-loss (SL)
Place SL just above the high of the same 1-hour candle (H_high + 1 tick).
🎯 Targets
Target 1: 3715
Target 2: 3703
Target 3: 3685
⚠️ Disclaimer (READ CAREFULLY)
📢 This content is for educational purposes only and is not financial advice. Trading gold or any financial instrument involves substantial risk — you can lose more than your initial capital. Use proper risk management (e.g., limit risk per trade to 1–2% of your account). Always verify instrument point/contract value with your broker and consider consulting a licensed financial advisor before trading. Past results do not guarantee future performance.

XAUUSD – Strategic Selling Zone and Detailed Trading ScenarioTechnical Analysis
Gold (XAUUSD) is experiencing a strong upward trend and has now reached the Fibonacci extension zone of 1.618 – 2.618, a region often associated with profit-taking and short-term distribution.
Sell Zone Fibo 2.618 (3,730–3,735): The first potential supply area, if a bearish confirmation candle appears on H1/H4, a corrective phase is likely to commence.
Sell Zone Swing (3,745–3,750): A strong supply zone confluencing with multiple Fibonacci extensions, posing a higher reversal risk.
Short-term Buy Zone (3,690–3,700): An intermediate support area after breaking the previous peak, suitable for short-term buy orders if the price retests and confirms.
Buy Swing (3,645–3,650): The main support zone, confluencing with EMA200 H1 and an old trendline, considered a 'safe buying point' if a deep correction occurs.
The RSI (14) is currently at 77, indicating that the price has entered the overbought territory. Historically, whenever the RSI exceeds 75, a significant correction follows. This serves as a warning signal for traders to consider gradually taking profits on short-term Buy positions and preparing for Sell or Buy scenarios at lower price levels.
Trading Scenario
Scenario 1 – Sell at Supply Zone:
Entry: 3,732–3,735 (Fibo 2.618) or extend to 3,745–3,750 (Sell Zone Swing)
SL: above 3,740
TP1: 3,707
TP2: 3,690–3,700 (Buy Zone)
TP3: 3,661
TP4: 3,645
Scenario 2 – Short-term Buy (regression scalping):
Entry: 3,670–3,700 (after H1 confirmation candle)
SL: below 3,690
TP1: 3,718
TP2: 3,730
Scenario 3 – Long-term Buy Swing:
Entry: 3,645–3,648 (EMA200 + main support zone)
SL: below 3,640
TP1: 3,690
TP2: 3,707
TP3: 3,730
Price Levels to Watch
3,730–3,750: The strongest current supply zone, suitable for a Sell scenario based on Fibonacci extensions.
3,690–3,700: Short-term Buy Zone, a crucial retest area to confirm the trend.
3,661: An intermediate level, if breached, could lead to a decline towards EMA200.
3,645: Potential Buy Swing, the main support of the upward structure.
Overall Assessment
The main trend on H1 remains upward; however, the current price level has entered the overbought zone, indicating a likely correction towards support before continuing the trend.
The most suitable strategy at this time: Monitor for short-term Sell opportunities at the supply zone – take profits at the support zone, then wait for Buy Swing at lower levels to follow the main trend.

Gold Consolidating Near All-Time HighLast week Gold made a new all-time high around the 3707 level, and we have seen minor pullback after this high, leading to a pullback towards the 3620 -30 area. From there, the price bounced back strongly and is now trading close to the 3700 mark again. Currently, the market seems to be consolidating in a range between 3620 and 3700-07. The overall trend still looks bullish, but for the next clear direction, we need a strong higher time frame close either above 3700 for further upside or below 3600 for possible deeper correction.
Immediate resistance 3700-07
Weekly R1 3719
Weekly R2 3754
Pivot 3672 (As immediate support)
Weekly S1 3628

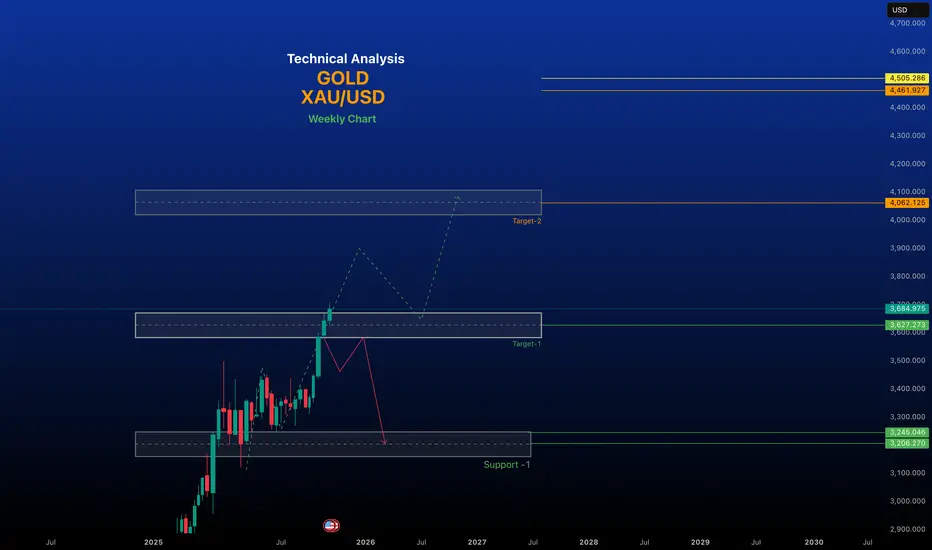
A bullish outlookWaves 1, 2, and 3: The chart shows a completed impulse sequence with a long and strong Wave 3, which followed a Bull Flag continuation pattern.
Wave 4 Correction: Gold is currently believed to be in a corrective Wave 4. This correction is taking the shape of an Ascending Broadening Wedge, a pattern characterized by two upward-slanting, diverging trendlines.
Support: A key support level is marked at approximately $3,324.790, which served as the base for the recent major rally.
Price Target: The red arrow indicates an expected rally towards the region between the 2.414 ($3,818.931) and 3.0 ($3,865.262) Fibonacci levels.
Gold is poised for another significant rally to new highs, potentially reaching the $3,820 - $3,865 price range.

XAU/USD Technical Analysis: Major Levels, Market Structure, and 🔎 Current Snapshot
Price now: ~$3,684.98 per ounce.
Investing.com
Today’s trading range: ~$3,632.28 → $3,686.33.
Investing.com
Technical indicators (on sites like Investing.com) are showing a Strong Buy bias. Many moving averages & oscillators are in bullish territory.
⚙ Updated Key Levels (Support & Resistance)
Here are revised zones to watch, given the current price:
Immediate Resistance - $3700 Psychological round level; has been acting as near-term ceiling.
Immediate Support - $3,650 – $3,670 Zone of recent higher lows; a break below this could see more downside.
Stronger support - $3,600
Major Support Below - $3,500 – $3,550 A deeper correction zone; important in case of more aggressive downward moves.
🔄 Market Structure
Gold is in an uptrend, but there are signs of short-term weakening:
Some indicators are showing overbought conditions.
Price is consolidating just below resistance at ~$3,700 – so momentum is there, but pushing higher might require a catalyst.
On the downside, the structure holds so far — previous swings are supporting, but if support zones (like $3,650) fail, that could shift to a correction mode.
📝 Conclusion
XAU/USD is consolidating within a crucial range, balancing supply and demand forces. The dual-trendline structure signals a potential breakout in the coming sessions. Short-term traders can leverage the 5M CHoCH for early entries, while swing traders should focus on the interplay between the higher timeframe zones and trendlines.
📌 Reminder: Always wait for confirmation before entering trades and manage risk according to your trading plan.
🔔 Follow for updates! Let me know if you have any questions or want to discuss your own analysis. Happy trading! 🚀✨
PCR Trading Strategies1. Strategic Approaches to Options Trading
Options strategies can be simple or complex, depending on the trader’s risk tolerance, market outlook, and capital. These strategies are categorized into basic, intermediate, and advanced levels.
1.1. Basic Strategies
Buying Calls and Puts: Simple directional trades.
Protective Puts: Hedging against portfolio declines.
Covered Calls: Generating income from existing holdings.
1.2. Intermediate Strategies
Spreads: Simultaneous buying and selling of options to limit risk and reward.
Vertical Spread: Buying and selling options of the same type with different strike prices.
Horizontal/Calendar Spread: Exploiting differences in time decay by using options of the same strike but different expiration dates.
Diagonal Spread: Combining vertical and horizontal spreads for strategic positioning.
Collars: Combining protective puts and covered calls to limit both upside and downside.
1.3. Advanced Strategies
Iron Condor: Selling an out-of-the-money call and put while buying further OTM options to limit risk, profiting from low volatility.
Butterfly Spread: Exploiting low volatility by using three strike prices to maximize gains near the middle strike.
Ratio Spreads and Backspreads: Advanced plays to profit from skewed market expectations or strong directional moves.
2. Identifying Option Trading Opportunities
Successful options trading requires analyzing market conditions, volatility, and liquidity. Key factors include:
2.1. Market Direction and Momentum
Use technical indicators (moving averages, RSI, MACD) to gauge trends.
Trade options in alignment with market momentum for directional strategies.
2.2. Volatility Analysis
Historical Volatility (HV): Measures past price fluctuations.
Implied Volatility (IV): Market’s expectation of future volatility.
Opportunities arise when IV is underpriced (buy options) or overpriced (sell options).
2.3. Earnings and Event Plays
Companies’ earnings announcements, product launches, or macroeconomic events create volatility spikes.
Strategies like straddles or strangles are ideal to capitalize on such events.
2.4. Liquidity and Open Interest
Highly liquid options ensure tight spreads and efficient entry/exit.
Monitoring open interest helps identify support/resistance levels and market sentiment.
3. Risk Management in Options Trading
While options offer significant opportunities, risk management is crucial:
Position Sizing: Limit exposure to a small percentage of capital.
Defined-Risk Strategies: Use spreads and collars to control maximum loss.
Stop-Loss Orders: Protect against rapid adverse movements.
Diversification: Trade multiple assets or strategies to reduce concentration risk.
Implied Volatility Awareness: Avoid buying expensive options during volatility spikes unless justified by market events.

Geopolitical Risks and Their Impact on Global MarketsIntroduction
Geopolitical risks encompass a broad spectrum of political, economic, and military events that can disrupt the global economic landscape. These risks, ranging from armed conflicts and trade wars to policy shifts and regime changes, have profound implications for financial markets, investment strategies, and economic stability. Understanding the nature of these risks and their potential impacts is crucial for investors, policymakers, and businesses operating in an increasingly interconnected world.
1. Nature and Sources of Geopolitical Risks
Geopolitical risks arise from various sources, each with unique characteristics and potential consequences:
Armed Conflicts and Wars: Military engagements, such as the ongoing Russia-Ukraine conflict, can lead to significant disruptions in global supply chains, especially in energy and commodities markets. For instance, attacks on critical infrastructure can cause immediate price spikes and long-term supply shortages.
Trade Wars and Sanctions: Economic measures like tariffs, export controls, and sanctions can alter trade flows and affect the profitability of multinational corporations. The U.S.-China trade tensions are a prime example, influencing global supply chains and market sentiments.
Political Instability and Regime Changes: Shifts in political power, especially in key economies, can lead to policy uncertainties that affect investor confidence and market stability. Changes in leadership can result in abrupt policy shifts, impacting sectors such as energy, finance, and technology.
Cybersecurity Threats: Increasing reliance on digital infrastructure makes economies vulnerable to cyberattacks, which can disrupt financial systems, trade, and national security.
Environmental and Resource Conflicts: Competition for scarce resources, exacerbated by climate change, can lead to geopolitical tensions, particularly in regions dependent on natural resources.
2. Mechanisms of Market Impact
Geopolitical events influence markets through several channels:
Market Volatility: Uncertainty surrounding geopolitical events can lead to increased volatility in stock and bond markets. Investors often react swiftly to news, leading to sharp price movements.
Commodity Price Fluctuations: Conflicts in resource-rich regions can disrupt supply chains, leading to price increases in commodities like oil, gas, and metals. For example, tensions in the Middle East often result in spikes in oil prices due to concerns over supply disruptions.
Currency Instability: Geopolitical risks can affect investor confidence in a country's currency, leading to depreciation or volatility. Countries directly involved in conflicts may see their currencies weaken due to capital outflows.
Capital Flows and Investment Patterns: Heightened risks can lead to shifts in investment strategies, with investors seeking safe-haven assets like gold, government bonds, or stable currencies. Emerging markets may experience capital outflows as investors seek safer investments.
Supply Chain Disruptions: Conflicts and trade restrictions can interrupt the flow of goods and services, leading to shortages and increased costs for businesses and consumers.
3. Case Studies of Geopolitical Events and Market Reactions
Russia-Ukraine Conflict: The invasion of Ukraine by Russia in 2022 led to significant disruptions in global energy markets. Sanctions imposed on Russia resulted in soaring oil and gas prices, affecting global inflation rates and energy security.
U.S.-China Trade War: The imposition of tariffs between the U.S. and China in 2018-2019 disrupted global supply chains, affecting industries from electronics to agriculture. Markets experienced heightened volatility as investors adjusted to the changing trade landscape.
Brexit: The United Kingdom's decision to leave the European Union introduced uncertainties regarding trade agreements, regulatory standards, and economic relations, leading to fluctuations in the British pound and stock market volatility.
Middle East Tensions: Periodic conflicts and tensions in the Middle East, particularly involving Iran, have led to spikes in oil prices due to concerns over supply disruptions, impacting global markets.
4. Quantifying Geopolitical Risk
Measuring geopolitical risk is challenging due to its multifaceted nature. However, several indices and models have been developed to assess and quantify these risks:
Geopolitical Risk Index (GPR): Developed by Caldara and Iacoviello (2022), this index quantifies geopolitical tensions based on news coverage and policy uncertainty. It provides a historical perspective on the frequency and intensity of geopolitical events.
BlackRock Geopolitical Risk Indicator (BGRI): This indicator tracks market attention to geopolitical risks by analyzing brokerage reports and financial news stories. It helps investors gauge the level of concern in the market regarding specific geopolitical events.
Market-Driven Scenarios (MDS): Employed by institutions like BlackRock, MDS frameworks estimate the potential impact of geopolitical events on global assets by analyzing historical parallels and expert insights.
5. Investor Strategies in the Face of Geopolitical Risks
Investors can adopt several strategies to mitigate the impact of geopolitical risks:
Diversification: Spreading investments across various asset classes, sectors, and geographies can reduce exposure to specific geopolitical events.
Hedging: Utilizing financial instruments like options, futures, and currency swaps can help protect portfolios from adverse market movements.
Focus on Fundamentals: Investing in companies with strong fundamentals, such as robust balance sheets and resilient business models, can provide stability during turbulent times.
Monitoring Geopolitical Developments: Staying informed about global events and understanding their potential implications can help investors make timely and informed decisions.
Scenario Planning: Developing and regularly updating risk scenarios can prepare investors for potential geopolitical shocks and guide strategic responses.
6. Implications for Policymakers and Businesses
Policymakers and businesses must recognize the significance of geopolitical risks and take proactive measures:
Policy Formulation: Governments should develop policies that enhance economic resilience, promote diversification, and reduce dependence on volatile regions.
Crisis Management Plans: Establishing frameworks to respond to geopolitical crises can help mitigate their impact on national security and economic stability.
Public-Private Collaboration: Cooperation between governments and businesses can lead to more effective risk management strategies and resource allocation during crises.
Investment in Technology and Infrastructure: Strengthening digital infrastructure and cybersecurity can reduce vulnerabilities to cyber threats and enhance economic resilience.
Conclusion
Geopolitical risks are an inherent aspect of the global economic landscape, with the potential to influence markets, investment strategies, and economic policies. While these risks cannot be entirely eliminated, understanding their sources, mechanisms, and potential impacts allows investors, businesses, and policymakers to develop strategies to mitigate their effects. By adopting proactive risk management approaches and staying informed about global developments, stakeholders can navigate the complexities of geopolitical risks and maintain stability in an interconnected world.
XAUUSD – The Decisive Zone and Trading ScenariosTechnical Analysis
Gold prices on the H4 chart are in a recovery phase after retesting the support at 3,661–3,662. The latest candle has rebounded strongly to the 3,684 zone, yet the structure still indicates a clear tug-of-war.
The upward trendline was breached in the previous decline, and currently, the price is retracing to test this area again. This is a crucial point to determine whether the short-term uptrend will continue.
The Fair Value Gap (FVG) formed around the 3,613–3,626 zone, along with the Fibonacci extension, becomes a point of interest for deeper pullbacks.
The Volume Profile indicates the main Point of Control (POC) lies lower, around 3,551, a potential target for gold to revisit if selling pressure increases.
The RSI (14) is at ~59, leaning towards the buyers but hasn't crossed into the overbought territory → the current momentum is more of a recovery rather than a sustainable uptrend.
Trading Scenarios
Scenario 1 – Buy following the short-term trend:
Entry: wait for a retest at 3,673–3,662
SL: below 3,655
TP1: 3,690–3,700
TP2: 3,708–3,715 (2.0–2.618 Fib extension)
Scenario 2 – Short sell after confirmed failure:
If the price fails to hold above 3,661 and there is a reversal signal on H4, consider selling.
Entry: 3,661–3,650 (after confirmation candle)
SL: above 3,673
TP1: 3,626–3,613 (FVG + support)
TP2: 3,579
TP3: 3,551 (POC Volume Profile)
Key Price Levels to Watch
3,708–3,715: extended resistance zone, Fibonacci confluence, important target for buyers.
3,661–3,662: short-term support, the boundary to determine the next trend.
3,613–3,626: FVG + intermediate support, a zone prone to reactions.
3,551: volume POC, a deeper target if the market breaks all support.
I will apply the long-term trading scenario in the new week, give me a follow for motivation to write more!

Gold Market Analysis: September 20, 2025Gold (XAU/USD) continues its remarkable bullish run in 2025, driven by persistent geopolitical tensions, central bank buying, a weakening US dollar, and expectations of further Federal Reserve rate cuts. As of today, the spot price stands at approximately $3,685 per ounce, marking a 1.06% increase from the previous day and a staggering 40.47% year-over-year gain. This follows a 26% rise in the first half of the year and nearly 41% year-to-date, with the metal recently touching an all-time high near $3,707 earlier this month. The market remains in a structural uptrend, though short-term volatility—exacerbated by the recent FOMC meeting—has led to some profit-taking and consolidation.
Technical Analysis
Gold's chart on the daily and H1 timeframes shows a bullish bias, with the price trading above key moving averages (50-day MA at $3,520 and 200-day MA at $3,200). The recent pullback from $3,707 appears corrective, testing demand zones around $3,638-$3,644 where buyers stepped in aggressively.Key Support Levels:Immediate: $3,644–$3,638 (recent demand zone; strong buying interest here).
Long term Support and resistance
Support : $3,525–$3,580
Key Resistance Levels: $3,900 - $4,000
Trend Bullish
~~ Disclaimer ~~
This analysis is based on recent technical data and market sentiment from web sources. It is for informational \ educational purposes only and not financial advice. Trading involves high risks, and past performance does not guarantee future results. Always conduct your own research or consult a SEBI-registered advisor before trading.
# Boost and comment will be highly appreciated.
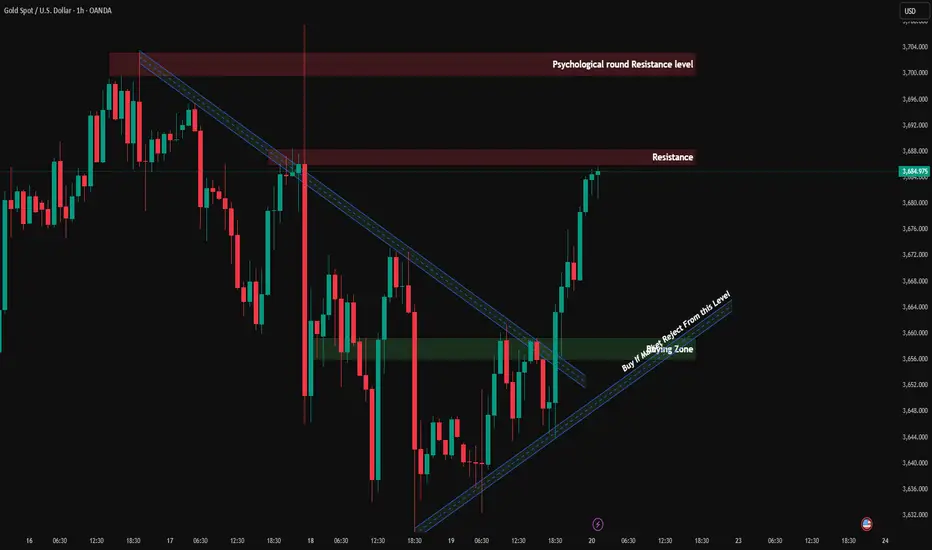
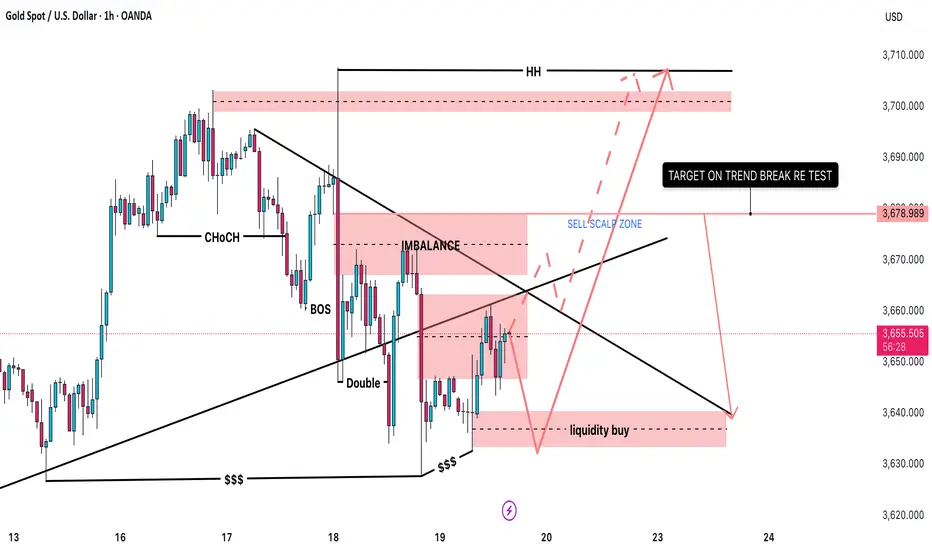
GOLD – Breakout / Swept High – Where to BUY?1. Market Overview
Gold prices are consolidating around 3655 – 3660 after showing a short-term bearish structure.
On the H1 chart, we can see clear supply and demand zones:
• Liquidity Buy Zone near 3640 (potential demand area).
• Imbalance / Supply Zone around 3670 – 3680.
The broader higher-timeframe trend is still bullish, but in the near term the market is retesting liquidity levels.
________________________________________
2. Key Levels & Zones
• Liquidity Buy Zone: 3640 – 3645 → important support.
• Sell Scalp Zone / Imbalance: 3670 – 3680 → short-term resistance.
• Higher High Target (HH): 3700 – 3710 → strong higher-timeframe resistance.
• Long-term Support: 3620 – 3630.
________________________________________
3. Main Trading Scenarios
🟢 Long Setup (with trend)
• Wait for price to revisit the Liquidity Buy Zone (3640 – 3645).
• If bullish reversal signals appear (pin bar, engulfing candle, etc.), consider entering a Long position.
🎯 Targets:
• Short-term: 3678 (trendline break retest).
• Mid-term: 3700 – 3710 (higher high).
🔴 Short Setup (scalp only)
• If price pushes into the Sell Scalp Zone (3670 – 3680) and faces strong rejection → take a Short scalp.
• 🎯 Target: 3640 – 3645.
⚠ Note: Shorts go against the main bullish trend, so they should be managed quickly and not held for long.
________________________________________
4. Trade Management Notes
• Focus on Long trades near support, as higher timeframe bias is still bullish.
• Short positions should only be taken as scalp setups near resistance.
• Risk control: limit risk to 1–2% per trade, avoid holding trades against the main trend.
________________________________________
📌 Conclusion
Gold (XAUUSD) is currently testing the descending trendline and resistance zone.
• A successful breakout may lead price towards 3700+.
• Otherwise, the market is likely to dip back into 3640 before starting the next bullish leg.

XAUUSD Forecast – Gold Price Action and Market InsightsXAUUSD Forecast – Gold Price Action and Market Insights
Gold is showing signs of stabilization after recent fluctuations, with price consolidating around the mid-range levels. The chart highlights repeated sequences of structural breaks and shifts, indicating that liquidity has been actively swept on both the buy and sell side.
The latest market move shows a controlled decline, followed by an attempt to absorb selling pressure. Current positioning suggests the possibility of a short-term liquidity grab to the downside, which could fuel a stronger recovery leg in the sessions ahead.
The projected outlook favors a scenario where buyers regain momentum, aiming to retest the upper price zones. If this momentum develops, the market may establish a renewed upward leg in alignment with the broader bullish cycle observed across higher timeframes.
From a macro perspective, gold continues to be supported by demand for safe-haven assets amid ongoing global financial uncertainty and shifting monetary policies. This backdrop enhances the probability of gold sustaining its mid-term bullish trajectory despite temporary corrective phases.

XAUUSD - Flag PatternWhats your take on Guys.
#Institutions Consolidation going on - #Accumulation or #Distribution.
Kind of #Triangle #pattern in formation, ##Flagpattern. DO your analysis, Enter trade on Breakout and confirmation side. Trade with #confluence. i would say accumulate at bottom of pattern with SL and Participate in full swing before #Breakout.

Gold holds firm at 3,63x | Caution for Friday session🟡 XAU/USD – 19/09 | Captain Vincent ⚓
🔎 Captain’s Log – Market Context
FED : Probability of a 25bps cut in October is 91.9%, while holding rates is only 8.9% → almost certain FED will continue easing.
US News : No major data today, market remains quiet.
Gold : Sharp moves in Asia session, but support 3,632 – 3,630 held strong.
Yesterday’s Buy at 3,62x delivered 200 pips , confirming this zone as a “fortress” support.
Note : Today is Friday – end of the week session, unexpected volatility may occur before the weekly close → strict risk management required.
⏩ Captain’s Summary : Gold remains bullish, but caution is needed with end-of-week swings. Golden Harbor around 3,63x continues to be a solid anchor.
📈 Captain’s Chart – Technical Analysis
Storm Breaker (Resistance / Sell Zone)
3,661 – 3,663 (intraday resistance)
3,683 – 3,685 (strong OB, likely profit-taking zone)
Golden Harbor (Support / Buy Zone)
3,602 – 3,605 (FVG zone – deeper support if 3,63x breaks, waiting for strong demand)
Market Structure
After rebounding from 3,62x, Gold consolidated around 3,65x – 3,66x.
Main trend stays bullish, but needs support retest to confirm buyers’ strength.
3,66x is the pivot barrier:
• Breakout → targets 3,68x
• Rejection → retest 3,64x – 3,62x
🎯 Captain’s Map – Trade Plan
✅ Buy (priority)
Entry: 3,602 – 3,605
SL: 3,588
TP: 3,629 – 3,661 – 3,683
⚡ Sell (short scalp)
Entry: 3,683 – 3,685
SL: 3,695
TP: 3,665 – 3,645
⚓ Captain’s Note
“The 3,63x fortress continues to hold, keeping the Golden ship safe on its northward journey. Golden Harbor 🏝️ (3,602 – 3,605) remains the main dock for sailors to gather strength. Storm Breaker 🌊 (3,683 – 3,685) may raise waves, suitable for short Quick Boarding 🚤 . Today is Friday – the sea can shift unexpectedly, so keep the sails full but hands steady on the helm.”

Gold XAUUSD feeling exhausted start sell on rise Gold sell on rise until recent high high 3705 not break and sustain above, profit booking will come , if break 3615 then short term downtrend will start , 3560, 3515 ,3480 downside target
Avoid any buy trade at current price risk of trapping on buy side at top

GOLD - Breakout / Swept High appear - Where to BUY ? 🟡 OANDA:XAUUSD XAUUSD Daily Plan – September 19, 2025
1. Market Overview
Price is consolidating around 3655 – 3660 after forming a short-term bearish structure.
On H1, several supply & demand zones are highlighted:
Liquidity Buy Zone around 3640 (potential demand).
Imbalance / Supply Zone around 3670 – 3680.
The overall higher-timeframe trend remains bullish, but in the short term, the market is retesting liquidity areas.
2. Key Levels & Zones
Liquidity Buy Zone: 3640 – 3645 → key support.
Sell Scalp Zone / Imbalance: 3670 – 3680 → short-term resistance.
Higher High Target (HH): 3700 – 3710 → strong higher-timeframe resistance.
Longer-term Support: 3620 – 3630.
3. Main Trading Scenarios
🟢 Long Setup (trend-aligned)
Wait for price to retest Liquidity Buy zone 3640 – 3645.
If reversal signals appear (pin bar, engulfing, etc.), consider opening Long.
Targets:
Short-term: 3678 (trendline break retest).
Mid-term: 3700 – 3710 (HH).
🔴 Short Setup (scalp only)
If price retraces into Sell Scalp Zone 3670 – 3680 and shows strong rejection → Short scalp opportunity.
Target: 3640 – 3645.
Note: Short trades are counter-trend, so manage quickly.
4. Trade Management Notes
Prioritize Longs from support zones since the higher-timeframe trend is still bullish.
Shorts should only be seen as short-term scalp opportunities near resistance.
Risk management: limit to 1–2% per trade, avoid holding against the main trend.
📌 Conclusion: XAUUSD is currently testing the descending trendline and resistance area. A successful breakout could target 3700+. Otherwise, the market is likely to revisit 3640 before launching the next bullish leg.
Gold Correction: Fed Warning vs. Massive Safe-Haven Flows Hello, traders!
Gold pulled back to $3,845.78/oz after Dallas Fed President Lorie Logan called for caution regarding further rate cuts.
Fundamentals: Fed Warns, But the Buying Wave is Unstoppable
The market stands at a crossroads:
Downward Pressure: The caution signal from Fed's Logan.
Upward Momentum: Government shutdown (increases instability, delays jobs report), weak private sector jobs data (down 32k), and SPDR Gold Trust ETF holdings rising to the highest level since 2022.
Conclusion: Political instability and weak economic data continue to reinforce the likelihood of a Fed rate cut. Massive safe-haven capital is flowing into Gold.
Technical Analysis & Strategy
Gold retreated to the FIBO 0.618 - 0.5 zone, indicating a healthy technical correction after the sharp rally. Priority remains Buy if the price holds above $3861. Be cautious of Stop Loss hunting.
Resistance: $3870, $3884, $3894
Support: $3855, $3833, $3798
Trading Strategy (Tight SL):
BUY SCALP: $3838 - $3836 / SL: $3832 / TP: $3846 - $3857
BUY ZONE: $3798 - $3796 / SL: $3788 / TP: $3816 - $3836
SELL ZONE: $3888 - $3890 / SL: $3898 / TP: $3870 - $3850
Do you think the Fed's warning is strong enough to reverse this trend? 👇
#Gold #XAUUSD #Fed #GovernmentShutdown #TradingView #PhânTíchVàng #ETF
