XAUUSD – Weekly outlookXAUUSD – Weekly outlook: structure points towards 4,580 as long as bulls hold the line
Brian – Favouring buy-the-dip setups while price holds above 3,996
1. Market overview – triangle break and trend confirmation
On the daily chart, gold has finally broken out of the long consolidation triangle, with Friday’s candle closing cleanly above the descending trendline that has capped price for weeks.
For me, this breakout is the first proper confirmation that the primary bullish trend is resuming.
The next major resistance on the chart sits around 4,246 – a key level I’m watching as a trend-confirmation line.
If price can break and hold above 4,246, the path towards the higher zone around 4,580 opens up, in line with the Fibonacci extension drawn on the chart.
In short: the structure into next week is bullish, with pullbacks seen as opportunities to position for a potential move towards new highs.
2. Technical structure – from breakout to extension targets
The breakout from the triangle comes after a sequence of higher lows bouncing off the rising trendline, indicating accumulation rather than distribution.
Below price, we have demand zones clustered around the 4,110 trendline area and deeper supports near 4,040 and 3,920.
Above price, the roadmap is fairly clear:
First, a test of 4,246 (local resistance & former supply).
Then the ATH / prior high region around 4,360–4,380.
Finally, the Fibonacci 1.618 extension projects into the 4,560–4,580 zone, which is my medium-term upside objective if bulls can maintain control.
As long as daily structure keeps printing higher highs and higher lows and price stays above the key invalidation at 3,996, I will continue to treat gold as buy-on-dip rather than looking for major tops.
3. Key zones & trading ideas for next week
I’m not treating this as a signal service, but here’s how I’m mapping the chart for my own trading:
Primary idea – Buy the dip into trendline / support
Watch zone: around the rising trendline near 4,110.
If price pulls back into this area early in the week and shows a clear rejection on H4/D1 (wick rejections, bullish engulfing etc.), I’ll be interested in building long positions.
Upside path:
First objective: 4,246 – trend-confirmation resistance.
If broken and retested from above, the next leg could extend towards 4,360–4,380.
Extension target: 4,560–4,580 in line with the 1.618 Fibonacci projection.
Secondary idea – Using Fibonacci zones on break above 4,246
If gold breaks and holds above 4,246, the Fibonacci zones between roughly 4,360 and 4,580 become interesting for scaling in / managing positions:
Partial profits or tight trailing stops can be considered as we approach 4,360–4,380.
Any healthy corrective pullback from that region that respects the rising structure could still offer add-on entries with the 4,580 zone as a medium-term target.
Invalidation:
A daily close below 3,996 would seriously damage this bullish structure and force me to reassess. Below that, I would step aside and wait for a new pattern rather than trying to force the long idea.
4. Fundamental backdrop – why gold still has a bid
From a macro point of view, gold is navigating a mix of:
Tariff and trade tensions, which keep hedging demand alive as investors look for protection against policy shocks.
Ongoing geopolitical risks and conflict, supporting gold’s role as a classic safe-haven asset.
A late-cycle interest-rate environment, where markets are increasingly focused on when and how aggressively central banks will adjust policy after a period of elevated rates and liquidity distortions.
This combination tends to limit the downside for gold: even when we see corrections, dip-buyers are never too far away, especially when the technical structure is aligned with the macro story.
5. Strategy & risk management
Into next week, my bias is clear: structure is bullish above 3,996, so I prefer buying pullbacks rather than trying to short into strength.
The trendline around 4,110 is my first area of interest for fresh longs; anything closer to 4,040–4,000 (if we see a deeper flush) would be considered an even better price, provided the daily structure doesn’t break.
As always, position sizing and stop placement are key – one good weekly move is far more valuable than several emotional entries trying to catch every candle.
What do you reckon – does this breakout have enough fuel to take us towards 4,580, or do you see a deeper correction setting up first? Feel free to share your view in the comments.
Trade ideas

XAUUSD – LANA WAITING TO BUY THE CONTINUATION WITHIN THE ...XAUUSD – LANA WAITING TO BUY THE CONTINUATION WITHIN THE UPTREND CHANNEL
1. Fundamental Analysis
Gold is maintaining its upward momentum as investors closely monitor the Russia–Ukraine tension and the mixed signals around potential peace efforts.
President Putin’s recent statements suggest peace proposals could form the basis of a future agreement, yet Russia is still prepared to continue fighting if conditions are not favourable. This creates a mixed risk environment — reducing short-term safe-haven demand but still keeping geopolitical uncertainty elevated, which may pressure the USD in the medium term.
In this context, Lana prefers the scenario where gold continues to follow the broader uptrend, looking for opportunities to buy on technical pullbacks into major liquidity zones rather than FOMO entries at higher prices.
2. Technical Analysis
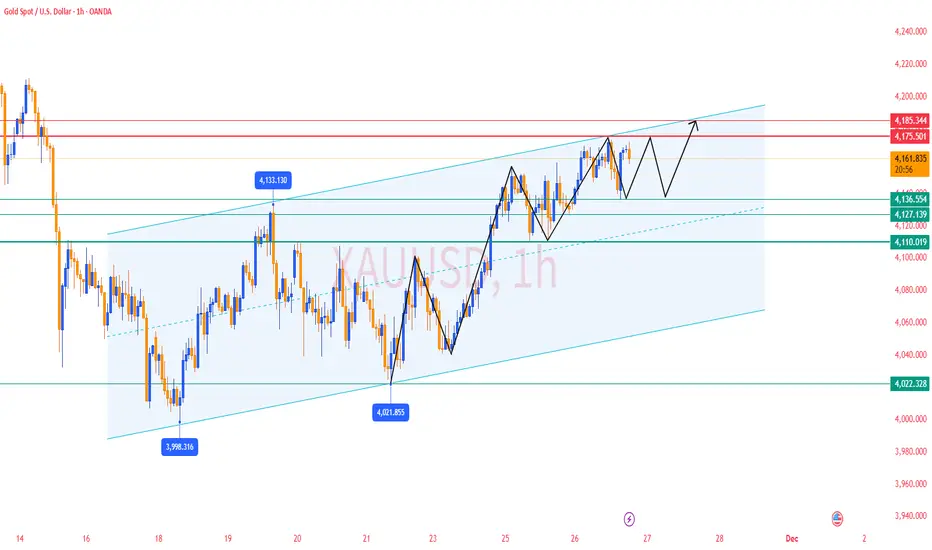
On the H1 timeframe, XAUUSD is moving inside a clear ascending channel, currently trading near the midline of the channel. The dominant structure remains bullish, with no sign of a break of market structure.
After a strong bullish candle, the market left a Strong Liquidity area below and created a small Gap under the channel — this is where Lana expects price to retrace and retest before resuming the upward movement.
The Buy zone aligns with a major liquidity region near 4,166–4,167, close to the lower boundary of the channel — an ideal level for continuation buys during a controlled pullback.
Using Fibonacci extensions, the key levels include:
1.618: near the current price — a region where price often pauses or consolidates
2.618: around 4,210 — Lana marks this as a potential short-term Sell scalping zone
3.618: around 4,235–4,237 — a stronger Sell zone where heavy profit-taking may appear
The 4,155 level is a key structural boundary:
If price breaks below and holds under this zone, Lana will stop prioritising long-term buy setups, as the bullish channel may be invalidated.
3. Key Levels to Watch
Support / Buy zone & strong liquidity:
4,166 – 4,167 (near the midline descending toward the lower channel boundary)
4,155 — mid-term trend boundary
Resistance / Fibo extension & Sell zones:
4,210 – 4,213: Sell scalping zone (Fibo 2.618)
4,235 – 4,237: Strong Sell zone (Fibo 3.618), near the channel top
4. Trade Setups
BUY Setup:
Buy: 4166 – 4167
SL: 4160
TP: 4182 – 4195 – 4210 – 4250
SELL Setup 1:
Sell: 4210 – 4213
SL: 4218
TP: 4200 – 4185 – 4160 – 4145
SELL Setup 2:
Sell: 4235 – 4237
SL: 4243
TP: 4212 – 4200 – 4185 – 4160
👉 Follow Lana on TradingView to read all updates early. 💛

XAUUSD Weekly Analysis 01/12/2025 - 07/12/2025Namaste Everyone,
It doesn't get easier than this, all timeframes are bullish, overall i am bullish. (no blind entries, wait for the pullback)
Price will move up although i feel that the h4 fvg might be disrespected because of monday open, i don't think that monday will expand directly. Overall bullish bias I will wait for my setup before entering not entering directly ahahaha. There's SMT With XAGUSD at the highs but I believe that it's just a lag and price will catch up with silver.
Thank you and keep winning!

“GOLD MEGA RALLY: Road to $6,500 — Super-Cycle in Full Power
Gold has broken above $4,200/oz, confirming that a super-cycle has officially started. The breakout is not just technical — it is backed by global liquidity, record central-bank demand, and collapsing real yields.
My view: Gold is preparing for a parabolic rally toward $6,500 next year, where a major cycle top is likely to form.
🔥 Why Gold Can Hit $6,500
* Liquidity Cycle Turning Up
Fed QT slowdown + rising expectations of QE → strongest setup for commodities in a decade.
* Historic Central Bank Buying
China, India, Middle East are accumulating gold aggressively → long-term supply squeeze.
* Inflation Pressure Still Alive
Sticky inflation + slowing growth = real yields trending lower → ultra-bullish for gold.
* Geopolitical Premium
Safe-haven flows accelerating with every global conflict headline

Gold next week expected move gold if closes today above 4205-4210
and monday goes above today high we are in for a good buy candle
upside potential there .

Gold H1 – Will 4212 Hold and Drop to 4160 Today?🟡 XAUUSD – Intraday Smart Money Plan | by Ryan_TitanTrader (27/11)
📈 Market Context
Gold is currently trading within a rising institutional channel after strong H1 displacement. The market is compressing into a liquidity-rich consolidation phase — a classic Smart Money trap environment before engineered expansion.
What Smart Money desks are targeting today:
• Expectation of USD strength shaping bearish bias
• Liquidity sweeps above internal range highs
• Consolidation fakeouts to induce retail mis-positioning
• CHoCH/BOS confirmation required before real directional move
The chart shows equal liquidity zones positioned at premium (sell opportunity) and discount (re-entry buy region).
🔎 Technical Framework – Smart Money Structure (H1)
Current state = Accumulation / Redistribution phase
Liquidity map highlighted zones:
• Premium liquidity zone: 4212 – 4214 (target for short trap)
• Discount liquidity origin zone: 4165 – 4163 (higher timeframe demand re-entry)
• Equilibrium / Chop zone: 4180 – 4195 (no trade unless displaced)
• Trendline support: ~4173 region (must break for downside continuation)
Expected sequence:
Sweep → CHoCH/MSS → BOS → Displacement → Retest (FVG/OB) → Expansion
🎯 Trade Plans for Today
🔴 SELL GOLD 4212 – 4214 | SL 4222
Thesis: Liquidity sweep at premium highs before bearish displacement
Entry activation rules (must wait):
• Price taps 4214 liquidity pocket
• Bearish CHoCH/MSS + BOS down on M5–M15
• Entry taken at FVG fill or order block retest after BOS
Targets:
1. 4200 (first reaction)
2. 4187 – 4185 (BOS retest zone)
3. 4170 (channel mid-equilibrium)
4. 4165 – 4163 (H1 demand retest / profit core)
🟢 BUY GOLD 4165 – 4163 | SL 4143
Thesis: Discount origin tap for impulse continuation buy
Entry activation rules (must wait):
• Price sweeps into 4163 pool
• Bullish CHoCH/MSS + BOS up on M5–M15
• Strong bullish rejection wick + FVG fill confirmation
Targets:
1. 4185 – 4187 reclaim zone
2. 4200+ institutional expansion target
3. 4212+ premium revisit
⚠️ Risk Management
• Avoid trading inside 4180 – 4195 unless displaced
• Do NOT interpret sweeps as trend entries — they are traps
• SL = structure invalidation, no averaging in consolidation
• Reduce size during monetary headlines unless MSS confirms
📝 Summary
Gold is currently in engineered liquidity mode. Expect either:
• Sweep 4214 → MSS/BOS down → drop into 4163 discount retest,
or
• Tap 4163 → bullish MSS/BOS up → expand toward 4200 – 4212+
Today = confirmation-based execution only, not trend chasing.
📍 Follow @Ryan_TitanTrader for daily Smart Money updates.

XAUUSD – Ascending Channel in Play, Upside Target Towards 4,240
Brian – Focusing on buying the dip, watching for short setups near upper resistance
Market overview & structure
On the H4 chart, gold is moving neatly inside a well-defined ascending channel, with higher highs and higher lows. The current leg is pointing towards the 4,237–4,240 region, which aligns with:
The upper boundary of the channel.
A key resistance zone.
The 1.618 Fibonacci extension and resting liquidity above recent highs.
This keeps the broader bias bullish, but as price approaches 4,240, the probability of profit-taking and short-term selling pressure naturally increases.
Wave & technical context
The current move is an extension of the previous bullish structure after price broke out of the old bearish channel and started to consolidate in a new bullish one.
Liquidity levels around 4,193 and above suggest that the market has been building positions and has room to drive price into higher resistance.
The buy zone highlighted near the lower boundary of the channel, around 4,154–4,157, is where buyers are likely to step back in to defend the trend.
As long as price holds above 4,150–4,154, the scenario of a continuation towards 4,240 remains the higher-probability path.
Key zones & trading plan
Primary scenario – Buy with the trend inside the channel
Buy zone: 4,154–4,157 (channel support + marked buy zone).
Idea: Wait for a pullback towards the lower boundary of the channel, or a brief liquidity sweep into this zone, followed by a clear rejection candle on H1/H4 before entering long.
Targets:
Short-term: 4,190–4,200 (mid-channel / interim liquidity).
Extended: 4,237–4,240 (major resistance + 1.618 Fibonacci extension).
This is a trend-following “buy the dip” setup suitable for swing or short-term positional traders.
Secondary scenario – Short-term sell from 4,237–4,240
Sell zone: 4,237–4,240 – the confluence of strong resistance and the 1.618 Fibonacci extension.
Idea: If price tags this zone and shows clear rejection (long wicks, bearish reversal pattern on H1/M15), it may offer a counter-trend short back towards the mid-channel or 4,190–4,200 support.
This is a short-term, counter-trend idea, so:
Position size should be smaller than the main long setup.
Stop loss should be kept tight above 4,240 and not dragged wider out of emotion.
News & broader context
Liquidity conditions may thin out towards the end of the day due to the ongoing Thanksgiving holiday period in the US, which can lead to sudden spikes and stop hunts, especially around obvious liquidity pools.
On the political side, headlines such as Mr. Trump’s comments about “permanently suspending immigration from third-world countries” add to general policy uncertainty, but the impact on gold is mostly indirect through broader risk sentiment.
Another interesting point: silver has been rallying strongly, supported by solar-energy demand and supply concerns. It is acting like a “silent workhorse”, attracting fresh capital. This does not remove gold’s role, but shows that precious metals as a whole are gaining attention.
Strategy & risk management
For now, my focus remains on buying dips around 4,154–4,157 in line with the ascending channel, and only looking for short, tactical sell setups if price clearly rejects 4,237–4,240.
I prefer to avoid entering fresh trades when US liquidity is very thin or right into major holiday sessions, as spreads can widen and price action can become erratic.
Once price closes decisively below the buy zone and breaks the channel structure, this bullish plan loses validity, and it is better to step aside and reassess rather than forcing trades.
What do you think – does this channel still favour the bulls, or are you expecting a deeper correction from the 4,240 region? Feel free to share your view in the comments.

GOLD broke out of the H4 trendline — real breakout or trap? Hello Traders! 👋
Gold has broken out of the H4 descending trendline, boosted by geopolitical tension and a weaker USD.
But the real question is: Is this a true breakout or just FOMO before a drop?
Here are the key zones I’ll be watching today:
BUY Zones (SL 10 – TP 10)
• 4165 – 4155
• 4170 – 4175
• 4140 – 4145
• 4110-4108
• 4099-4096
SELL Reaction Zones (SL 10 – TP 10)
• 4200 – 4203
• 4212 – 4215
• 4230-4035
• 4245 – 4247
👉 If price breaks below 4133, the trendline fails → potential sell-continuation setup.
📌 Bias: BUY is the main play — SELL only for short reaction scalps.
💬 What do YOU think — real breakout or classic bull trap? Drop your thoughts below!
❤️ Let’s discuss & grow together!

XAUUSD – SHORT-TERM TREND STILL UNCERTAIN, WAIT FOR PRICE TO ...XAUUSD – SHORT-TERM TREND STILL UNCERTAIN, WAIT FOR PRICE TO RETURN TO LIQUIDITY ZONES
1. Fundamental Analysis
In today’s session, gold is holding a mild pullback after touching its highest level in nearly two weeks.
Market sentiment has turned slightly more risk-on, causing capital to move away from safe-haven assets. This reduces short-term demand for gold and triggers profit-taking.
However, the Fed’s dovish expectations continue to keep the USD weak, which remains a supporting factor for gold in the medium term. Lana views the current phase mainly as a technical correction and prefers waiting for price to reach key liquidity zones before taking action.
2. Technical Analysis
On the H1 timeframe, after a strong upside move, price is slowing down and showing a confirmation of downward pressure from the upper resistance zone.
The rising trendline beneath is still holding the overall structure, suggesting the broader trend remains intact, but momentum is fading and the market is entering a more indecisive phase.
Below the price, the FVG demand zones around 4113–4111 and the deeper 4085–4088 represent liquidity areas where Lana expects buyers may step back in.
Above the price, the 4194–4196 zone is a key resistance area, aligned with supply and upper liquidity, suitable for a correction sell setup if price retests it.
3. Key Price Zones to Watch
Upper liquidity / major resistance:
• 4194 – 4196
Lower liquidity / support & FVG zones:
• 4113 – 4111: first demand zone, near the rising trendline
• 4085 – 4088: deeper FVG zone, stronger support if correction extends
4. Trade Setups
SELL: 4194 – 4196
SL: 4200
TP: 4175 – 4160 – 4122 – 4105
BUY: 4113 – 4111
SL: 4105
TP: 4133 – 4155 – 4170 – 4190
BUY: 4085 – 4088
SL: 4080
TP: 4095 – 4110 – 4133 – 4150 – 4185
👉 Follow Lana on TradingView to get the earliest gold analysis updates. 💛

XAUUSD Outlook: Recent Gains Have Been Quite Steady!The market outlook for XAUUSD remains clearly optimistic. The latest price movement has shown a steady recovery, pushing towards the upper boundary of the newly forecasted price channel. This presents another excellent opportunity to get involved.
The market may be in the early stages of a strong new bullish leg. We could also see some consolidation or a short-term pullback before continuing towards the upper boundary, but I believe the second scenario is more likely.
My target would be 4,350.

Update 3: GOLD BUY POINTS Buy point:
4148
4140
Target : 4172 - 4205
entry are valid only when you see 5 min CHoCH any candle touch a the zone and then any minor support breaks then punch a trade with Close base Sl on top and Vice versa
Sell side only when : if this triangle give breakout and then sell at 4168 and book near at 4145 and then again plan for a buy just play the move..
these are the points of reversal i already published this if you dont want to buy then just check the analysis tomorrow night

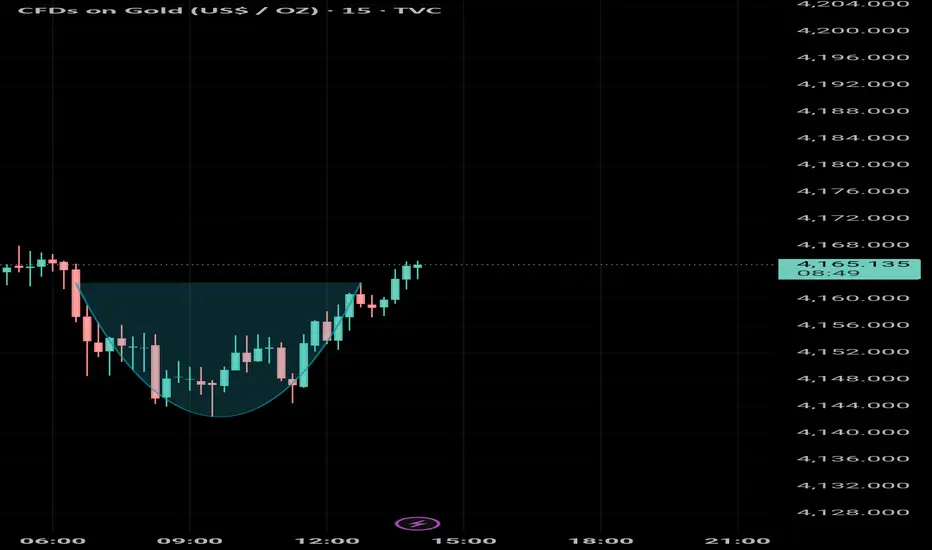
GOLD 1H | PDH/PDL Compression Breakout • Cup & Handle + Rising WGOLD 1H – ICT + Price Action Analysis
Price is currently compressing between PDH (Previous Day High) and PDL (Previous Day Low) forming a rising wedge inside a broader cup & handle pattern.
🔹 Cup formation shows accumulation
🔹 Handle retest confirming buyers stepping in
🔹 Rising wedge indicates volatility squeeze
🔹 Price staying above PDL = bullish protection
🔹 PDH breakout expected if liquidity stays intact

My Gold Trade Plan Gold is moving in a Triangle 🪭
Possible a short trade move can be made till tomorrow

USD Stunned: Buy Gold at the Adjustment Bottom!1. Fundamentals Quick Take
US Data: Positive (Jobless Claims 216K, lowest in 7 months, Durable Goods +0.5%).
Fed Policy: Extremely Dovish. Fed officials hint at a 25bps rate cut as early as December.
Impact: Low interest rate expectations push DXY down: Strong support for Gold.
2. Technical Outlook - H1
Trend: Strong Uptrend.
Position: Price is below Resistance/Supply (CP Zone - around 4,175 - 4,195). High likelihood of short-term adjustment.
Strategy: Focus on BUY (Long) at strong Demand/Support zones, do not Short based on short-term reactions.
Ideal Long Zone: Around 4,129 or 4,096.
Conclusion: Wait for price to adjust to the Demand zone to enter Long orders following the main trend, based on the USD's decline momentum from Fed signals.
#XAUUSD #Gold #Fed #DXY #TradingView

Gold may continue rising — Trading around 4,150–4,200 range📊 Market outlook:
• Spot gold is currently around 4,150 USD/oz.
• It is up roughly +0.20% (≈ +8 USD) over the past 24 hours.
• The rise is supported by expectations that the Federal Reserve (Fed) may cut interest rates soon, making non-yielding assets like gold more attractive.
📉 Technical view (short-term):
• Support zone: ~ 4,130 – 4,140 USD/oz — watch for a retracement bounce.
• Resistance zone: ~ 4,180 – 4,200 USD/oz — a breakout could trigger further gains.
• In a low-interest environment and with ongoing macro uncertainties, gold remains a safe-haven asset — bullish bias continues.
📌 Interpretation:
• In the short term, gold is likely to rise further if expectations of rate cuts remain strong.
• If U.S. economic data comes in stronger and the Fed turns hawkish → a minor correction is possible.
• Current bias: upside, but sensitive to U.S. economic data and Fed signals.
💡 Trading Strategy:
🔺 BUY XAU/USD: 4,135 – 4,132
🎯 TP: 40 / 80 / 200 pips
🛑 SL: 4,129
🔻 SELL XAU/USD: 4,185 – 4,188
🎯 TP: 40 / 80 / 200 pips
🛑 SL: 4,192

Round Bottom BreakOut Above 4162 more RISE awaited 🤞
Expected to hit :
TP 1: 4174
TP 2: 4180
TP 3: 4184+
XAU/USD: Gold Stagnates, Poised for a Strong Surge📊 Market Structure
Gold is moving in a tight accumulation phase (compression) between two important zones:
• OB Support: 4,130 – 4,126
• Resistance – Small Supply: 4,148 – 4,166
The previous trend remains a strong uptrend (clear BoS sequence from 4,089), and currently, the price is retesting the newly formed peak-bottom structure.
The BUY side is still in control as long as the price stays above:
• 4,130 – Main OB Support
• 4,104 – Discount FVG
• 4,089 – Key Low Confirming Trend
If gold holds these zones, the next targets will be the upper liquidity levels:
• 4,166
• 4,181
• 4,207
• 4,243
💎 Key Technical Zones
• OB Support 1: 4,130 – 4,126
• FVG Zone: 4,104 – 4,089 (best discount)
• Deep Bearish OB: 4,060 – 4,045 (if price drops sharply)
• Upper Liquidity Targets: 4,166 → 4,181 → 4,207 → 4,243
🎯 Trading Plan (Priority BUY)
1️⃣ BUY 1 – Retest OB 4,130
When the price touches the OB support zone 4,130 – 4,126 and shows a bounce signal (rejection / engulfing).
• Entry: 4,130 – 4,126
• SL: below 4,115
• TP1: 4,166
• TP2: 4,181
• TP3: 4,207
• TP4: 4,243
→ Quick setup, good RR, trend aligned.
2️⃣ BUY 2 – Discount FVG 4,104 – 4,089
This is the best BUY zone if the market drops sharply before rising.
• Entry: 4,104 – 4,089
• SL: 4,070
• TP1: 4,166
• TP2: 4,181
• TP3: 4,207
• TP4: 4,243
→ Strong confluence: FVG + fibo discount + key liquidity.
3️⃣ BUY 3 – Deep Accumulation at Bearish OB Shift
• Entry: 4,060 – 4,045
• SL: 4,020
• TP: 4,104 → 4,166 → 4,207
→ Only activate if “flush liquidity” appears.
🎯 SELL Scalp (secondary – not priority)
Only SELL when there is a clear rejection reaction at:
• 4,166 – first liquidity sweep zone
• 4,181 – strong reaction zone
• 4,207 – main bearish OB
• 4,243 – large liquidity peak
• SL: 10–15 USD
• TP: 4,148 → 4,130
→ For scalpers only, not a main setup.
🧠 Vincent’s View
The market structure remains completely bullish. The market is accumulating energy in a narrow range before breaking strongly to the upper liquidity targets.
As long as gold stays above 4,089 – the uptrend remains dominant.
“Patience builds the entry – liquidity completes the move.” ⚜️
⏰ Timeframe: 1H
✍️ Analysis by: Captain Vincent

Gold H1 - Can Gold reject 4167 and fall to 4133 today?🟡 XAUUSD – Intraday Smart Money Plan | by Ryan_TitanTrader (27/11)
📈 Market Context
Gold is trading inside an intraday consolidation after a strong H1 displacement. The session is now primed for liquidity engineering before the next leg.
Key narrative drivers traders must respect today:
• Stronger USD expectations continue to shape risk sentiment
• Institutional desks frequently exploit sweep zones during consolidation
• Range-bound conditions favor fakeouts → displacement → expansion mechanics
• Headlines around U.S. monetary tone amplify intraday volatility
The current chart highlights balanced liquidity both above and below structure, supporting a two-way SMC playbook.
🔎 Technical Framework – Smart Money Structure (H1)
Market is holding a rising channel, but internally ranging — a typical liquidity map scenario:
• Buy-side liquidity pocket: 4180 → 4182 (premium extreme)
• Sell-side liquidity pool: 4110 → 4133 (discount extreme / origin zone)
• Internal equilibrium zone: 4150–4170 chop region (no-trade area)
We expect this sequence:
Sweep → CHoCH/BOS → Displacement → Retest → Expansion.
🎯 Trade Plans for Today
🔴SELL GOLD 4180–4182 | SL 4190
Thesis: Premium liquidity sweep above local highs before downside displacement.
Activation rules:
• Price sweeps 4182 liquidity
• Bearish CHoCH/MSS + BOS down on M5–M15
• Imbalance retest / FVG entry after structure break
Targets:
• 4167 (nearest reaction)
• 4150 (equilibrium raid)
• 4135–4133 (discount retest)
🟢 BUY GOLD 4135–4133 | SL 4125
Thesis: Sell-side liquidity sweep into the origin zone before upside impulse.
Activation rules:
• Price taps 4133 pool (sweep below structure)
• Bullish CHoCH/MSS + BOS up on M5–M15
• FVG fill / bullish rejection wick confirmation
Targets:
• 4155+
• 4167 (reclaim zone)
• 4180+ (premium raid target)
⚠️ Risk Management
• Do NOT trade inside 4150–4170 without clear displacement
• Wait for CHoCH + BOS before execution
• Treat the upper and lower zones as liquidity traps, not trend entries
• Reduce size during news spikes unless structure confirms
• SL = wave invalidation, no averaging in chop
📝 Summary
Gold is in accumulation/redistribution mode. Desks may:
• Run buy-side liquidity at 4182, then displace down → retest discount
or
• Sweep sell-side liquidity at 4133, confirm CHoCH up → expand with impulse
Today is a liquidity session, not early trend chasing. Execute only after confirmation.
📍 Follow @Ryan_TitanTrader for daily Smart Money updates.

Elliott Wave Analysis XAUUSD – 27/11/20251. Momentum
D1:
D1 momentum is contracting and preparing to reverse. We need to wait for today’s daily candle to close to confirm the reversal signal. If confirmed, the market may enter a downward phase lasting around 4–5 days.
H4:
H4 momentum continues to decline and is approaching the oversold zone. This indicates that the current downward move is weakening, and a corrective bounce is likely once H4 momentum reverses in the oversold area.
H1:
H1 momentum is also decreasing and moving toward the oversold zone. Therefore, we expect a mild bounce once H1 momentum turns upward.
________________________________________
2. Wave Structure
D1:
The wave structure on H4 remains unchanged from previous analysis. The key difference is that D1 momentum has now contracted and shows signs of reversal, strengthening the scenario of a continuation of the purple Y wave. The completion of this Y wave will likely align with the moment D1 momentum descends into the oversold zone and reverses.
H4:
On the H4 timeframe, the blue ABC corrective structure is close to completion, and the market is currently in the final stage of wave C.
Based on H4 momentum reversal cycles, a series of lower highs and lower lows suggests that the ABC structure is likely complete and price is in the final phase of wave Y.
H1:
On H1, a 5-wave black structure is forming. In yesterday’s analysis, I presented two scenarios and explained the characteristics of each. With D1 momentum now reversing, I am leaning toward the scenario where the 5 black waves represent the C wave of the blue structure.
Yesterday’s targets for wave 5 (black) and wave C (blue) were truncated — price only reached 4173.8 and failed to touch 4184. Since then, the market has been moving sideways within a wide range.
Key observations:
• Price rose but failed to break the 4173.8 high.
• Price later dropped near 4137.
• RSI showed bearish divergence from wave 3 (black): price made higher highs while RSI made lower highs → suggesting wave 5 likely completed as an Ending Diagonal.
At this stage, I want to see price break below 4137 before H4 momentum reverses upward. This would provide additional confirmation that the ABC corrective structure has completed.
The 4058 zone continues to be a strong liquidity area to look for sell entries under the assumption that wave 5 has finished.
________________________________________
3. Trading Plan
Sell Zone: 4158 – 4160
SL: 4178
TP1: 4081
TP2: 4020
TP3: 3958

XAUUSD BUY OR SELL TODAY?1. Main Market Context for Today
Jobless claims came in better than expected → USD strengthens, but gold did not drop — it continued to move sideways → the market is in accumulation and waiting for a breakout.
Today’s priority strategy is range trading:
Lower range: 4130–4135
Upper range: 4170–4175
Once price breaks clearly out of either range → switch to trend-following (pursuit) trading.
2. Range-Trading Plan (Primary Strategy for Today)
(A) Buy at the Lower Range – 413X Zone
Buy area: 4130–4135
SL: 100 pips
TP: 100 pips
Reason: This is the main demand zone and aligns with the ascending trendline shown on your chart.
➡️ Strategy:
Wait for price to “sweep” the lows → show confirmation → then take a quick BUY trade.
(B) Sell at the Upper Range – 417X Zone
Sell area: 4170–4175
Reason: Strong supply zone with repeated reactions.
➡️ Strategy:
Wait for a rejection candle (pin bar / bearish engulfing) → then SELL.
3. Current Reaction Zone – 414X
This is the zone price is currently testing.
Do not enter immediately; just observe:
If price bounces strongly from 414X → target is to retest 417X
If 414X breaks → price will likely retest 413X → better BUY entries there.
4. Deeper BUY Zones (If Price Breaks Downward)
Here are the levels you mentioned, organized clearly:
BUY Zone
4110–4108
4102–4100
4096–4094
→ These are deeper liquidity zones below the main range, activated only if gold breaks below 413X.
5. SELL Zones if Price Breaks Upward (Above 417X)
SELL Zone
4202–4200
4194–4190
4183–4180
→ These are upper supply retest zones, activated only after price breaks above 417X.
🟨 6. Main Scenarios for Today
Scenario 1 – Expected Sideway (Highest Probability)
Price moves within 413X – 417X, bouncing between the range limits.
→ Trade the range (scalp/intraday).
Scenario 2 – Break Below Range
If 4130 breaks → price will head to 4110 → 4100 → 4094
→ BUY at deeper zones.
Scenario 3 – Break Above Range
If 4175 breaks → price will aim for 4183 → 4194 → 4200–4202
→ SELL at higher zones.
✅ One-Line Trading Summary
Trade primarily within the 413X–417X range (buy low – sell high). If the range breaks, switch to trend-following using the deeper BUY zones or higher SELL zones provided above.

Plan the day - Trade the plan Hello traders , here is the full multi time frame analysis for this pairs, let me know in the comment section below if you have any questions , the entry will be taken only if all rules of the strategies will be satisfied. wait for more price action to develop before taking any position. I suggest you keep this pair on your watchlist and see if the rules of your strategy are satisfied.

Gold Analysis and Trading Strategy | November 26–27✅ From the 4-hour chart, gold pulled back noticeably after forming a short-term high at 4173, indicating strong selling pressure above. The price has repeatedly failed to hold above 4170, confirming the effectiveness of the upper resistance. The price is currently trading above MA5 and MA10, but short-term bullish momentum is weakening. The Bollinger Bands are slightly narrowing, showing that the market has entered a high-level consolidation range. Overall, gold remains in a high-level sideways structure, with limited bullish continuation and a tendency for pullbacks after pushing higher.
✅ From the 1-hour chart, gold rebounded quickly after gaining support at 4136, but once again showed a long upper shadow after testing 4173, indicating rejection. Although MA5 and MA10 remain upward-sloping, the candlesticks are repeatedly being pushed down, suggesting a short-term choppy structure. The Bollinger upper band is suppressing the price, and multiple attempts to break through have failed.
The 1-hour chart shows a weak upward attempt followed by consolidation, and price action above 4170 shows a lack of willingness from buyers to chase higher levels—short-term momentum remains weak.
🔴 Resistance Levels: 4170–4175 / 4182–4190
🟢 Support Levels: 4136–4140 / 4109–4115
✅ Trading Strategy Reference
🔰 1. Short on Rebounds (Main Strategy)
📍 Sell lightly in the 4170–4175 zone
🎯 Targets: 4156 / 4145 / 4136
⛔ Stop-loss: Above 4182
Reason:
H4 and H1 both show repeated failure to break higher
Long upper shadows indicate strong selling pressure
This zone is the top of the high-level consolidation range
🔰 2. Buy on Pullbacks (Secondary Strategy)
📍 Consider long positions near 4136–4140
🎯 Targets: 4160 / 4170
⛔ Stop-loss: Below 4128
Reason:
4136 is today’s key support and the previous rebound point
Short-term moving averages provide support below
As long as 4136 holds, price remains in a buy-the-dip zone within the consolidation structure
📌 Summary
Gold remains in a high-level consolidation structure:
Strong resistance at 4170–4175 → easy to pull back after testing
Solid support at 4136–4140 → buyers tend to step in on dips
📌 Short-term rhythm:
Sell high, buy low — trade within the 4136–4175 range.