Why Gold Hits Your SL🌟 Why Gold Hits Your SL 😭💛📈
Gold is one of the most aggressive and volatile assets in the market — and if you’ve ever wondered “Why does gold ALWAYS hit my stop-loss before moving in my direction?”, this post explains the real reason.
Let’s break it down clearly 👇
🔶 1. Gold Loves Liquidity — Not Levels 💦💰
Gold doesn’t move based on your support/resistance lines.
It moves based on liquidity, meaning:
Where traders place stop-losses ❌
Where pending orders sit 🎯
Where large institutions want to fill positions 🏦
Your SL is simply sitting where everyone else puts theirs, which makes it prime liquidity.
🔶 2. XAUUSD Spikes Are Designed to Collect Orders ⚡💥
Gold often creates sudden:
Wicks
Fake breakouts
Quick pumps or dumps
Sharp candle spikes
These moves are NOT random — they’re engineered to:
🔸 Trigger stop-losses
🔸 Activate pending buy/sell orders
🔸 Grab liquidity before the real move
This is why your SL gets hit by $1–$3 before price completely reverses.
🔶 3. Gold Moves Session-by-Session 🕒🌍
Gold behaves differently depending on the time of day:
Asia session → Slow, tight range
London session → First big manipulation
New York session → Volatility explosion + real direction
Most SL hunts take place when London opens or when NY session begins ⚠️🔥
🔶 4. Clean Highs & Lows = SL Magnets 🧲📌
Gold LOVES attacking:
Previous day’s high/low
Asian range high/low
London session extremes
Double tops & bottoms
Round numbers (like 4000 / 4050 / 4100)
These areas hold thousands of stop-losses.
So before gold takes a real direction — it sweeps them first. 🏹😈
🔶 5. The Classic Gold Pattern: Trap → Reversal → Expansion 🔁🚀
Most XAUUSD moves follow this sequence:
1️⃣ Sweep liquidity 😭
2️⃣ Fake breakout 😈
3️⃣ Sharp rejection 👋
4️⃣ Real trend begins 🚀
If you’ve ever seen price:
Break a level
Wick hard
Then reverse the entire move
That’s gold performing a liquidity grab.
🔶 6. How To Avoid Getting Stopped Out ✔️
Here’s what actually helps:
🌟 A. Don’t put SL exactly at obvious levels
Move it beyond common liquidity zones.
🌟 B. Wait for the sweep before entering
Let gold perform the trap first.
🌟 C. Trade reaction — not prediction
Look for re-entry after the wick forms.
🌟 D. Use sessions to your advantage
Avoid placing SL right before London/NY opens.
🌟 Final Words
Gold isn’t hunting you —
it’s hunting liquidity.
Your job is simple:
👉 Stop placing stops where everyone else does
👉 Let gold sweep liquidity first
👉 Then catch the real move
Trade smarter, not tighter. 💛⚡
Trade ideas

Gold elliot wave updateGOLD – Elliott Wave Update
The major red Wave (3) appears complete, and Gold is now working through its Wave (4) correction.
Wave A seems to be in place, and the current recovery looks like Wave B, developing as a flat or expanded flat.
If price moves above the 1.618 extension of Wave A, the flat structure gets invalidated.
Wave B can still rise toward any of the three resistance zones marked on the chart.
From here, Gold has multiple corrective possibilities:
🔸 Normal Flat / Zigzag:
Wave C drops below Wave A, completing a deeper correction.
🔸 Shallow Correction / Running Flat:
Price holds higher, Wave C stays above Wave A, and this leads directly into the next impulse Wave 5 without a major decline.
🔸 Ending Diagonal Possibility:
Wave C may also unfold as an ending diagonal, typically seen near the end of corrections.
Overall, Gold is forming its Wave (4), and once this correction—deep or shallow—finishes, the market should begin the final Wave (5) impulse to the upside will continue.Like this post if it helps you.Follow me to get updates

Gold Trading Strategy for 08th December 2025📌 GOLD (XAUUSD) INTRADAY TRADE PLAN
BUY SETUP – Breakout Above 1-Hour Candle
Idea: Buy only if the price shows strength by breaking and closing above the 1-hour candle high.
🔹 Buy Conditions
Buy Above: $4,241
Condition: Wait for a strong 1-hour candle close above $4,241.
After the candle closes, enter on the next candle when price retests or continues above this breakout zone.
🎯 Buy Targets
TP1: $4,256
TP2: $4,266
TP3: $4,277
🛡️ Stoploss (SL) for Buy
Conservative SL: Below $4,233 (previous 1-hour support zone)
Aggressive SL: Below the breakout candle low
Choose based on your risk appetite.
📉 SELL SETUP – Breakdown Below 30-Minute Candle
Idea: Sell only if price shows weakness and breaks the 30-minute candle low.
🔹 Sell Conditions
Sell Below: $4,173
Condition: Price must break and close below the 30-min candle low at $4,173.
Enter after confirmation candle retests or continues downward.
🎯 Sell Targets
TP1: $4,160
TP2: $4,148
TP3: $4,135
🛡️ Stoploss (SL) for Sell
Conservative SL: Above $4,182
Aggressive SL: Above the breakdown candle high
📌 Risk Management Notes
Never trade without SL.
Follow proper position sizing (1–2% of account per trade).
Always wait for candle close confirmation to avoid false breakouts.
Trail your SL as each target hits to lock profits.
Avoid trading news minutes unless your strategy allows volatility.
⚠️ DISCLAIMER
This is not financial advice.
This trade plan is for educational and informational purposes only.
Trading involves substantial risk of loss, especially in leveraged markets.
Always do your own analysis and consult your financial advisor before making any trading decisions.

Gold Analysis & Trading Strategy | December 11-12✅ 4H Chart (H4) Trend Analysis
1️⃣ A strong bullish candle breaks multiple resistance levels
Gold surged out of the previous consolidation range with a powerful bullish candle, breaking through the 4247–4250 resistance zone and reaching a high of 4281.
This shows strong participation from major buyers and clearly strengthened bullish momentum.
2️⃣ Moving averages in full bullish alignment
Short-term MAs (MA5/MA10) are sharply turning upward, with price holding firmly above them.
MA20 (around 4210) now acts as an important pullback support.
As long as price stays above MA5/MA10, the structure remains strongly bullish.
3️⃣ Bollinger Bands expanding upward, indicating a trending market
Price broke above the upper band and is riding along it — a typical signal of a strong continuation trend.
→ Upside momentum still has room to extend.
📌 H4 Conclusion:
Gold has broken key resistance and shifted into a strong uptrend.
Pullbacks toward 4250–4260 are normal corrections; if support holds, the bullish trend is expected to continue.
📊 1H Chart (H1) Trend Analysis
1️⃣ Multiple strong bullish candles followed by high-level consolidation
After breaking resistance, price is consolidating within 4270–4280, forming a high-level range.
This consolidation is considered a bullish continuation pattern, not a topping signal.
2️⃣ Strong short-term support from MA5/MA10
The moving averages form a clear bullish staircase structure:
MA5 support near 4268
MA10 support near 4258
As long as price stays above MA10, the short-term trend remains intact.
3️⃣ Bollinger upper band rising — bullish momentum intact
The upper band continues to move higher, showing that momentum has not weakened.
A break above 4281 may trigger another upward extension.
📌 H1 Conclusion:
The short-term structure is strongly bullish.
Key support sits at 4260–4250; holding this zone keeps the trend intact.
🔴 Resistance Levels
4281 (recent high)
4290–4300 (psychological + structural resistance)
4315 (extension target)
🟢 Support Levels
4268–4260 (MA5/MA10 on the 1H chart)
4250 (previous resistance turned support)
4210–4205 (H4 key structural support)
📌 Trading Strategy Suggestion
🔰 1. Buy on Pullback (Main Strategy)
📍 Consider buying near 4260–4250
🎯 Targets: 4281 / 4290 / 4300
⛔ Stop-loss: below 4244
Why:
Strong uptrend intact
Pullback to support offers a better entry
MAs + Bollinger Bands both support bullish continuation
🔰 2. Breakout Buying (Secondary Strategy)
📍 If price breaks above 4281, you may consider a light breakout entry
🎯 Targets: 4295 / 4310
⛔ Stop-loss: below 4270
Why:
High-level consolidation → bullish accumulation
Breakout often leads to a momentum-driven extension
📌 Summary
Gold is currently in a strong bullish trend:
H4: Breakout of major resistance → uptrend confirmed
H1: High-level consolidation → preparing for another push upward
As long as 4250–4260 holds,
the short-term outlook remains bullish, with buy-the-dip as the preferred strategy.

Gold sell target as per your return you want so im selling this selling gold right away so can get some targets
becuase its pre LDN sell off so taking a 1.5% risk of capital

XAUUSD Short | 15m |Gold revisited the upper band of the intraday structure and showed clear signs of weakening momentum. Price failed to sustain above the model’s trailing zone, indicating a shift from short-term accumulation to distribution.
The short entry was executed as price broke back below the cloud, supported by a clean loss of intrabalance strength.
Stop is placed above the most recent structural failure.
Primary target sits near the liquidity cluster around 4175.

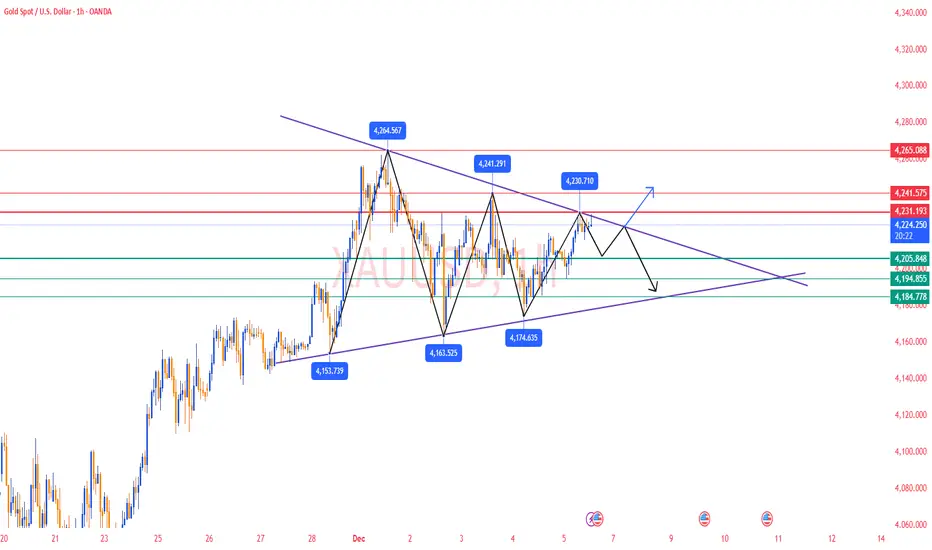
Gold Analysis & Trading Strategy | December 5✅ 4H Chart Trend Analysis
1️⃣ Lower rebound highs, weakening bullish momentum
Highs are stepping down from 4264.62 → 4241.55 → 4230, showing repeated rejection and forming an early descending high structure at the top.
2️⃣ Bollinger Middle Band as strong resistance
Current rebound is capped around 4227 mid-band
➡️ If price continues to fail breaking above → mid-term remains in consolidation
3️⃣ Moving averages indicate weak recovery
MA5 & MA10 are turning upward, but MA20 is flat
➡️ This suggests rebound = correction, not reversal
If price fails to break 4241–4245, strong bullish momentum will not be restored.
✅ 1H Chart Trend Analysis
1️⃣ Consecutive closes below 4227 with long upper shadows
➡ Bullish profit-taking at high levels
➡ Clear overhead selling pressure
2️⃣ Short-term MAs converging
MA5 / MA10 / MA20 are compressing together
➡ Momentum weakening → entering sideways consolidation
3️⃣ Bollinger Bands turning sideways
Price failing to ride the upper band → easy to shift into pullback mode
🔴 Resistance Levels :4227–4230 / 4240–4245
🟢 Support Levels:4205–4208 / 4185–4180
✅Trading Strategy Reference
🔰 Main Strategy: Sell the Rebound
📍Entry Zone: 4225–4230
🎯Targets: 4210 / 4195 / 4185
⛔Stop-loss: Above 4235
🔰 Secondary Strategy: Buy the Dip
📍If 4205–4208 holds, consider light longs
🎯Targets: 4220 / 4227
⛔Stop-loss: Below 4198
📌 Trend Summary
1️⃣ If 4205 breaks with strong selling volume → downside targets: 4188 / 4163
2️⃣ If price stabilizes above 4227 with bullish volume →
Bulls regain control → target 4245+
🎯 Key focus: Whether the 4205–4208 support zone remains intact
🔥Trading Reminder: Trading strategies are time-sensitive, and market conditions can change rapidly. Please adjust your trading plan based on real-time market conditions.
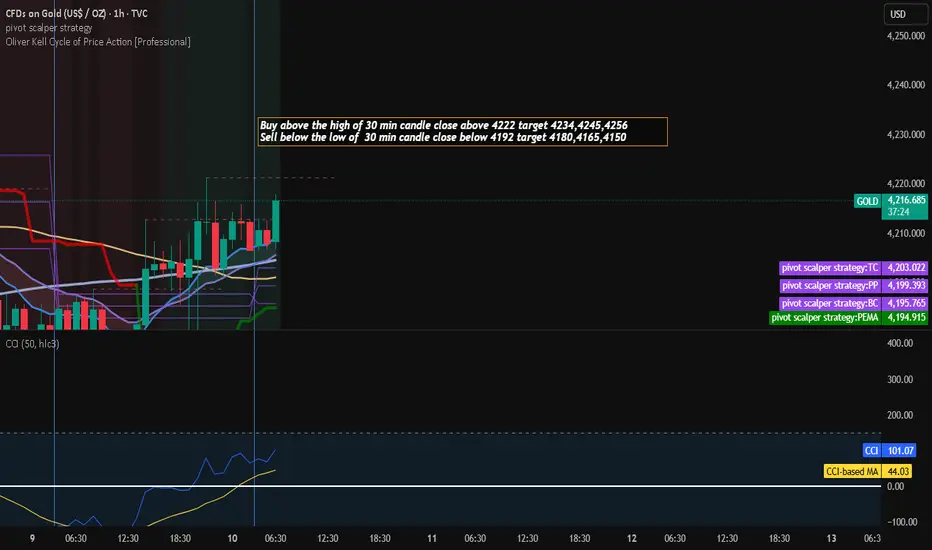
Gold Trading Strategy for 10th December 2025📊 GOLD INTRADAY TRADE SETUP (30-MIN STRATEGY)
🟢 BUY SETUP (Long Trade)
Trigger:
✔️ Enter ONLY if a 30-minute candle closes ABOVE 4222
✔️ Buy above the high of that breakout candle
🎯 Targets:
TP1: 4234
TP2: 4245
TP3: 4256
🛡️ Stop-Loss Suggestion:
Below the breakout candle low
Or place SL around 4210 (example; adjust based on your analysis)
📌 Notes:
Confirm breakout strength using volume or momentum indicators (e.g., RSI > 55).
Avoid buying if price breaks above 4222 but closes back below it (fakeout).
🔻 SELL SETUP (Short Trade)
Trigger:
✔️ Enter ONLY if a 30-minute candle closes BELOW 4192
✔️ Sell below the low of that breakdown candle
🎯 Targets:
TP1: 4180
TP2: 4165
TP3: 4150
🛡️ Stop-Loss Suggestion:
Above the breakdown candle high
Or place SL around 4205 (example; based on volatility)
📌 Notes:
Confirm breakdown strength with volume or RSI < 45.
Be cautious during sudden reversals or news events.
⚠️ RISK MANAGEMENT (Highly Recommended)
🧮 Risk per trade: 1–2% of your capital maximum
🎯 Follow target-to-stop ratio minimum 1:2 for quality trades
🕒 Avoid trading during high-impact news (US data, Fed events, etc.)
📉 Do NOT trade sideways 30-min candles—wait for real breakout or breakdown.
📝 DISCLAIMER
⚠️ This analysis is for educational and informational purposes only. It is not investment advice or a recommendation to buy or sell any financial instrument. Trading in gold or any market involves significant risk. Please consult with your financial advisor before taking any trades. You are responsible for your own trading decisions.
XAUUSD/GOLD JOLTS Job Openings News Projection 09.12.25Main Idea
Gold is currently ranging between 4,191 – 4,210 zones.
During JOLTS news volatility, price may either break upward or break downward from this zone.
Your plan is a breakout + retest entry with a 1:3 Risk–Reward Ratio.
🟢 Bullish Scenario (Buy Setup)
Conditions to Buy:
Price breaks above 4,210 zone
Retests the same zone and holds as support
Enter after bullish confirmation
Target:
4,250 zone
Stoploss:
Below 4,191 zone
🔴 Bearish Scenario (Sell Setup)
Conditions to Sell:
Price breaks below 4,191 zone
Retests the level as resistance
Enter after bearish confirmation
Target:
4,163 zone
Stoploss:
Above 4,210 zone
🎯 Risk–Reward Ratio: 1:3
Both setups aim for a low-risk and high-reward breakout trade using news momentum.

Gold Weekly Trend: XAU/USD Ready to SurgeGold Weekly Trend: XAU/USD Ready to Surge
Gold closes the week with a steady bullish profile, maintaining a structure that reflects strong positioning from larger market participants. The weekly flow shows a market that continues to rotate upward through liquidity pockets while holding firm during corrective phases.
This week’s behavior indicates that buyers remain active on every controlled retracement, keeping the overall structure balanced and directional. The price continues to move in a sequence of expansion → stabilisation → renewed expansion, which is a common pattern when the market is preparing for sustained upside development.
Underlying order flow suggests that Gold is still within a broad accumulation cycle at higher levels, where the market repeatedly absorbs sell-side attempts and transitions back into bullish pressure. The consistency of this pattern signals confidence from long-term participants and reduces the probability of a structural shift at this stage.
As the week closes, the overall environment remains favorable for continued appreciation. Price is advancing in a measured, orderly fashion rather than showing signs of exhaustion. This steady progression typically precedes multi-week continuation phases, especially when liquidity objectives remain active above current trading levels.

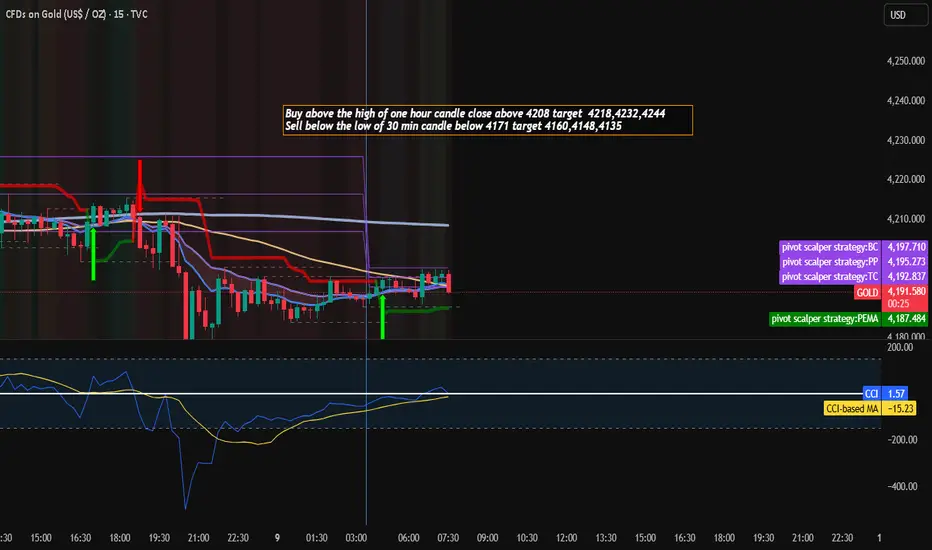
Gold Trading Strategy for 09th December 2025🟡 GOLD ($XAU/USD) TRADING PLAN
📈 BUY SETUP (LONG)
Condition:
Go long above the high of a 1-hour candle closing above $4208.
✔️ Entry Trigger
Wait for a 1H candle to close above $4208.
After the close, place a buy stop order slightly above the candle high to confirm momentum.
🎯 Targets
TP1: $4218
TP2: $4232
TP3: $4244
🛡️ Suggested Stop-Loss
Below the breakout candle low (ex: $4196–$4190 depending on candle size).
Maintain at least 1:1.5 RR for safety.
📊 Trade Logic
Breakout of $4208 confirms bullish strength.
Above this zone, the market has clean upside liquidity towards the 4218/4232/4244 levels.
📉 SELL SETUP (SHORT)
Condition:
Go short below the low of a 30-minute candle breaking below $4171.
✔️ Entry Trigger
Wait for a 30-min candle to close below $4171.
Set a sell stop order slightly below the candle low to avoid fakeouts.
🎯 Targets
TP1: $4160
TP2: $4148
TP3: $4135
🛡️ Suggested Stop-Loss
Above the breakdown candle high (ex: $4182–$4188 depending on 30m candle size).
📊 Trade Logic
Breakdown below $4171 signals bearish continuation.
Space to fall cleanly up to 4160/4148/4135 liquidity levels.
🔄 TRADE MANAGEMENT TIPS
🕒 Check for major news before trades (e.g., FOMC, CPI, NFP).
🧩 Use trailing stop once TP1 hits.
📉 Avoid trading in low-volume hours.
📏 Maintain consistent position sizing (risk 1–2% max per trade).
⚠️ DISCLAIMER
This is not financial advice.
Trading Gold ($XAU/USD) or any financial instrument involves significant risk.
Always do your own research, manage your risk, and trade only with money you can afford to lose.
Price hits FVG: Get ready for Market Maker's next move!In the current market context, the price structure is clearly showing the regulation of Smart Money as it continuously creates new liquidity zones, breaks structures, and leaves important footprints like OB – FVG – BOS. Below is a trading plan built based on the observed price zones on the chart:
🟥 1. Market Context – Role of OB Sell
Price has reacted strongly at the Order Block Sell in the 4,237 – 4,256 zone.
This is where a strong push down occurred (accompanied by a structure break – BOS), confirming this as an active supply zone.
➡️ This will be the key level to monitor all pullbacks in the coming time.
🟩 2. Current Market Structure – Market Structure
After the OB Sell is activated, the market creates a bearish BOS.
Price is moving down to approach the Liquidity Buy below in the 4,154 – 4,161 zone.
On the way, price leaves a Fair Value Gap (FVG) – a zone that can be used as a retracement point to continue selling.
➡️ Overall bias: Bearish intraday – favor sell on pullback.
🟨 3. Main Trading Plan – SELL SETUP
🎯 Area of Interest
FVG: 4,197 – 4,214
This is the ideal price zone for price to return to balance before continuing the downtrend.
📌 Entry SELL:
Preferred scenario: Price retraces to fill FVG → reacts → creates a small bearish structure (BOS M1–M5) → Sell.
🎯 Targets:
TP1: 4,170 — intermediate support zone
TP2: Liquidity Buy: 4,154 – 4,161
TP3 (extended): 4,144 if liquidity below continues to be swept
🛑 Stop Loss:
Above the FVG peak or above the nearest OB zone: 4,214 – 4,227
➡️ High probability when price fails to break 4,214–4,227 and continues to create lower highs.
🟦 4. Secondary Scenario – SHORT-TERM BUY (Countertrend)
Only activated when price hits Liquidity Buy and a clear reversal signal appears:
📌 Entry BUY:
After sweeping liquidity in the 4,154–4,161 zone
Wait for bullish BOS confirmation on a lower timeframe
🎯 Targets:
4,184
4,197
4,214 (maximum – hit FVG and exit)
➡️ This is just a retracement trade, not trend-following, so risk management is crucial.
⭐ 5. Summary View
The market is moving in line with Smart Money behavior:
Sweep liquidity above (Sell-side Liquidity) → Create OB → Push price down
Leave FVG → Attract price back → Continue distribution
Main goal: Sweep Liquidity below
👉 The main trend remains SELL until the Liquidity Buy below is hit and a strong reversal structure is created.

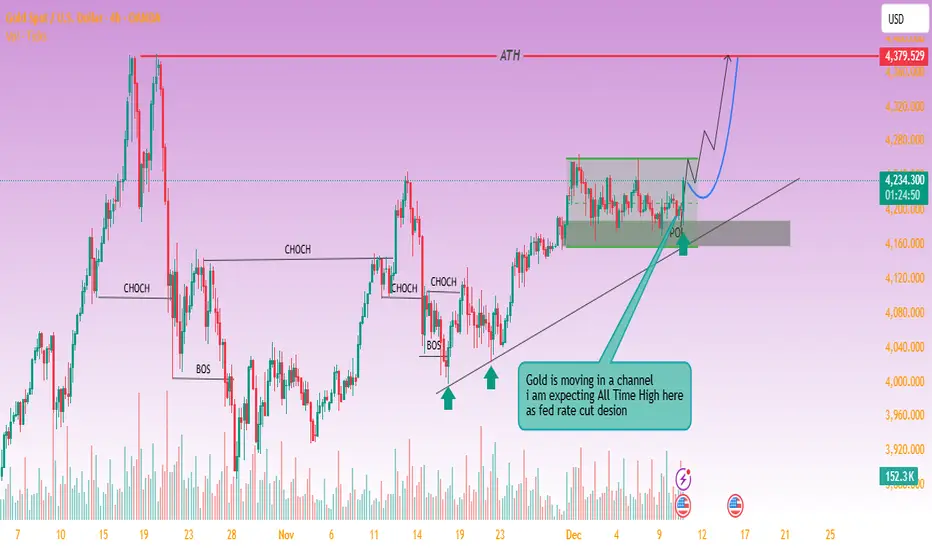
Gold Looks Prime for All-Time High Breakout📈 Technical Analysis of the Chart
The chart shows XAU/USD (Gold vs. USD) moving in what appears to be an upward-sloping channel — higher lows are marked by trend-line support.
Price recently revisited the lower boundary (support zone + trendline) and appears to have held firm — a bullish signal (i.e. a “retest & bounce”).
The annotation “POI” (Point of Interest) near that bounce suggests a probable pivot from support → initiating the next leg up.
On the upside, the chart projects a move toward a new all-time high (ATH) — the red horizontal line — implying a breakout of the current consolidation zone.
If gold breaks above current resistance and stays above the channel’s upper boundary, that increase could accelerate with bullish momentum. This aligns with typical breakout + retest strategies often used in gold trading.
Conversely, if price fails to hold this support zone and drops below the trendline, the bullish setup would be invalidated — a risk to watch, especially if sentiment shifts.
Technical conclusion: The chart shows a classic channel-retest setup — if upward momentum continues, a move toward the all-time high is well justified. The current bounce from support provides a favorable entry setup for bulls, with manageable risk if a stop-loss is set just below the channel support.
🌍 Fundamental & Macro Context
Gold’s recent strength is driven by expectations of lower interest rates: as a non-yielding asset, gold tends to benefit when rates fall because the opportunity cost of holding gold decreases.
A weaker U.S. dollar — often accompanying potential rate cuts — makes gold cheaper for foreign buyers, adding further demand support.
Broad economic context: unsteady global growth, geopolitical uncertainty, and rising demand for safe-haven assets help maintain strong gold demand.
Market forecasts remain bullish: some analysts see gold reaching as high as $4,950/oz by 2026, with a more likely base-case target around $4,500/oz — assuming rate cuts and continued macroeconomic uncertainty.
That said, the key risk remains in a potential rebound of the U.S. Dollar or abrupt shift in monetary policy (e.g. fewer rate cuts than expected) — either could undercut gold’s rally.
Fundamental conclusion: The macro backdrop — rate-cut expectations, weak USD, and global uncertainty — strongly supports a continuation of gold’s upward trajectory. If these tailwinds persist, gold’s push toward new highs is fundamentally justified.
✅ What This Setup Means & What to Watch
If bullish scenario plays out
Expect price to challenge the all-time high. A breakout may target or even exceed prior ATHs.
A bounce-and-run scenario may attract momentum traders, fueling further upside.
Key triggers to monitor
Keep an eye on announcements from Federal Reserve: rate-cut decisions or dovish signals accelerate gold demand.
Watch USD strength: a strong dollar could cap gains or reverse the uptrend.
Monitor global risk sentiment — geopolitical events or economic slowdown fears tend to push money into gold.
Risk control considerations
Use the channel support / trendline as a stop-loss anchor. A breakdown below could invalidate the bullish bias.
Consider that strong moves in the dollar or surprising inflation data might compress gold’s upside or spark a pullback.
XAUUSD/GOLD 1H BUY PROJECTION 10.12.25“Character Invalid Here” (Lower Pink Zone)
This zone represents heavy sell pressure.
Price dropped deeply here → buyers were weak → sellers dominated.
From this area, the market started recovering upward slowly.
2️⃣ Day High as Resistance R1 (Middle Pink Zone)
This is a strong resistance level.
Price tested this zone multiple times and faced rejection.
This confirms it as a key intraday resistance.
Once price breaks and retests this area, bullish confirmation becomes stronger.
3️⃣ Bounce Back Area (Green Horizontal Zone)
This area is where you expect the pullback (retracement) to happen.
When price returns to this zone:
✔ Buyers re-enter the market
✔ Trend continues upward
✔ You get safe entry confirmation
This is a high-probability buy zone.
4️⃣ Entry After Bounce Back (Red Zone)
This is the ideal buy entry area after confirmation.
Your structure shows:
Price breaks the resistance
Pulls back for retest
Holds the major trendline
Respects the curved support (cup structure)
This indicates a strong bullish continuation setup.
5️⃣ Target Price (Weekly High Resistance & TP)
This is the weekly high, which acts as the final target.
The price is expected to reach this level due to:
Strong bullish momentum
Breakout + retest confirmation
Trendline support
Clean upside liquidity
This is a realistic and high-probability target.

Gold Trading Strategy for 11th December 2025🟡 GOLD Trading Plan (Intraday Strategy)
📈 BUY Setup (Bullish Scenario)
Entry: Buy above the High of the 1-Hour candle after a confirmed close above $4251.
Targets:
🎯 TP1: $4262
🎯 TP2: $4273
🎯 TP3: $4284
Suggested Notes:
Wait for a strong bullish candle close above $4251 to confirm momentum.
Volume confirmation adds extra confidence.
Use a trailing SL once TP1 is hit to lock in profits.
📉 SELL Setup (Bearish Scenario)
Entry: Sell below the Low of the 1-Hour candle after a confirmed close below $4206.
Targets:
🎯 TP1: $4195
🎯 TP2: $4183
🎯 TP3: $4170
Suggested Notes:
Ensure a strong bearish close below $4206 before entering.
Watch for breakdown retests—these offer safer entries.
Once TP1 is achieved, move SL to cost or trail for safety.
🧭 Risk Management
🛑 Always place a stop-loss based on the candle structure (above resistance for sells / below support for buys).
📊 Avoid over-leveraging; risk only 1–2% of your capital per trade.
⏳ Stick to the 1-hour timeframe—don't enter early on lower timeframes.
⚠️ Disclaimer
This analysis is for educational and informational purposes only.
It is not financial advice or a guaranteed profit method.
Trading involves significant risk, and you should consult your financial advisor before taking any trade.

XAUSD/GOLD 4H SELL PROJECTION 07.12.251. Major Rejection Zone
Price tapped into the Huge Liquidity Collection Zone (yellow zone).
Strong rejection with bearish candlestick formations (Engulfing + Spinning Top).
2. Pattern Confirmation
Double Top formation at Resistance R1–R2.
Neckline broken and candle closed below – confirming trend reversal.
Break of a major triangle pattern also supports bearish continuation.
3. Entry Zone
Entry marked at 4,207.97 zone after retest and bearish confirmation.
Confluence with:
Resistance Rejection
Structure Break
Bearish candle patterns
4. Stop Loss (SL)
SL placed at 4,243.17, above the wick and liquidity grab zone.
5. Take Profit (TP)
Targeting Premium Zone around 4,146.62.
Risk–Reward Ratio: 1 : 2
🎯 Final Sell Projection
Expecting price to drop towards 4,146–4,150 zone after rejection from liquidity and break of structure.
Bearish candlestick confirmation increases probability of continuation move.

XAUUSD GOLD Analysis on (11/12/2025)#XAUUSD UPDATEDE
Current price - 4213
If price stay below 4240, then next target 4190,4162 and 4146 above that 4270
Plan;If price break 4214-4218 area, and stay below 4214, we will place sell order in gold with target of 4190,4162 and 4146 & stop loss should be placed at 4270

Price action series-The 2B Pattern Failed Breakout Reversal...Continuing the price action series with a pattern that appears at every major turning point in the market: the 2B Pattern, also known as the failed breakout reversal.
It forms when price breaks a previous high or low but fails to follow through and immediately returns back inside the prior range. This shift reveals exhaustion in the prevailing trend and exposes trapped traders on the wrong side.
Below are two real examples from Gold and dxy showing both the bullish and bearish version of the pattern.
Bullish 2B Pattern – Bottom Formation Left Chart
A 2B bottom occurs when price breaks below a previous swing low but cannot sustain the breakdown.
In the chart on the left:
Price takes out the prior low, triggering new short positions and stop-losses.
The breakdown immediately fails as price snaps back above that previous low.
This reclaim signals that the downward continuation attempt has failed.
The shift in pressure initiates a new upward move, confirming the reversal.
This is a classic 2B bottom structure: a failed breakdown followed by a strong reclaim.
Bearish 2B Pattern – Top Formation Right Chart
A 2B top occurs when price breaks above a previous swing high but fails to extend higher.
In the chart on the right:
Price pushes through the earlier swing high, inviting breakout buying.
Momentum fades almost instantly, and price falls back below the prior high.
This failure indicates buyers have lost control and the breakout has trapped late entries.
Price then shifts downward, validating the failed breakout.
This is the mirror image of the 2B bottom, but occurring at a swing high.
Why the 2B Pattern Works
A trend remains intact as long as it continues to produce new highs or lows.
A failed attempt to continue the trend shows:
exhaustion in momentum
absorption of breakout orders
trapped traders exiting
the beginning of a directional shift
The 2B identifies this shift before the full trend reversal is completed, making it an early but reliable reversal model.
Where This Pattern Performs Best
15m and 1H for intraday reversals after volatility spikes
4H for swing-trade reversals and cleaner structure
Daily for major tops and bottoms
Around key levels such as previous highs, lows, or liquidity zones
The pattern is especially common in Gold due to its volatile but structured movement.
Summary
2B Bottom failed breakdown
2B Top failed breakout
Works by showing loss of continuation and a shift in order flow
Ideal for identifying early reversals without predicting tops or bottoms
Sharing this purely for educational purposes as part of the Price Action Pattern Series.
More patterns will be published in the next parts of this series. Trade safe

Gold Hits Buy Zone – Wait! Here's What to Confirm…◆ Market Context
On the M30 chart, the market shows a shift from a downtrend to a short-term recovery phase after forming BOS and CHoCH at the nearest bottoms. However, the upward movement has hit a prolonged downtrend line and reacted sharply downward again. This indicates that the trendline and upper resistance zone still maintain significant selling pressure.
◆ SMC & Price Action
• After breaking the upward BOS, the price made a strong push to 4,219 but couldn't sustain it, forming a downward reaction at the trendline and resistance zone.
• The Resistance Zone 4,211 – 4,219 has been confirmed by multiple price rejections.
• Currently, the market is adjusting to the Buy Support – Fibo – iFvG zone around 4,192. This is the first short-term support zone to test the buying momentum.
• If this zone doesn't hold, the price may return to the deeper liquidity zone 4,173 – where a large number of buyers' stop-losses are concentrated.
◆ Important Price Zones
Resistance (selling zone):
• 4,211
• 4,219
Short-term support:
• 4,192 (Fibo + iFvG + small OB)
Deeper support – Liquidity Pool:
• 4,173 (target zone if 4,192 support is broken)
◆ Main Trading Scenarios
➤ Scenario 1: Price holds at 4,192
• Wait for reversal signals at the support zone
• Recovery targets:
▪ 4,211
▪ 4,219
• If 4,219 is broken → the price may extend to a higher zone, but there is currently no confirmation signal for this.
➤ Scenario 2: Price breaks 4,192 support
• Short-term upward structure invalidated
• Prioritize following the downtrend
• Next targets:
▪ 4,173
▪ monitor liquidity reactions in this area to identify subsequent buying opportunities
➤ Scenario 3: Retrace to resistance for further selling
If the price retraces to 4,211 – 4,219 but doesn't break:
• Monitor rejection patterns
• This is a suitable zone to continue the downward movement following the main flow
◆ Summary
• The main trend still leans towards a decline, with the downtrend line in control.
• The 4,192 zone is a crucial reaction point to determine if buyers still have enough strength.
• If 4,192 is lost, the market is likely to seek liquidity at 4,173.
• If 4,192 holds, the price may recover to 4,211 – 4,219 before determining the next direction.

XAUUSD – 11/12: After major news, only trade at liquidity zones XAUUSD – 11/12: After major news, only trade at liquidity zones
Yesterday’s strong news release means today the market has no clear direction.
In this situation, I don’t try to predict direction — I only focus on two key liquidity zones:
Sell timing zone around 4.219
Buy OB zone around 4.197–4.194
The Asian session showed selling pressure, but the larger trend hasn't changed.
So the plan is: short-term sells – buy at strong support, not all-in one direction.
🎯 Scenario 1 – Timing SELL at 4.219 (for experienced traders only)
Sell zone: around 4.219
Important: This is a timing entry, NOT a pending limit order.
Allowed deviation: ~2 pips.
If ideal timing is 4.219 but you see price already hit 4.221 → skip, don’t chase.
TP reference: at least 15 pips, e.g. 4.204–4.203 or lower depending on entry.
Idea:
4.219 is an upper liquidity zone where FOMO buy orders tend to cluster.
If price sweeps above and weakens, I take a short-term sell following Asian session selling momentum.
Targets are intraday only — no long holding.
⭐️ Scenario 2 – BUY at OB 4.197–4.194
Buy zone: 4.197 – 4.194
Setup invalid if: price breaks below 4.191 and holds there
TP: At least 15+ pips, e.g. 4.209–4.212 depending on entry.
Why this zone?
4.197–4.194 is a clean bullish order block where strong buying previously pushed price up.
If price retraces here and shows good reaction (wick rejection, rising buy volume), I treat it as a chance to rebuild long positions with good R:R.
1️⃣ Market fundamentals & sentiment
After a strong rally, gold bulls are becoming more cautious.
Main reason: uncertainty over the speed of Fed rate cuts next year.
Everyone expects cuts — but no one knows how fast, how many, or when exactly.
As a result, gold is no longer trending straight upward; it is now trading in a wider, jumpy range around the highs.
So instead of trying to catch a long trend today, I focus on liquidity zones and price reactions.
2️⃣ Plan & discipline
Do NOT enter trades around 4.20x.
Only act at:
Timing Sell 4.219 (±2 pips — if missed, skip)
Buy OB 4.197–4.194 (invalid below 4.191)
Risk per trade: 1–2% max, no holding when invalidated.
If price breaks both zones and trends strongly (due to new data), I stay out and wait for clearer structure.
👉 Above 4.219 → only look for SELL timing
👉 Between 4.197–4.194 → look for BUY
👉 Below 4.191 → cancel buy setup and wait

Weekly analysis Gold Multi RnR sell and Buy scenarioThis is weekly analysis of gold providing detailed analysis and educational topics i.e. ICT, Price action, support and resistance etc.
Note – if you liked this analysis, please boost the idea so that other can also get benefit of it.
Also follow me for notification for incoming ideas.
Also Feel free to comment if you have any input to share.
Join me on live stream for real time update.
Disclaimer: This analysis is for educational purposes only and does not constitute investment advice. Please do your own research (DYOR) and check with your financial advisor before making any trading decisions.

SMC TRADING PLAN – XAUUSD (1H)1. Market Context
Observing the chart shows:
The price is moving in a short-term downtrend, indicated by the downtrend line that has been tested multiple times but not decisively broken.
Twice the price touched the trendline, it created a strong reaction → confirming this as a dynamic resistance zone.
The market has created MSS (Market Structure Shift) at both the top and bottom → indicating a transition phase, suitable for scalping trades at reaction zones.
The price levels you marked (4,230 – 4,219 – 4,192 – 4,181) are indeed potential liquidity pools / order blocks.
2. Main Trend & Smart Money Intentions
✔ What is Smart Money doing?
Attracting liquidity below around the 4,158 – 4,160 area (noted as “Liquidity” on the chart).
Pushing the price up to retest resistance around the trendline to hunt the liquidity of the Long side at the top.
Then bringing the price to a deeper discount area → then deciding to push up to break or continue distributing.
That is: Short-term Buy – Short-term Sell – then stronger Buy at the liquidity bottom
→ This is the standard Liquidity Hunt – MSS – Reversal model in SMC.
3. Two Main Scenarios
Scenario 1 – SELL from resistance (priority)
The price is approaching the trendline and resistance area you marked. This is a high-probability setup.
Ideal SELL zone:
📍 4,219 – 4,221 (reaction zone + FVG + Trendline retest)
Scalping target:
TP1 → 4,192
TP2 → 4,181
If a strong break: extend to 4,160 – 4,158 (main liquidity area)
Stoploss: 4,230.7 (above the liquidity sweep area)
Reason for SELL
Touching the downtrend line → strong technical reaction.
This is the Premium zone of the upward move.
Likely to form a short-term distribution before pushing down to hunt liquidity.
Scenario 2 – BUY from liquidity zone (secondary priority)
If the price dives down to take liquidity first, prioritize Buy at the bottom zone.
Strong BUY zone (Liquidity Zone):
📍 4,160 – 4,158
→ This is the bottom marked by Smart Money to hunt stoploss & create a new bottom.
Target:
TP1 → 4,181
TP2 → 4,192
TP3 → 4,219 – 4,230 (expecting to push the price to take top liquidity)
Stoploss: 4,146
Reason for BUY
Clear liquidity zone, created by the previous low bottom.
Coincides with the lower trendline.
Two previous MSS indicate the market is in an accumulation phase for a short-term reversal.
4. Detailed Trading Plan
🎯 SELL Setup – Quick Scalp (priority)
Entry: 4,219 – 4,221
SL: 4,230
TP:
TP1: 4,192
TP2: 4,181
TP3: 4,160 (if price breaks down)
High probability because: trendline reaction + premium zone + liquidity build-up.
🎯 BUY Setup – Safe (wait for price to hunt down)
Entry: 4,160 – 4,158
SL: 4,146
TP:
TP1: 4,181
TP2: 4,192
TP3: 4,219 – 4,230
High probability because: main liquidity zone + discount zone + potential for smart money to push up from the bottom.
5. Trading Advice
Only take orders when there is a clear reaction: wick rejection, minor structure break on M5.
Do not enter orders in the middle of the zone – only trade when the price hits the key level.
Scalping should prioritize quick TP because gold's range is quite strong.
📌 Conclusion
Your chart gives very clear signals according to SMC:
SELL at Premium – Buy at Discount – all revolving around liquidity hunt & MSS.
Two trading zones have been extremely clearly identified:
✔ SELL Zone: 4,219 – 4,221
✔ BUY Zone: 4,160 – 4,158

XAUUSD Long IdeaExpecting XAUUSD to move toward the 4220 area, with a risk-to-reward ratio of 1:1.5.The stop-loss should be placed strictly below 4170, and the target is 4222.Please ensure you conduct your own research before entering any trades.
