Gold Technical Analysis and OutlookGold Technical Analysis and Outlook: Fluctuating Upwards Ahead of the Interest Rate Decision, Beware of a Rally and a Rebound
Fundamental Analysis
This week's Federal Reserve interest rate decision will be announced. The outcome will have a decisive impact on the future of gold:
A 25 basis point rate cut is expected to trigger a direct decline in gold prices.
A 50 basis point cut, exceeding expectations, could push gold prices back down after a surge.
Market sentiment is cautious ahead of the decision, and volatility may narrow.
Technical Analysis
Yesterday's Market Review
Gold's early-week trend was fully in line with expectations, with a continuation of high-level fluctuations.
It dipped to 3626 in the morning (4 dollars below the 3630 support level) before quickly recovering. The inverted hammer pattern on the hourly chart clearly signals a rebound.
It continued to consolidate during the European trading session. Maintaining the volatile trend at the end of last week.
After breaking through the 3656-57 resistance level, the US market accelerated upward, reaching a new high of 3685.
Key Technical Signals
Breakout Confirmation Signal: A large bullish candlestick on the hourly chart breaks through the trendline resistance level, followed by a pullback to confirm support.
Accurate Pullback: The 5-minute chart shows a breakout above 3656 followed by a pullback to 3654-55 (the bottom of the last large bullish candlestick), creating a standard second entry opportunity.
Strong Early Morning Close: The US market closed at a high level after a strong performance, indicating continued upward momentum the following morning.
Key Level Update
Support Level: 3630 (the recent rebound of 6 1.8% golden ratio level)
Resistance levels: 3700, 3750 (extreme target)
Subsequent strategic layout
Short-term trading strategy
Long positions: Morning long positions at 3682-83 can be held, with the target at 3700.
Increase position strategy: Consider increasing positions in batches if the price falls back to the 3655-60 range.
Risk management tips: Execute stop-loss orders decisively if the price breaks below the 3630 support level, turning short-term bearish.
Medium-term strategy
Pre-interest rate decision: Maintain the 3700-3750 target range and gradually reduce long positions.
Post-decision strategy:
25 basis point rate cut: Direct Short Position
50 basis point rate cut: Short position after a surge
Target: 3600-3580 area is the primary target during the pullback phase.
Trading Alert
Market liquidity may decrease and volatility may increase before Thursday's interest rate decision.
Avoid chasing highs, especially long positions above 3700.
Manage your positions carefully and reserve funds to mitigate market volatility after the decision.
Pay close attention to the forward-looking guidance and dot plot changes in the decision statement.
Risk Warning: The above analysis is based on current market conditions. Investors are advised to strictly manage risk and allocate positions appropriately based on their risk tolerance.
GOLDCFD trade ideas

Elliott Wave Analysis XAUUSD – September 17, 2025
Momentum
• D1 timeframe: Momentum is currently rising. As of today, the upward move has lasted for 3–4 daily candles. Therefore, in the next 1–2 days, momentum is likely to enter the overbought zone.
• H4 timeframe: Momentum is in the oversold area and starting to reverse. Once confirmed, we can expect at least 4–5 bullish H4 candles.
• H1 timeframe: Momentum is already in the oversold zone and has turned upward, suggesting an immediate short-term rally.
Wave Structure
• D1 timeframe: Price is moving within black wave v. Since black wave iii was extended, black wave v is likely to be approximately equal in length to black wave i.
• H4 timeframe: Inside black wave v, we expect a 5-wave green structure to form. Currently, green wave 1 seems to have completed, and price is correcting within green wave 2.
• H1 timeframe: Within green wave 1, a 5-wave black structure has been completed. Price is now developing a corrective black ABC pattern.
Target zones for black wave C:
• Target 1: 3675
• Target 2: 3657
Note: Wave 2 usually retraces to the 0.618 Fibonacci level of wave 1, which coincides with the 3657 zone. This is the key level to consider for a buy setup.
Trading Plan
• Buy Zone: 3658 – 3655
• Stop Loss: 3645
• Take Profit (TP1): 3677

Gold Trading Strategy | September 16-17✅ From the 4-hour chart: Gold formed a high near 3703 and then pulled back, currently trading around 3688. The MA5 and MA10 are turning down, and the price has fallen back below the MA5, showing that short-term bullish momentum has weakened. The MA20 (around 3661) serves as a key support.
The upper Bollinger Band near 3705 is showing strong resistance, and the price has returned to oscillate around the mid-band, indicating that upward momentum is capped. The 4-hour chart suggests weakening bullish momentum, with a potential for consolidation and pullback.
✅ From the 1-hour chart: The MA5 and MA10 are turning downward, creating short-term pressure on the price, while the MA20 around 3687 is providing support.
Gold has broken below the middle Bollinger Band and is oscillating near the lower band, reflecting short-term weakness and the possibility of further testing support. The KDJ has formed a bearish crossover, and the MACD histogram has turned from red to green, showing that short-term bearish momentum is strengthening and there is risk of further downside.
🔴 Resistance levels: 3700–3705 / 3715–3730
🟢 Support levels: 3675–3665 / 3660–3655
📊 Trading Strategy Reference
🔻 Short Setup
● Entry: Sell in batches if gold rebounds to 3695–3700
● Target 1: 3680–3675
● Target 2: If broken, look further toward 3665
🔺 Long Setup
● Entry: Buy in batches if gold pulls back and stabilizes around 3670–3675
● Target 1: 3690–3695
● Target 2: If broken, look further toward 3700
🔥Trading Reminder: Trading strategies are time-sensitive, and market conditions can change rapidly. Please adjust your trading plan based on real-time market conditions. If you have any questions , feel free to contact me🤝

FED shaken by politics | Gold eyes new ATH🟡 XAU/USD – 16/09 | Captain Vincent ⚓
🔎 Captain’s Log – News Context
FED & US Politics :
S. Miran elected to the FED Board but still serves as Trump’s economic advisor → concerns FED may face White House influence.
Michelle Mills elected with a narrow 48–47 margin.
Appeals Court blocked Trump from firing L. Cook, affirming FED’s independence, but raising the risk of a legal battle at the Supreme Court.
US Economy :
6:30 AM (US time): Retail Sales release – key consumer spending indicator.
Probability of a -50bps FED cut this week is down to 1.2% , nearly ruled out. FED is almost certain to deliver -25bps next week.
⏩ Captain’s Summary : Politics create noise, but the macro backdrop (FED easing + weak US data) remains the tailwind supporting Gold’s journey toward new ATH.
📈 Captain’s Chart – Technical Analysis
Storm Breaker (Resistance / Sell Zone) :
3706 – 3714 (Fibonacci resistance)
3722 – 3724 (Strong Sell Zone, potential ATH test)
Golden Harbor (Support / Buy Zone) :
FVG Dock: 3666 – 3668
OB Harbor: 3643 – 3645
Strong Low: 3611 (deep support)
Market Structure :
After a series of BoS , Gold broke out of sideways EqH/EqL and surged.
Preferred scenario: retrace to FVG 3666 , then bounce toward 3714 – 3722.
If 3722 breaks successfully → confirms new ATH and extends bullish momentum.
🎯 Captain’s Map – Trade Plan
✅ Buy (priority)
Buy 1 (FVG)
Entry: 3666 – 3668
SL: 3657
TP: 3690 – 3706 – 3714 – 372x
Buy 2 (OB)
Entry: 3643 – 3645
SL: 3632
TP: 3666 – 3700 – 3714 – 372x
⚡ Sell (short scalp at resistance)
Sell Zone
Entry: 3722 – 3724
SL: 3732
TP: 3714 – 3706 – 3690
⚓ Captain’s Note
“The Golden ship has broken free from sideways waters and is heading toward new peaks. Golden Harbor 🏝️ (3666 – 3643) is the safe dock for sailors to gather strength before sailing further. Storm Breaker 🌊 (3722 – 3724) is the big wave, suitable only for short Quick Boarding 🚤 . With dovish winds from the FED, the Golden sails are set toward new ATH.”

LiamTrading – XAUUSD Strategy for TodayI would like to share my personal view on gold for the day.
The overall trend in XAUUSD continues to be very strong, with the price consistently making fresh highs over the past two weeks. Buying interest has remained steady across sessions, while any corrections have been short-lived, mostly visible on the M15–M30 timeframes.
Yesterday, gold broke out of the Pennant pattern on the upside and is now consolidating near 3,680. On the H4 chart, this level aligns with an important Fibonacci zone, providing further technical confirmation.
From an Elliott Wave perspective, I expect Wave 3 to conclude near 3,700, followed by a corrective Wave 4 towards 3,660 – a level which has acted as reliable support in the past. After that, gold may enter its final Wave 5, with the potential to move towards the 3,740+ region.
Trading setups for consideration:
Buy 3658 – 3656, SL 3651, TP 3674 – 3688 – 3700 – 3715 – 3730 – 3744
Sell 3697 – 3700, SL 3705, TP 3688 – 3672 – 3660 – 3650
Sell 3740 – 3744, SL 3748, TP will be decided based on the price structure at that time
Important levels to keep in focus: 3673 – 3663 – 3635 and 3721, as these zones may trigger price reactions and could be useful for intraday scalping opportunities.
This is my personal outlook on gold for today. I hope it will be helpful to fellow traders in making better trading decisions. Kindly share your feedback in the comments.

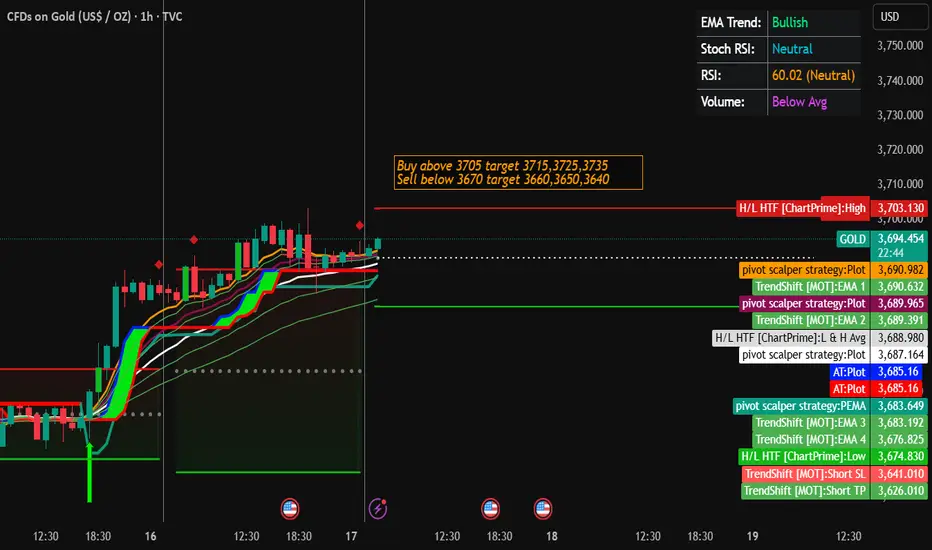
Gold Trading Strategy for 17th September 2025✨ GOLD TRADING STRATEGY ✨
📈 BUY Setup
➡️ Entry: Buy above the high of the 1-hour closing candle
🎯 Targets:
1st Target – 3715
2nd Target – 3725
3rd Target – 3735
📉 SELL Setup
➡️ Entry: Sell below the low of the 1-hour closing candle
🎯 Targets:
1st Target – 3660
2nd Target – 3650
3rd Target – 3640
⚠️ Disclaimer
📌 This is for educational and informational purposes only.
📌 Not a buy/sell recommendation.
📌 Trading in commodities, forex, or stock markets involves risk; please do your own research or consult with a financial advisor before taking positions.
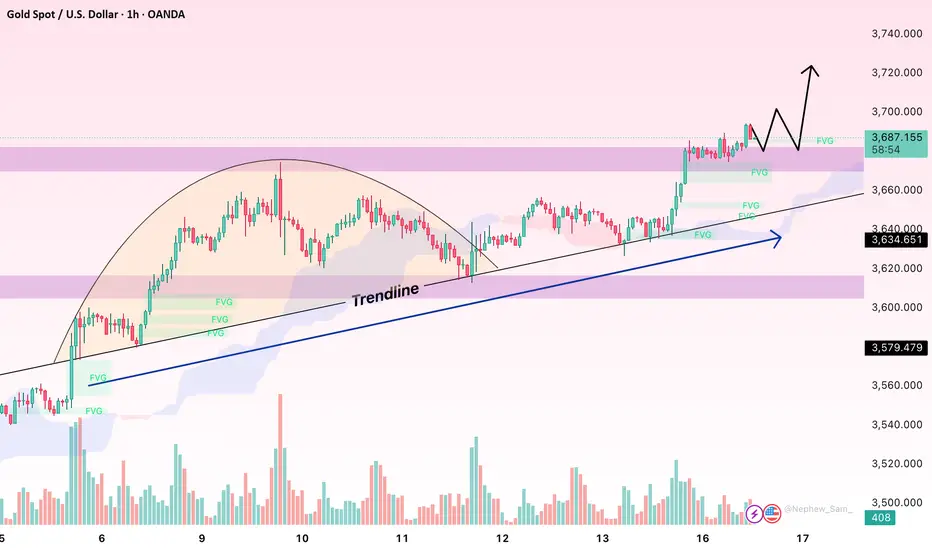
Wednesday's gold price target: 3750Wednesday's gold price target: 3750
As shown in Figure 1h:
The current converging fluctuation range of gold prices is clearly visible within the fan structure.
Gold prices have remained strong after breaking through.
We expect Thursday's interest rate cut to drive another surge in gold prices across the board.
Expected target: Around 3750 points.
Next, it's important to note that after all the positive news is released, gold prices will be cashed out at high levels, leading to profit-taking. This is likely to cause a waterfall-like decline in gold prices at the top.
Therefore, ordinary traders must remain cautious when buying with the trend.
Currently, the most effective way to profit is scalping, entering and exiting quickly, and setting reasonable stop-loss orders.
Trading Strategy:
Conservative:
BUY: 3675-3685
SL: 3660
TP: 3700-3750
Aggressive:
BUY: 3685-3690
SL: 3675
TP: 3700-3720-3750
Be cautious with short positions.

GOLD ANALYSIS IN 30MINHELLO,
there is high probability for gold to reach the 3713$ in few HOURS,
thanks

GOLD LONG IDEA AT BOTTOM 1400PIPS IN NONFARM
BUY GOLD 3314 +900PIPS
BUY GOLD 3344 +500PIPS
📊 Today’s Non-Farm Payrolls (NFP) – USD
Average Hourly Earnings m/m:
✅ 0.3% (same as forecast and previous).
→ Wage growth is steady, no extra inflation pressure.
Non-Farm Employment Change:
❌ Actual: 22K vs Forecast: 75K vs Previous: 79K
→ Job creation has fallen sharply, showing slowdown in the US economy.
Unemployment Rate:
✅ Actual: 4.3% (as expected, higher than 4.2% previous).
→ Labour market conditions are getting weaker, unemployment rising.
🔎 Market Impact
US Dollar (USD):
Weak NFP data is negative for the dollar.
Higher unemployment increases chances of the Fed cutting rates earlier.
Gold (XAU/USD):
Positive for gold: Weak USD supports higher gold prices.
If the Fed turns dovish, safe-haven demand for gold will strengthen.
Gold may gain strong momentum on expectations of rate cuts.
Equities:
Wage inflation is stable, so no fresh inflation worries.
Equity markets may take it positively as Fed could soften policy.
📌 Key Takeaway
NFP weak → Bearish USD
Gold bullish, upside momentum possible
EUR, GBP likely to gain on USD weakness
Equities may stay supported

Gold 4H Outlook – Buy the Dip or Fade the Drop?On the 4H timeframe, Gold is consolidating just below 3,600 after a strong bullish rally. The current structure shows price pausing near premium levels, with liquidity building both above 3,600 and below 3,530. This indicates engineered sweeps are likely before the next major move.
📌 Key Structure & Liquidity Zones (4H):
🔼 Buy Zone 3,572 – 3,574 (SL 3,565): Fresh demand zone at intraday discount; potential continuation level.
🔽 Sell Scalp Zone 3,530 – 3,526 (SL 3,537): Short-term supply/pivot area; scalp opportunity if rejection happens.
📍 Liquidity Magnet 3,603 – 3,605: Upside imbalance area likely to get filled.
📊 Trading Ideas (Scenario-Based):
🔺 Buy Setup – Demand Zone Reaction
Entry: 3,572 – 3,574
Stop Loss: 3,565
Take Profits:
TP1: 3,585
TP2: 3,595
TP3: 3,605
👉 Demand block in line with bullish order flow. Watch for a liquidity sweep and rejection to fuel trend continuation.
🔻 Sell Scalp Setup – Short-Term Reaction
Entry: 3,530 – 3,528
Stop Loss: 3,537
Take Profits:
TP1: 3,520
TP2: 3,510
TP3: 3,500
👉 Intraday supply/pivot area. Best suited for quick scalp trades against the trend, targeting downside liquidity.
🔑 Strategy Note
Overall bias stays bullish, but intraday shorts can work for scalping purposes. The cleaner setup is to buy from 3,572–3,574 for continuation towards 3,600+. Smart money may attempt a liquidity sweep at 3,530 before pushing higher.

“Gold Shines Bright | Bullish Momentum Targeting $3,700🔎 Technical Analysis – XAU/USD (1H Chart)
Trend: Strong bullish trend confirmed, with price making higher highs and higher lows.
Buy Zone: Around 3,590 – 3,600 USD, where buyers stepped in aggressively.
Short-Term Target 🎯: 3,650 – 3,700 USD (already highlighted on chart).
Key Support Levels:
3,561 USD (near-term support)
3,490 USD (major support, bullish structure invalidation if broken)
📌 Outlook: As long as price holds above the buy zone, momentum favors bulls with potential continuation toward 3,700+ USD.
🌍 Fundamental Drivers for Gold Bullishness ✨
Federal Reserve Rate Cuts Expectations 🏦⬇️ – If the Fed signals easing or holds a dovish stance, real yields fall → Gold strengthens.
Weakening US Dollar (DXY) 💵📉 – A softer dollar makes gold more attractive to global investors.
Geopolitical Risks 🌍⚠️ – Rising global tensions increase demand for safe-haven assets like gold.
Central Bank Demand 🏦🔒 – Many central banks are adding gold reserves to hedge against currency risks.
Inflation Hedge 📊🔥 – Gold remains attractive when inflationary pressures stay elevated.

XAUUSD – Wave (4) Pullback Could Launch Wave (5)Namaste Traders
Gold on the M30 chart remains bullish, but the push into the upper channel line signals short-term profit booking. For those trading Gold/USD or tracking Gold in INR terms on MCX, here’s my plan for the upcoming sessions:
🔍 Technical Overview
Price completed Wave (3) around 3697.40, tagging the upper trend channel – a natural zone for sellers to take profits.
The 3666–3670 region has acted as a pivot/support multiple times. I expect a Wave (4) correction into this zone before a fresh rally.
3657 is deeper support and also serves as the invalidation level for the bullish scenario.
If Wave (4) holds, Wave (5) could push towards 3720–3725.
📈 Key Levels
Type Price Level Notes
Resistance 3695–3700 Wave (3) top + upper channel edge – watch for rejection
Support (1) 3666–3670 Primary buy zone for Wave (4)
Support (2) 3657 Strong support & invalidation
Target (5) 3720–3725 Expected Wave (5) extension target
⚙️ Trading Plan
✅ Primary Setup – Buy the Dip (Trend Continuation)
Entry Zone: 3666–3670 (or a small sweep to ~3657).
Confirmation: Look for a bullish engulfing candle, pin bar, or MACD crossover on the M30 chart.
Take Profit:
TP1: 3695–3700 (previous high/resistance)
TP2: 3720–3725 (Wave (5) projection)
Stop Loss: Below ~3652.
Risk/Reward: Aim for 1:2 to 1:3.
⚠️ Secondary Setup – Countertrend Short
If price retests 3695–3700 and forms a strong rejection, a quick countertrend short is possible.
Targets: 3670 → 3657.
Stop Loss: Above ~3703–3707.
Use small position sizing, as this is against the primary trend.
🛡 Risk & Invalidation
A close below 3656 plus a break of the lower trend channel invalidates the bullish Wave (5) scenario.
For Indian traders watching MCX Gold (in INR), keep in mind USD/INR fluctuations – a weaker rupee can amplify gold gains even if spot prices pause.
Always keep risk ≤1–1.5% per trade and avoid chasing late entries.
🧭 Final Thoughts
Gold’s trend is still bullish on the short-term chart. A healthy correction into 3666–3670 could offer a prime entry for Wave (5). Be patient, wait for confirmation, and let the price come to your zone.
Countertrend shorts are valid only on a clear rejection at 3695–3700 – otherwise, stick with the trend.
Good luck and happy trading,

Gold on Fire: Fed Rate Cuts & Global Tensions Fueling the Rally!Hello, fellow traders! Gold (XAU/USD) is on an absolute tear, closing strong at $3,680.80/oz on September 15, 2025, after hitting a new all-time high (ATH) of $3,685.39/oz. The past week has been solid, with gold up 1.6% as the US dollar weakened (down 0.3% to a one-week low) and US bond yields dropped. The market is buzzing with talk of a sure-shot 0.25% Fed rate cut on September 17, with some even betting on a bigger 0.5% move as per the CME FedWatch Tool. Plus, geopolitical tensions and reports of China easing gold import norms are adding more fuel to this fire. Let's do a deep dive and check out some solid trading setups! 💰
Fundamental Analysis: All That Glitters Is Gold! 🌟
Fed Rate Cuts: The latest US data is a mixed bag—the August CPI was hot, but the jobs market is cooling down. This is giving the Fed a clear signal to cut rates for the first time since December 2024. Lower interest rates are a big negative for the US Dollar, making non-yielding assets like gold super attractive. This is a classic "buy the rumor, sell the news" situation, but right now, the rumor is all about buying gold!
Geopolitical Jitters: The upcoming Fed meeting is quite tense, with political drama and a lot of pressure from the White House. This kind of uncertainty is gold's best friend, as it’s the ultimate safe-haven asset.
Chinese Demand: Recent reports suggest China is making it easier to import gold, which means more demand is coming from the world's biggest consumer. Strong buying from both official and private players in China is a major tailwind for gold's upward move.
Technical Analysis: Breaking All Barriers! 📉
Gold has smashed through the Fibo 2.618 level and is in uncharted territory. What's impressive is that the pullbacks are very shallow, just a $10 blip before it resumes its rally. This shows the bulls are in complete control, and selling pressure is minimal. The strategy is simple: look to buy on dips and be very selective about any shorting opportunities.
Resistance Levels: $3704, $3714, $3724
Support Levels: $3694, $3686, $3674, $3666
Trading Setups (Strict Risk Management Is Key):
Buy Scalp:
Zone: $3688 - $3686
SL: $3682
TP: $3691 - $3696 - $3701 - $3706
Buy Zone:
Zone: $3667 - $3665
SL: $3657
TP: $3675 - $3685 - $3695 - $3705 - $3715
Sell Scalp:
Zone: $3704 - $3706
SL: $3710
TP: $3701 - $3696 - $3691 - $3686
Sell Zone:
Zone: $3724 - $3726
SL: $3734
TP: $3716 - $3706 - $3696 - $3686 - $3676
Gold is at an ATH—so be careful of liquidity traps around the Fed announcement! Above $3694, the target is the sky; below, we could see a test of $3666. Manage your risk tightly before September 17! What's your plan: buy the dip or sell the top? Let me know your strategy in the comments! 👇
#Gold #XAUUSD #Fed #RateCuts #CPI #TradingView #MarketUpdate #Forex #Investing #TechnicalAnalysis #GoldTrading #Finance #Geopolitics #CentralBank

Gold Facing Strong Resistance – Bearish Move Towards Support ?Analysis:
Resistance Zone: Price is struggling to break above the $3,645–$3,650 area, which has acted as a strong resistance multiple times.
Support Levels: Immediate support lies around $3,620 and $3,614, with the major support zone at $3,580.
Price Action: Repeated rejections from resistance indicate weakening bullish momentum. Sellers are gaining control near the resistance zone.
Bearish Outlook: A potential downward move is projected, with price likely to test $3,580 support if resistance continues to hold.
Risk Management: A break and close above $3,650 would invalidate the bearish scenario and could trigger a bullish continuation.
✅ Bias: Bearish below $3,650
🎯 Targets: $3,620 → $3,614 → $3,580
🛑 Invalidation: Above $3,650

Gold Ahead of FOMC: Holding the Bullish Structure, Eyeing 3,700Hello everyone, gold is heading into a very sensitive week with the upcoming FOMC decision on rates and policy guidance. On the H1 chart, price just broke out to 3.68xx with a strong candle and improved volume, now consolidating just below 3,690–3,700 – a psychological barrier and session high. The broader trend remains upward as gold trades above a rising Ichimoku cloud, while clear support steps form below: 3,662–3,665 as the nearest floor, 3,648–3,642 as a deeper defense, and the 3,635–3,625 cloud zone as intraday trend protection. As long as gold holds above 3.66x, I favour a high-probability accumulation setup to retest 3,690–3,700; if H1/H4 candles close above 3,700, the next target could extend to 3,715–3,730.
On the news side, the midweek FOMC is the key trigger. A dovish Powell and dot-plot could soften USD and yields, giving gold a chance to break 3,700. A hawkish tone, however, may spark profit-taking and pull gold back to 3,662–3,665 or even 3,648–3,642 to test demand. Labour data, manufacturing reports, and the BoE decision will also shape sentiment. With US figures lately underwhelming, markets lean toward a softer Fed stance, which underpins gold. I tilt bullish, watching reactions around 3,665 and 3,645 as FOMC headlines hit.
Do you think the Fed will sound dovish or hawkish this week? Drop your thoughts!
Part ! Ride The Big MovesWhat is an Option?
An option is a financial derivative that gives the holder the right, but not the obligation, to buy or sell an underlying asset at a predetermined price (strike price) on or before a specified date (expiration date).
Underlying Asset: This can be a stock, index, commodity, currency, or ETF.
Strike Price: The price at which the asset can be bought or sold.
Expiration Date: The date on which the option contract expires.
Premium: The price paid to purchase the option.
There are two main types of options:
Call Option: Gives the holder the right to buy the underlying asset at the strike price.
Put Option: Gives the holder the right to sell the underlying asset at the strike price.
Call Options Explained
A call option becomes profitable when the price of the underlying asset rises above the strike price plus the premium paid.
Example:
Stock price: ₹1,000
Strike price: ₹1,050
Premium: ₹20
If the stock rises to ₹1,100:
Profit = (Stock Price – Strike Price – Premium) = 1,100 – 1,050 – 20 = ₹30
If the stock remains below ₹1,050, the option expires worthless, and the loss is the premium paid.

GOLD Bullish continuation (new highs, momentum sustain) :
Probability: around 60–65%
The breakout has strong support from macro conditions. Real yields look like they are peaking, inflation expectations remain sticky, and the Fed is leaning toward easing. On top of that, the US dollar is softening and central banks are continuing to add gold to reserves. These combined factors increase the odds that the breakout holds and the trend continues higher.
Sideways consolidation or retest of breakout :
Probability: about 25–30%
A pullback or cnsolidation wouldn’t be surprising, especially if the Fed sounds less dovish or if inflation data cools faster than expected. In that case, gold could spend some time chopping between support and resistance before deciding its next big move.
Major correction or deep mean reversion :
A deep selloff looks like the least likely path right now. Real yields aren’t rising sharply, inflation isn’t collapsing, and the dollar is still under pressure. But nothing is guaranteed. A surprise hawkish turn from the Fed or a sudden global disinflation shock could knock gold back toward old structural levels.but this remains the least likely scenario in the near to medium term.

XAUUSD/GOLD 1H BUY PROJECTION 16.09.25XAUUSD/Gold 1H Buy Projection (16.09.25). Here’s a breakdown of the key points from your analysis:
🔹 Chart Analysis
Support & Resistance
Support S1: Around 3678 zone.
Minor Resistance Breaked: Price broke above the 3680 resistance area.
Resistance R1 (ATH): Around 3692 – 3696 area.
Entry & Stoploss
Current price: 3683.63
Stoploss: Below 3676 level.
Risk Zone (Red Area): Price should not break below this zone for the buy setup to remain valid.
Target Levels
Target Price 1: ~3688
Target Price 2: ~3692–3696
Indicators
Stochastic Oscillator (top indicator):
Showing a bullish crossover (green line crossing above red), suggesting upward momentum.
RSI (bottom indicator):
Turning upward from 64.47, showing renewed buying pressure.
🔹 Projection
The setup is bullish with expected upward movement from 3683 → 3692 → 3696+.
The chart suggests a possible pullback and continuation before reaching higher targets.
As long as 3680 support holds, momentum favors the upside.

Gold 1H – Breakout Liquidity Trap Ahead of ExpansionGold on the 1H timeframe is consolidating around 3,652 after sweeping discount liquidity and reclaiming structure. Price has tapped the breakout zone and is currently trading between the scalp supply in premium and the higher liquidity pools. The structure indicates engineered moves into 3,656–3,658 or deeper liquidity around 3,672–3,674 before the next expansion. Discount demand remains protected at 3,614–3,612.
________________________________________
📌 Key Structure & Liquidity Zones (1H):
• 🔴 SELL ZONE 3,672 – 3,674 (SL 3,679): Premium supply pocket for engineered rejection, targeting 3,660 → 3,650 → 3,640.
• 🔴 SELL SCALP 3,656 – 3,658 (SL 3,663): Short-term premium sweep zone for intraday liquidity grabs, targeting 3,645 → 3,640.
• 🟢 BUY ZONE 3,614 – 3,612 (SL 3,607): Discount demand block aligned with bullish order flow, targeting 3,630 → 3,640 → 3,655.
________________________________________
📊 Trading Ideas (Scenario-Based):
🔻 Sell Setup – Premium Scalp Rejection
• Entry: 3,656 – 3,658
• Stop Loss: 3,663
• Take Profits:
TP1: 3,645
TP2: 3,640
👉 Intraday scalp opportunity if price sweeps into shallow premium liquidity.
🔻 Sell Setup – Deeper Premium Sweep
• Entry: 3,672 – 3,674
• Stop Loss: 3,679
• Take Profits:
TP1: 3,660
TP2: 3,650
TP3: 3,640
👉 Expect an engineered sweep into higher premium before reversal.
🔺 Buy Setup – Discount Demand Reaction
• Entry: 3,614 – 3,612
• Stop Loss: 3,607
• Take Profits:
TP1: 3,630
TP2: 3,640
TP3: 3,655
👉 A high R:R trade if price retraces to the protected demand before expansion.
________________________________________
🔑 Strategy Note
Smart money is likely to manipulate both premium and discount zones near the breakout point. The directional bias favours:
• Scalp sells at 3,656–3,658
• Swing sells at 3,672–3,674
• Discount buys at 3,614–3,612
Strict risk management is essential — expect liquidity sweeps on both sides before the actual expansion.

XAUUSD ANALYSIS 16-SEP-2025LTP 3684.x
Supports: 3610/3397/3313/3119 (base support)
As long as the above supports hold, we will see 3677-3700-3734 (expecting some correction from this level).
Further,
3819-3834-3910
4155
4655

Fresh Highs, Hot Headlines , Is a Pullback Next?Gold broke out of its recent range yesterday and is now trading at new all-time highs, showing strong follow-through momentum. On the weekly pivot chart, price is currently testing Weekly R1, with the next key level being the psychological 3700 resistance.
While the technical structure remains bullish, today’s headlines from major gold newsletter are a reminder that sentiment is running extremely hot. When you start seeing mainstream media comparing gold rally to 1979 and celebrating retail traders wins, it often signals that we’re entering a frothy phase.
With the FOMC decision approaching, the risk of a short-term shakeout or healthy correction is definitely on the table. A close back below the breakout zone could trigger profit-taking, while holding above R1 would keep the path open for 3700 and beyond.
For now, 3625–3650 remains the key support area, and as long as price holds above this zone, the trend stays firmly bullish but we should stay cautious and avoid chasing too aggressively at these levels until we get clarity from the Fed.
Personally I am expecting some cool down after FOMC .

GOLD DAILY PLAN 15/09: SMC & Wyckoff Logic🔎 Market Overview
Market Structure (SMC): Price is currently moving inside a short-term descending channel but is showing signs of Wyckoff accumulation around the 3620–3635 zone (Liquidity BUY). This is a key support area.
Wyckoff: After a supply test, price is likely to consolidate and then push higher to sweep liquidity above (Liquidity SELL at 3688–3703).
Liquidity Zones
Liquidity BUY: 3595–3592 (major demand area)
Liquidity SELL: 3688–3703 (profit-taking & potential reversal zone)
📌 Key Levels
Resistance: 3668 – 3688 – 3703
Support: 3634 – 3629 – 3622 – 3617
🟢 BUY Plan (Primary Setup)
Entry: 3595–3592
Stop Loss (SL): 3587 (below Liquidity BUY)
Take Profit (TP) targets:
TP1: 3615
TP2: 3625
TP3: 3635
TP4: 3645
Open TP: 3685 (extended Wyckoff target)
🔴 SELL Plan (Counter-trade)
Entry: 3698–3701 (Liquidity SELL zone)
Stop Loss (SL): 3706 (just above breakout trap)
Take Profit (TP) targets:
TP1: 3690
TP2: 3680
TP3: 3670
TP4: 3660
Open TP: 3650
⚡ Scalping Strategy
Enter only on confirmation signals at Order Blocks (OB) or Liquidity Zones.
Prioritise BUY trades at support and SELL trades at resistance.
Apply strict risk management: risk no more than 1–2% per trade.
✅ Conclusion
Main directional bias for the day: BUY from 3595–3592, targeting the 3685–3700 region.
At Liquidity SELL 3688–3703, short-term SELL setups can be considered with targets back to 3660–3650.

Elliott Wave Analysis XAUUSD – September 16, 2025
Momentum
• D1: Momentum is currently in an uptrend, suggesting that price may continue to rise for the next 5–6 days.
• H4: Momentum is turning downward, indicating the possibility of a correction today.
• H1: Recently showed a bullish reversal signal, but now there are signs of weakening again. This suggests that the downward move on H1 may not yet be complete.
Wave Structure
• D1: Yesterday’s daily candle created a new high, which indicates that wave iv (black) has likely been completed. The market is now developing in wave v (black).
• H4: Wave iv (black) is likely finished. With H4 momentum turning lower, wave 1 of wave v (black) may already be completed, and the market is now entering a corrective phase.
• H1: Wave v (black) is unfolding into a 5-wave structure (green). Combined with weakening H4 momentum, there are two possible scenarios:
1. This is wave 4 (green), with a maximum correction level around 3662.
2. This is wave 2 of wave v (black – D1), with a potential correction target around 3657.
Since both scenarios point to a similar price zone, we select 3662–3660 as the buy entry zone.
Trading Plan
• Buy Zone: 3662 – 3660
• SL: 3650
• TP: 3698
