Gold 1H – CPI Liquidity Play Before ExpansionGold on the 1H timeframe is consolidating near 3,633 after multiple ChoCHs and engineered liquidity grabs. With today’s CPI release, price is expected to sweep both premium and discount liquidity zones. The structure suggests engineered spikes toward 3,688–3,691 or dips into 3,595–3,592 before expansion.
________________________________________
📌 Key Structure & Liquidity Zones (1H):
• 🔴 SELL ZONE 3,643 – 3,645 (SL 3,650): Premium supply pocket for short-term rejection.
• 🔴 SELL ZONE 3,688 – 3,691 (SL 3,696): Premium sweep zone targeting 3,680 → 3,670 → 3,660 → 3,650 with extended open target at 3,625.
• 🟢 BUY ZONE 3,595 – 3,592 (SL 3,587): Discount demand zone targeting 3,615 → 3,625 → 3,635 → 3,645 with extended open target at 3,685.
________________________________________
📊 Trading Ideas (Scenario-Based):
🔻 Sell Setup – Premium Rejection (Intraday)
• Entry: 3,643 – 3,645
• Stop Loss: 3,650
• Take Profits:
TP1: 3,630
TP2: 3,620
TP3: 3,600
👉 Scalp opportunity if CPI spikes price into this supply zone.
🔻 Sell Setup – CPI Premium Sweep
• Entry: 3,688 – 3,691
• Stop Loss: 3,696
• Take Profits:
TP1: 3,680
TP2: 3,670
TP3: 3,660
TP4: 3,650
Open: 3,625
👉 Expect engineered CPI move into premium liquidity before reversal.
🔺 Buy Setup – CPI Discount Sweep
• Entry: 3,595 – 3,592
• Stop Loss: 3,587
• Take Profits:
TP1: 3,615
TP2: 3,625
TP3: 3,635
TP4: 3,645
Open: 3,685
👉 Ideal entry if CPI drives gold into deep discount demand before expansion.
________________________________________
🔑 Strategy Note
CPI will dictate volatility and smart money may sweep liquidity both sides. Key bias favours:
• Scalp sells at 3,643–3,645
• Deeper swing sells at 3,688–3,691
• High R:R buys at 3,595–3,592
Risk management is essential — expect fake-outs before expansion.
GOLDCFD trade ideas

XAUUSD – CPI Today: Liquidity Sweep & Trading Plan📊 Market View
Gold (XAUUSD) is moving under short-term resistance (descending trendline), indicating sellers still dominate in the short term. On the M30 chart, buy-side liquidity zones are clearly stacked at 3,624 → 3,612 → 3,599 → 3,586.
👉 During the European session, expect a breakdown liquidity sweep toward these support zones before any bullish reaction.
📈 CPI View – US Session
Soft CPI (below expectations) → Weaker USD, lower yields → Gold could bounce sharply from 3,612 / 3,599 / 3,586 and retest trendline/resistance.
Hot CPI (above expectations) → Stronger USD, higher yields → Gold may break 3,612, sweep deeper to 3,599 or 3,586, then recover.
⚠️ High risk of news traps: the first reaction can reverse quickly—wait for retests + confirmation candles before entering.
🔑 Key Levels
Dynamic Resistance (trendline): 3,643 – 3,646
React Zone FIB: 3,650 – 3,654
OBS Sell Zone: 3,665
Support / Liquidity Zones:
3,624.36 (Key Zone Support BUY)
3,612.60 (CP/React FIB)
3,599.31 (BUY ZONE)
3,586.49 (END LIQUIDITY – BUY ZONE)
📌 Trading Plan
🔴 SELL ZONE: 3,646 – 3,648
SL: 3,652
TP: 3,640 → 3,635 → 3,630 → 3,620 → 3,610 → ???
🔵 BUY SCALP: 3,612 – 3,610
SL: 3,605
TP: 3,616 → 3,620 → 3,625 → 3,630 → ???
🔵 BUY ZONE (Primary): 3,600 – 3,598
SL: 3,592
TP: 3,605 → 3,610 → 3,615 → 3,620 → 3,630 → 3,640 → ???
🛡️ Backup BUY: (If liquidity sweep deepens) 3,58x
Hard SL: 3,578
❗ If 3,578 breaks, don’t re-enter immediately—CPI volatility can extend the move further.
⚠️ Notes & Risk
Reduce position size near the CPI release.
Wait for confirmation (pin bar / engulfing / retest) before entering trades.
Use staggered TPs to lock in profits early.
An M30 close above 3,654 invalidates near-term shorts and opens 3,665.
✅ Summary
Gold may sweep liquidity into the buy zones before bouncing. Trade the reaction: SELL at 3,646–48 on rejection, BUY at 3,612/3,600 on a clean bounce, and hold a backup BUY at 3,58x with tight risk.
👉 Follow MMFLOW TRADING for real-time updates and BIGWIN setups during CPI volatility.

XAUUSD GOLD ANALYSIS ON (11/09/2025)#XAUUSD UPDATEDE
Current price - 3636
If price stay below 3660, then next target 3600,3680 and above that 3700
Plan;If price break 3640-3648 area, and stay below 3640, we will place sell order in gold with target of 3600 and 3580 & stop loss should be placed at 3660

Gold is currently in a period of profit-taking.Gold is currently in a period of profit-taking.
As shown in Figure 2h:
1: Clearly, gold prices have fallen after two consecutive days of positive news. The motivation is clear: gold has reached a record high, and everyone is taking advantage of the good news to sell.
2: Important CPI data will be released today, and everyone is waiting to see whether gold prices will show any new momentum after the release. This is already very clear. Even if the data is positive, the likelihood of gold prices reaching new highs is low. I still maintain my view that gold prices will struggle to reach new highs this week.
3: Gold prices need some time to breathe and adjust, and the specific technical pattern is: wide range fluctuations.
Strategy Analysis:
1: Buying low remains the mainstream strategy.
2: Focus on the next important price support levels:
3620: (Current support level, range: 3620-3660)
3600: (Current support level, important round number support level)
Many people ask whether round number support levels are useful. It's like if you go to the supermarket and see the same item priced at $1,000 and $999.9, you'll definitely choose the $999.9, right?
This is the core logic behind round-number support and resistance levels. People always set a standard for judgment.
3580-3570 (Current Trend Support, Currently the Strongest Support Level)
3: You can certainly participate in short selling, but don't be overly bullish on your short position. Once a trend is established, it won't change easily. Intraday short selling is fine.
4: Strategy:
Sell 1: 3630-3635
Stop Loss: 3645
Sell 2: 3650-3655
Stop Loss: 3665
Target Price: 3620-3600
Note: Short selling is suitable for intraday trading.
Buy 1: 3620
Buy 2: 3600
Buy 3: 3580
Stop Loss: 3568-3570
Note: Long positions require a swing trading strategy and be prepared for long-term trading.

XAU/USD | 1H | CPI Setup in PlayGold just swept the previous low around 3615 and is showing signs of accumulation. Liquidity below has been taken, and the market structure hints at a bullish delivery if CPI comes in line with expectations.
Key levels:
Demand Zone 3610–3620 where buyers stepped in
First Target 3650 area (mid supply)
Final Target 3685–3690 (major supply/liquidity pool)
Bias: Waiting for a clean internal break of structure and retest before the impulsive move up. CPI data could be the catalyst for this push toward the upper liquidity zones.

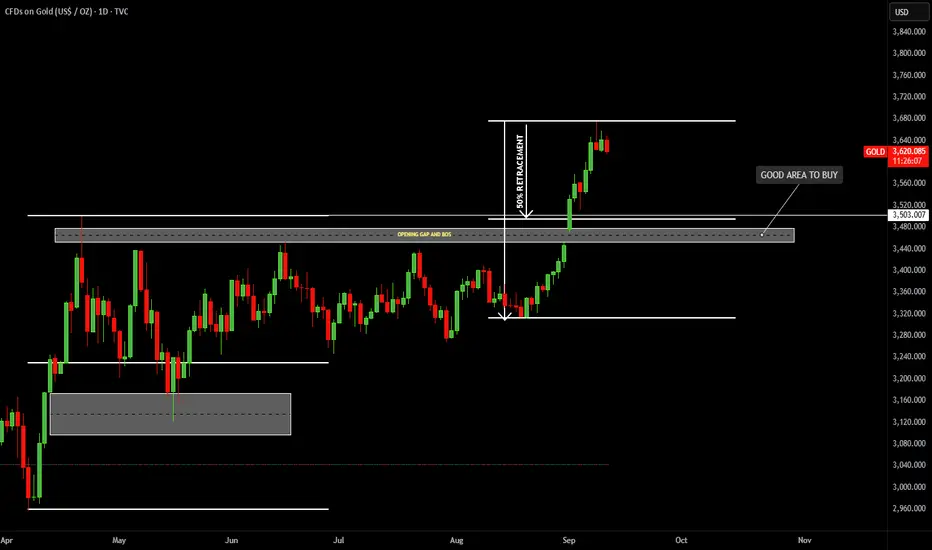
GOLDTechnical Outlook
Support Levels:
3520 (retest zone & demand area)
3400 (secondary support if deeper pullback occurs)
Resistance Levels:
3680–3700 (supply / recent high)
3800+ (next extension level if breakout continues)
Trend Bias: Strongly Bullish
Breakout above resistance with follow-through.
High probability of continuation towards 3700–3800, provided 3520 holds.
September 11th Gold AnalysisSeptember 11th Gold Analysis
Waiting for CPI Data to Break the Deadlock
Market Dynamics
Yesterday's gold market exhibited typical pre-data volatility. Following a series of emotional speculation, bulls and bears reached a stalemate, with gold prices fluctuating between $3,618 and $3,657 throughout the day, ultimately closing slightly higher.
This narrow consolidation pattern reflects the market's conflicting sentiment: on the one hand, expectations of a Fed rate cut and geopolitical risks are supporting gold prices; on the other hand, gold prices are already at historical highs, and further upward momentum requires new catalysts.
Gold has risen over 39% so far this year, an astonishing performance that makes it one of the best-performing asset classes in 2025.
Focus Event: US CPI Data
Today's US August CPI data will serve as a bellwether for the market. Market expectations are for the unadjusted CPI to be 2.9% annualized (previous reading: 2.7%) and 0.3% monthly; the core CPI is expected to be 3.1% annualized and 0.3% monthly.
This data will directly influence the Federal Reserve's decision at its September 17-18 meeting. The market currently places a 100% probability on a 25 basis point rate cut by the Fed, but the strength of the CPI data will influence the subsequent policy path.
A strong reading could push gold below the $3,600 support level; conversely, a weak reading could see gold prices test or even break through all-time highs.
Technical Analysis
From a technical perspective, gold is currently oscillating at a high level, with a tendency toward sideways trading. On the upside, watch for short-term resistance around 3,655-60, while on the downside, focus on support around 3,625-20.
The performance of the previous two trading days suggests that gold bullish sentiment is waning. A break below the 3,620-25 support level could trigger a short-term counterattack by bears, potentially testing support around 3,605-00, and even a pullback to 3,570.
However, such a deep correction would require support from negative fundamental factors. Tonight's US CPI data and the ECB's interest rate decision could contribute to this situation, but the market's current dominant sentiment remains focused on expectations of a Fed rate cut next week.
Trading Strategies and Risk Management
Prior to the data release, gold prices are likely to remain volatile at high levels. Consider adopting a light-weight strategy of buying low and selling high, and then following the market trend after the data is released.
Long: We recommend a light-weight long position in the 3620-3628 area, with a stop-loss below 3615 and a target of 3650-3660.
Short: We recommend a light-weight short position in the 3630-3640 area, with a stop-loss below 3655 and a target of 3620. If the price falls below the 3620 support level, you can increase your short position and target lower support levels.
The market is volatile, especially on trading days with major data releases, when volatility and uncertainty can increase significantly. Investors should respond flexibly based on real-time market conditions, ensure proper risk management, and make prudent decisions.
Thank you for your attention. I hope my analysis can be helpful to you.

Gold in a nutshell for all Traders & Investors.Not a good time to be long or buy here , unless gold holds here and clears 3700$
i am bearish on gold currently.

How to Close a Losing Trade?Cutting losses is an art, and a losing trader is an artist.
Closing a losing position is an important skill in risk management. When you are in a losing trade, you need to know when to get out and accept the loss. In theory, cutting losses and keeping your losses small is a simple concept, but in practice, it is an art. Here are ten things you need to consider when closing a losing position.
1. Don't trade without a stop-loss strategy. You must know where you will exit before you enter an order.
2. Stop-losses should be placed outside the normal range of price action at a level that could signal that your trading view is wrong.
3. Some traders set stop-losses as a percentage, such as if they are trying to make a profit of +12% on stock trades, they set a stop-loss when the stock falls -4% to create a TP/SL ratio of 3:1.
4. Other traders use time-based stop-losses, if the trade falls but never hits the stop-loss level or reaches the profit target in a set time frame, they will only exit the trade due to no trend and go look for better opportunities.
5. Many traders will exit a trade when they see the market has a spike, even if the price has not hit the stop-loss level.
6. In long-term trend trading, stop-losses must be wide enough to capture a real long-term trend without being stopped out early by noise signals. This is where long-term moving averages such as the 200-day and moving average crossover signals are used to have a wider stop-loss. It is important to have smaller position sizes on potentially more volatile trades and high risk price action.
7. You are trading to make money, not to lose money. Just holding and hoping your losing trades will come back to even so you can exit at breakeven is one of the worst plans.
8. The worst reason to sell a losing position is because of emotion or stress, a trader should always have a rational and quantitative reason to exit a losing trade. If the stop-loss is too tight, you may be shaken out and every trade will easily become a small loss. You have to give trades enough room to develop.
9. Always exit the position when the maximum allowable percentage of your trading capital is lost. Setting your maximum allowable loss percentage at 1% to 2% of your total trading capital based on your stop-loss and position size will reduce the risk of account blowouts and keep your drawdowns small.
10. The basic art of selling a losing trade is knowing the difference between normal volatility and a trend-changing price change.

Failed Bullish Gartley PatternBullish Gartley pattern is made but looks like it is failing so chances are it will go to 3610 and further falling may take it to 3598 levels but for that it must stay below point B i.e. 3635 levels.

Gold: Buy around 3624, target 3660-3674Gold Market Analysis:
Yesterday, we placed a sell order at 3655, then sold all our profits at 3646 in the US market. Yesterday's market saw a surge followed by a decline. The market fluctuations we predicted in yesterday's blog post were all correct. Gold is currently fluctuating at a high level in the short term. In this market, there are opportunities for buying and selling if you capitalize on the market's rhythm. Today, I predict gold will continue to fluctuate and correct before the CPI data is released. Capitalizing on this rhythm, both buying and selling are possible. Today, we are focusing on 3620. If this level breaks, we will consider a short position. Otherwise, we are looking for high-level fluctuations. The long-term trend is still a buy. We made it clear yesterday that long-term trends require time and space to develop. Yesterday's small positive close on the daily chart confirms our analysis. The 5-day moving average is beginning to rise. The volatility will not last long, and results will be seen soon. During the Asian session, we're focusing on the strong support band of 3620-3625. This level is also a buying opportunity for a rebound. Resistance is at 3657, yesterday's rebound high. We anticipate the market to fluctuate within this range. A break above 3657 will open up further upside, and a pullback could be considered a buying opportunity. Volatility occurs when a surge reaches resistance, and further gains are more likely after the volatility ends.
Support is 3620-3625, with strong support at 3600. Resistance is at 3647 and 3657, with 3647 being the dividing line between strength and weakness.
Fundamental Analysis:
The most important CPI data this week will be released today. The recent surge in gold prices is driven by increased market expectations for a September rate cut by the Federal Reserve. This CPI may be the final reference data the Fed uses.
Trading Recommendation:
Gold: Buy around 3624, target 3660-3674

Analysis of subsequent gold price trendsMarket News:
Spot gold saw slight gains in early Asian trading on Thursday (September 11th), currently trading around $3,545 per ounce. International gold prices continued their strong performance. Amidst softening US inflation data and widespread market bets that the Federal Reserve will initiate an interest rate cut next week, spot gold prices are approaching all-time highs, with related gold stocks and mining company indices simultaneously reaching record closing highs. The current strength in the gold market stems from a combination of weak US economic data, geopolitical risks, and the Federal Reserve's policy shift. While gold prices may fluctuate in the short term due to CPI data, the overall bull market is firmly in place, with a year-to-date gain of over 39% suggesting further upside potential. Gold prices continue to approach record highs, driven by unexpectedly weak inflation data, market confidence in an imminent Fed rate cut, and increased safe-haven demand. Industry analysts predict that if the Federal Reserve embarks on an easing cycle, gold will likely continue to attract investors, potentially reaching $3,900 per ounce by the end of the year.
Technical Analysis:
Gold has entered a period of volatile adjustment. Yesterday, it fell before rising, consolidating in a wide range around 3620/3660. Technically, the weekly and daily charts remain within a buying trend channel. The daily chart retraced its course below 3620 before stabilizing and rising strongly above 3658, closing above 3640. The daily chart closed with another positive candlestick pattern. The moving averages remain upward, with the 5-day MA moving average moving up to 3626. The hourly Bollinger Bands are converging, with the moving averages converging. The RSI indicator is retracing to its mid-50 level. On the four-hour chart, gold prices remain within the upper Bollinger Bands, with the moving averages converging. Technically, gold trading continues to see wide range-bound adjustments, with buyers buying at low prices and selling high. Fundamentals: Today's US PPI inflation data will be a key focus!
Trading strategy:
Short-term gold: Buy at 3627-3630, stop loss at 3618, target at 3660-3680;
Short-term gold: Sell at 3660-3663, stop loss at 3672, target at 3630-3610;
Key points:
First support level: 3626, Second support level: 3612, Third support level: 3600
First resistance level: 3666, Second resistance level: 3680, Third resistance level: 3696

XAUUSD – Latest Trend UpdateXAUUSD – Latest Trend Update
Hello Traders,
Gold is moving in line with yesterday’s outlook: after a corrective pullback towards 3660, price resumed its decline and is currently trending lower. If this bearish structure is confirmed on the higher timeframes such as H1 and H4, it may signal that a larger corrective phase on the D1 chart has already begun.
Key Levels to Watch
3620: Marked as an important support zone from yesterday, now considered the key level to confirm continued downside.
3630: Aligned with the lower boundary of the ascending channel, where a reaction could occur before the trend direction becomes clearer.
Medium-Term Scenarios
Gold could decline towards 3550, before bouncing higher again – this is the preferred medium-term scenario.
A deeper move towards 3510 is also possible, where liquidity from previous candle wicks may be retested, before the broader uptrend resumes on the daily timeframe.
The reason for favouring this medium-term downside: price has already completed the Fibonacci Extension 2.618, which often signals the potential for a corrective pullback.
Trading Strategy
Observe reactions around 3630 – 3620 – 3610 for potential buy opportunities aligned with the broader bullish structure.
Sell setups should only be considered if price closes firmly below 3620, confirming further downside momentum.
This is my trading plan for gold today. Use it as a reference and feel free to share your own perspective in the comments.

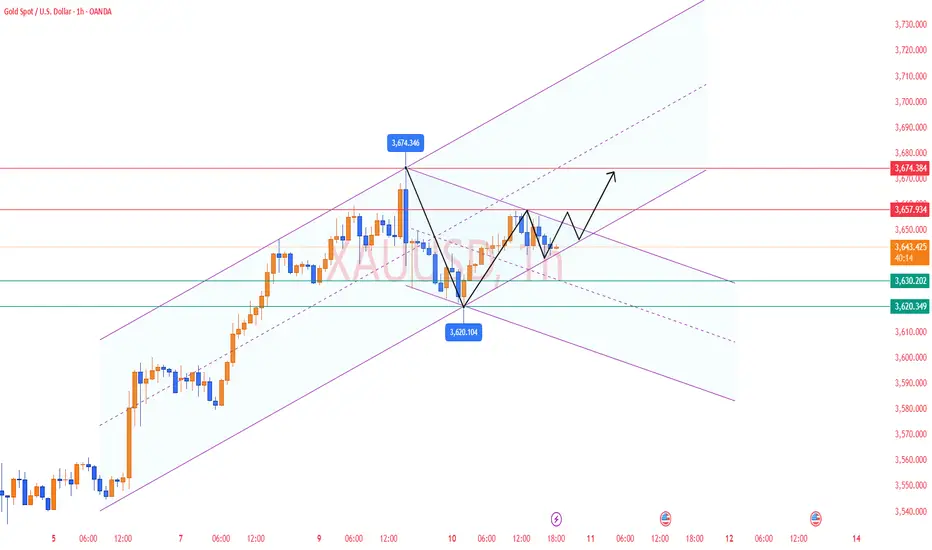
Gold: Cooling inflation, eyeing the 3.70x waveHello everyone,
The macro backdrop is currently favourable for gold, with both China and the US reporting weaker-than-expected inflation data: China’s CPI came in at 0% m/m and -0.4% y/y, with PPI at -2.9% y/y; meanwhile, the US posted PPI at -0.1% m/m, 2.6% y/y, and core PPI at 2.8% y/y. These softer figures have pushed yields and the USD lower, while strengthening expectations that the Fed may cut rates at its next meeting. Adding to this, the PBoC continued to purchase gold in August, reinforcing confidence in long-term reserve demand.
On the H4 chart, the bullish structure remains intact: price is holding above the rising Ichimoku cloud, while FVG blocks below act as support. Gold is currently consolidating tightly in the 3.66–3.68 zone, with short-bodied candles suggesting sellers lack the momentum to break the trend. The nearest support levels to watch are 3.63–3.62, then 3.61–3.60, with deeper support at 3.585–3.575 along the cloud edge.
My view leans bullish: I’m looking for a shallow pullback and an H4 close above 3.66–3.68 to open the way towards 3.70–3.715, potentially extending to 3.72 if momentum holds. Only a close below 3.60 on H4 would make me consider a deeper retracement into the 3.585–3.575 cloud zone.
In short, softer inflation and consistent reserve buying are building a strong foundation for gold. What’s needed now is a firm close above 3.68 to confidently target the 3.70x region.
What do you think – will gold break through 3.70x in this move, or does it need another balance around 3.60 first? Share your thoughts!

XAU/USD(20250911) Today's AnalysisMarket News:
The U.S. PPI annual rate for August hit 2.6%, the lowest since June. Traders are increasing bets on a Federal Reserve rate cut.
Technical Analysis:
Today's buy/sell levels:
3639
Support and resistance levels:
3676
3662
3653
3625
3616
3602
Trading Strategy:
If the market breaks above 3653, consider buying, with the first target at 3662.
If the market breaks below 3639, consider selling, with the first target at 3625.

Bulls Pausing, Bears Hopeless? Gold Awaits CPI TriggerGold is currently taking a breather after its strong bull run, just as highlighted in the last couple of updates. On the daily chart, price action is consolidating within the 3620–3650/55 zone, and with CPI data lined up today, a breakout from this range could set the next decisive move.
Sentiment-wise, bulls remain in full control, while bears look like they’re running out of steam. Still, a healthy reset is overdue after such an extended rally. From a price action perspective, there are no clear signs of reversal on any major timeframe yet. The key support to watch remains 3600 on a daily closing basis. As long as price holds above this level, the bullish structure is safe.
If 3600 gives way, we could see a deeper pullback toward 3589 (Fib 0.236 support) and then into the 3550–55 zone, which stands as the next strong secondary support. Until then, consolidation here should be treated as part of the ongoing bullish cycle rather than a trend reversal.

Elliott Wave Analysis XAUUSD – September 10, 2025🌀
🔹 Momentum
• D1 timeframe: Momentum is showing signs of a bearish reversal → the market may enter a corrective decline, possibly lasting through the end of this week.
• H4 timeframe: Momentum is turning upward → a short-term recovery could appear today, pushing the indicator into the overbought zone.
• H1 timeframe: Momentum is already in the overbought area and turning down → a short-term decline is likely.
________________________________________
🔹 Wave Structure
• D1: Price has reached the projected target of wave iii (black). With D1 momentum reversing downward, wave iv (black) may be forming. Since wave ii (black) was relatively long, there is a possibility that wave iv (black) could unfold more quickly.
• H4: Yesterday’s decline may suggest that wave v (purple) has temporarily completed. If this scenario plays out, price could move into a corrective phase toward the wave iv target area. The correction may develop as a Zigzag, Flat, or Triangle.
• H1: Price is consolidating within the liquidity zone 3657 – 3631. With H4 momentum hinting at correction, one possible scenario is sideways movement here to complete wave B, followed by a decline into wave C.
o If price breaks and closes below 3631 → the liquidity zone at 3595 may act as the next support.
o Potential targets for wave C:
3595 (aligned with 23.8% Fibonacci retracement).
Or 3556 – 3528 (aligned with 38.2% Fibonacci retracement).
________________________________________
🔹 Trade Scenarios (for reference only)
• Sell Zone: 3657 – 3659
o SL: 3667
o TP1: 3631
o TP2: 3563
• Buy Zone 1: 3596 – 3594
o SL: 3585
o TP1: 3669
o TP2: 3749
• Buy Zone 2: 3557 – 3555
o SL: 3547
o TP1: 3597
o TP2: 3705
📌 Note: The Sell setup at 3657 should be considered with small position size as it goes against the main trend. If price reaches 3595, this Sell scenario could lose validity.

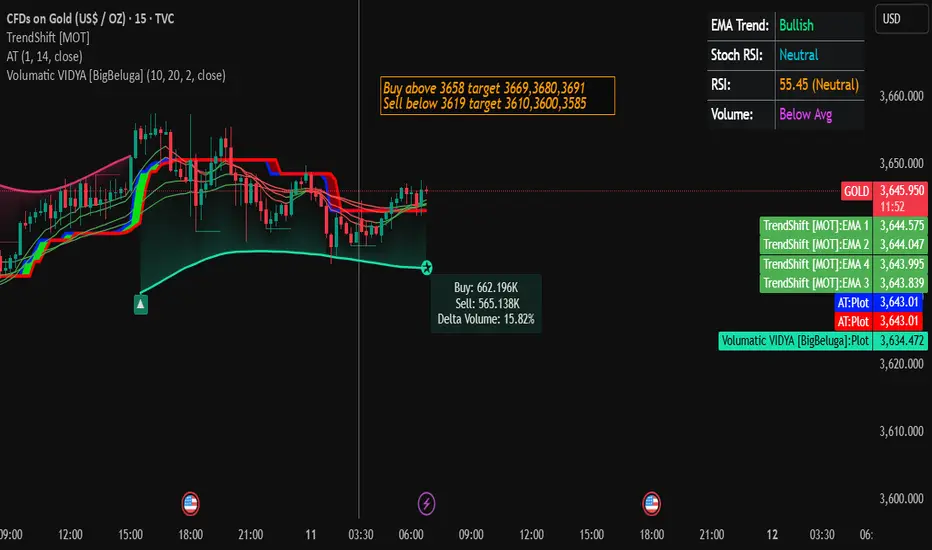
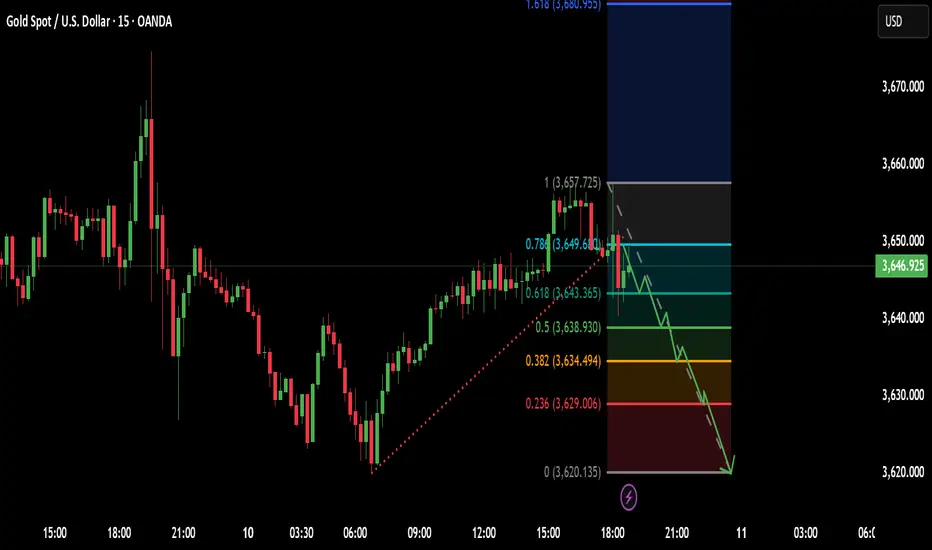
Gold Trading Strategy for 11th September 2025Detailed trading plan — GOLD (15-min breakout rules)
Raw rules :
Buy: if a 15-minute candle closes above the high at $3658 → targets $3669, $3680, $3691.
Sell: if a 15-minute candle closes below the low at $3619 → targets $3610, $3600, $3585.
Execution & order types (step-by-step)
A. Buy setup (how to enter)
Wait for a 15-minute candle to close above the candle high at $3658.
Entry options (choose one):
Buy-stop: place a buy-stop at $3659 (one tick/point above the trigger) so the market enters if price continues up.
Initial stop-loss: place stop below the low of the breakout 15-min candle (or a small buffer below that low to avoid noise). If you prefer a fixed buffer, use e.g. $0.50–$2.00 below that low depending on volatility.
B. Sell setup (how to enter)
Wait for a 15-minute candle to close below the low at $3619.
Entry options:
Sell-stop at $3618 (one tick below trigger), or market sell after the 15-min close.
Initial stop-loss: place stop above the high of the breakout 15-min candle (or a small buffer above).
DISCLAIMER (required)
This is educational / informational only — not financial advice. Trading financial instruments involves substantial risk and is not suitable for all investors. You alone are responsible for any trades you place. Always test strategies in a demo environment, use appropriate position sizing, and consult a licensed financial advisor if you need personalized advice. Past performance is not indicative of future results.
Gold Trading Strategy | September 10-11✅ Daily Chart: The overall trend remains upward. After a continuous rally, gold hit a high near 3675 and pulled back. MA5 and MA10 are still trending upward, while MA20 around 3640 provides key support. The daily trend remains bullish but has entered a high-level consolidation phase, with resistance at 3675–3680 and support at 3615–3640.
✅ 4-Hour Chart: After forming a short-term top, gold pulled back with consecutive bearish candles and is now consolidating around 3640. MA5 and MA10 have flattened, while MA20 at 3629 acts as the key dividing line between bulls and bears. The 4-hour trend has shifted to weak consolidation. If 3629–3630 is broken, the price may further test 3610–3595.
✅ 1-Hour Chart: Short-term rebounds are capped near 3650–3655, with prices fluctuating around MA5 and MA10, showing no clear direction. If the price fails to break above 3655, the short-term outlook remains range-bound to the downside.
🔴 Resistance Levels: 3650–3655 / 3675–3680
🟢 Support Levels: 3630–3635 / 3610–3595
✅ Trading Strategy Reference:
🔹 In the short term, focus on selling the rebounds. Consider short entries near 3650–3655, targeting 3630–3610, with a stop-loss above 3665.
🔹 If the price pulls back to 3630–3637 and holds, consider long entries at lower levels, targeting 3640–3650.
🔥Trading Reminder: Trading strategies are time-sensitive, and market conditions can change rapidly. Please adjust your trading plan based on real-time market conditions. If you have any questions or need one-on-one guidance, feel free to contact me🤝
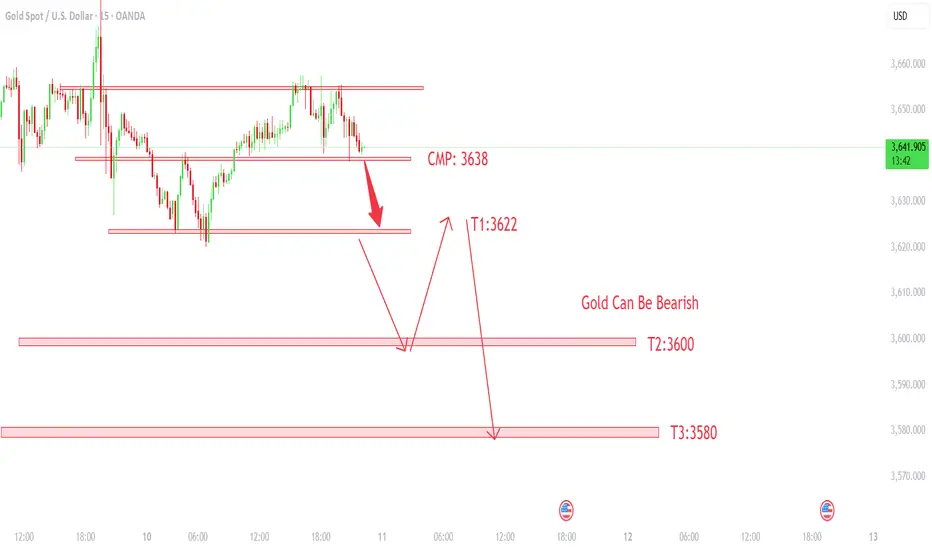
GOLD CAN DO THIS .ITS A VIEW GOLD can be bearish as per the level mentioned in the chart. But global uncertanity can push Gold to new high on higher time frame.
Risk Management is the key to success . If you like the analysis ,just Do a follow .It keep me motivated to go on.
Trading Analysis for Gold Spot / U.S. Dollar (15-Minute Chart)Entery = 3649.00
Stock Loss = 3657.00
Take profit 1 = 3643.00
Take profit 2 = 3639.00
Take profit 3 = 3634.00
Take profit 4 = 3628.00
Based on the provided 15-minute chart for Gold Spot / U.S. Dollar (XAU/USD), published by NaviPips on TradingView.com on June 30, 2025, at 17:53 UTC, here’s a suggested trading setup for a buy position:
Current Price and Trend: The current price is 3,241.875, with a slight increase of +0.250 (+0.01%). The chart shows a recent downtrend that appears to be stabilizing near the current level, suggesting a potential reversal point.
Buy Entry: Enter a buy position at 3,312.875 (current price), as it aligns with a support zone where the price has found a base, indicated by the horizontal dashed line and recent consolidation.
Stop Loss: Place a stop loss at 3,295.250, below the recent low, to protect against further downside. This level is approximately 10.625 points below the entry, defining the risk.
Take Profit Levels:
Take Profit 1: 3,317.875, a conservative target about 20.000 points above the entry, aligning with a minor resistance zone.
Take Profit 2: 3,324.750, a mid-range target approximately 31.875 points above the entry.
Take Profit 3: 3,332.500, a deeper target about 45.625 points above the entry, indicating a potential trend reversal.
Price Action: The chart indicates a downtrend with a possible bottoming pattern near the current level. The support zone and upward candlestick suggest a buy opportunity if the price holds.
Risk-Reward Ratio: The distance to the stop loss (10.625 points) compared to the take profit levels (20.000 to 45.625 points) offers a favorable risk-reward ratio, ranging from approximately 1:1.9 to 1:4.3.
Conclusion
Enter a buy at 3,241.875, with a stop loss at 3,295.250 and take profit levels at 3,317.875, 3,324.750, and 3,332.500. Monitor the price action for confirmation of an upward move, and be cautious of a potential continued downtrend if the price breaks below the stop loss level. (Note: I assume "take profot" was a typo for "take profit" and have corrected it accordingly.)
Gold: Buy near 3604, target 3640-3668Gold Market Analysis:
Yesterday, we placed buy orders at 3643, 3635, 3642, and 3651. Yesterday's strategy was to maintain a bullish outlook. Gold surged and then retreated, with the daily chart closing at a tombstone, signaling new short-term resistance. Many investors believe this is a top, but the current top still needs to be confirmed. The broader trend indicators and pattern are still bullish. On the daily chart, a break below 3600 today will not change the strength of the daily chart and the candlestick pattern. Therefore, it's too early to call a top. This weekly rally is a weekly one, and a top requires time and space to be established. Today, we'll focus on a correction and volatility. Don't insist on buying today, but consider selling opportunities. After all, a correction isn't a one-sided rally, and there's plenty of room for subsequent fluctuations.
The above analysis chart represents our estimated correction. Focus on 3649 in the Asian session. If it fails to break above, we'll look for strong support below and then rally again. If the market defies our guidance and rises directly, we can consider buying at this point. However, yesterday's high of 3674 was also a selling zone. Today, we need to observe the market and adjust our strategy accordingly. Regardless of fluctuations, the overall trend remains bullish. Currently, there's no sign of a break below major support. The first major support is at 3600. We'll focus on its gains and losses today.
Minor support lies at 3620 and 3630, while resistance lies at 3649 and 3658. The dividing line between strength and weakness lies at 3649.
Fundamental Analysis:
Today, focus on the EIA crude oil inventory data. The CPI will be released tomorrow, and this week's major move will also be tomorrow.
Trading Recommendations:
Gold: Sell near 3649, target 3620-3600
Gold: Buy near 3604, target 3640-3668

Global central banks are buying gold! Gold prices are soaring!Market News:
In early Asian trading on Tuesday (September 9), spot gold prices fluctuated at high levels, currently trading around $3,636 per ounce. London gold prices, like a runaway force, broke through the $3,600 per ounce mark and ultimately reached a new all-time high of $3,647. This was primarily due to the US non-farm payroll data released last week, which fell far short of expectations, reinforcing the possibility of a Federal Reserve interest rate cut next week, with a 10% chance of a 50 basis point reduction. In addition to monetary policy expectations, continued gold purchases by global central banks have provided solid support for the international gold market. Meanwhile, global political dynamics are also fueling gold's upward trend. Any rapid rise in asset prices is accompanied by increased volatility. When positive news is fully digested by the market, be wary of the possibility of a volatile pullback triggered by profit-taking by long positions. Investors await Wednesday's Producer Price Index (PPI) and Thursday's Consumer Price Index (CPI) data to gauge the Federal Reserve's policy path. The Bureau of Labor Statistics will release revised non-farm payroll figures this trading day, which investors should pay close attention to. Furthermore, investors should monitor news related to the Russia-Ukraine geopolitical situation.
Technical Analysis:
Gold's trend-buying structure remains intact, reaching a new all-time high of 3646. The daily chart is currently moving upwards along the 5-day moving average, with the 10-day and 7-day moving averages opening at 3524 and 3570, respectively. The RSI indicator has reached the overbought zone at the high 80s, prompting caution for a pullback and correction. The recent consecutive gains require some technical adjustments, so we should remain cautious about overly bullish gold prices and remain wary of potential pullbacks. Looking at the 4-hour gold chart, short-term support is currently focused on the 3610 level, with particular attention focused on the 3575-83 support level. This level also serves as a strong short-term buying zone. Continued buying at this level within the day maintains a bullish outlook. As long as the daily chart does not break below this level, buying at lower prices on a pullback is the primary strategy. The 4-hour moving average remains upward, with prices within an ascending channel and within the upper Bollinger Band. The RSI is at a high of 80. Gold's technical outlook remains bullish, and the key trading strategy remains to buy on dips (short-term buying) and sell on highs (swing trading). Be wary of potential pullbacks after overbought conditions.
Trading strategy:
Short-term gold: Buy at 3610-3613, stop loss at 3600, target at 3640-3660;
Short-term gold: Sell at 3667-3670, stop loss at 3679, target at 3620-3600;
Key points:
First support level: 3620, second support level: 3613, third support level: 3600
First resistance level: 3640, second resistance level: 3655, third resistance level: 3678
