Gold Spot Price Technical Analysis [28-09-2025]Gold Spot Price Technical Analysis - Based on the chart, the XAU/USD daily chart shows an ascending triangle pattern, which is generally considered a bullish signal. The price is currently near a breakout level around 3435.06, with a potential target near 3900.00 if the upward trend continues. The RSI (14) at 74.53 suggests the asset is in overbought territory, which could indicate a potential pullback or consolidation.
GOLDCFD trade ideas

XAUUSUS | Government Shutdown Confirmed | Gold awaits ADP & ISM🔎 Context & News
US Politics : The US government officially shut down after the Senate failed to pass the federal funding bill. A major political risk catalyst, triggering safe-haven flows into Gold.
FED : Probability of a -25bps rate cut in October rises to 96.2% → almost certain.
Key Events Today (ET / UTC) :
• ADP Employment Change: 08:15 ET / 12:15 UTC
• ISM Manufacturing PMI: 10:00 ET / 14:00 UTC
→ Both will be crucial data points that may shake Dollar and Gold.
📌 Summary : US politics + FED easing = Gold remains supported, but ADP & ISM tonight could spark strong volatility in the US session.
📈 Technical Analysis (H1)
Main Trend : Bullish after multiple BoS.
EMA : EMA 34 > EMA 89 → bullish momentum intact.
Resistance :
3,897 – 3,907 (Sell scalp – Fibo 0.5–0.618).
3,920 – 3,921 (Liquidity / ATH test).
Support :
3,872 – 3,876 (old high retest).
3,833 – 3,841 (OB zone).
3,814 – 3,822 (deep Support Zone – losing this shifts bias).
🎯 Trade Plan
✅ Buy (trend priority)
Buy Zone 1 : 3,872 – 3,876
• SL: 3,869
• TP: 3,897 → 3,907 → 3,920
Buy Zone 2 (OB) : 3,833 – 3,841
• SL: 3,826
• TP: 3,872 → 3,897 → 3,907
Buy Zone 3 (Deep Support) : 3,814 – 3,822
• SL: 3,808
• TP: 3,841 → 3,872 → 3,897
⚡ Sell (short scalps only – lower RR)
Sell Zone 1 : 3,897 – 3,907
• SL: 3,912
• TP: 3,885 → 3,876 → 3,841
Sell Zone 2 (ATH sweep) : 3,920 – 3,921
• SL: 3,925
• TP: 3,907 → 3,885 → 3,876
📝 Conclusion
Gold remains strongly supported by the US government shutdown + FED rate cut expectations.
Strategy today: Prioritize Buy at support; Sell only for short scalps around 3,907 – 3,921.
⚠️ Watch out: ADP & ISM tonight may trigger unexpected volatility → manage risk carefully and move SL to BE after TP1.
📢 If you find this Captain’s Log useful, don’t forget to Follow Captain Vincent ⚓ for the latest updates.
💬 What do you think, crew? Will Gold break ATH 3,920 right after ADP & ISM tonight?

XAUUSD Facing Downward PressureHello traders, XAUUSD is currently facing downward pressure following recent economic news. The lower-than-expected unemployment claims data suggests economic stability, reducing the demand for gold. The higher-than-expected PCE core index increases the likelihood that the Fed will maintain high interest rates, putting pressure on gold prices. While the US GDP remains stable , there is no strong breakthrough.
Technically, XAUUSD is in an uptrend but has encountered resistance at $3,790 . The price of gold is currently testing support at $3,700. If this level is broken, gold could fall to the $3,635 region.
Given the current fundamental and technical factors , the likelihood of XAUUSD continuing to decline is high. If support doesn't hold, gold could continue to drop.
Wishing you successful trading!

Gold | Bitcoin | Nifty | Bank Nifty | Neowave AnalysisNamaskaram Everyone
We have discussed following instruments in this video, if you have any query you can ask in the comments.
#Gold
#Bitcoin
#Nifty
#Bank Nifty
COINBASE:BTCUSD FX:XAUUSD OANDA:XAUUSD NSE:BANKNIFTY NSE:NIFTY

Gold Market Outlook – Bullish Trend Building MomentumGold continues to follow a structured bullish cycle, where each consolidation phase has been followed by a breakout and expansion. Market behavior shows liquidity being collected in sideway ranges, then released to fuel upward momentum.
At the current stage, price is trading around $3,870, showing signs of a potential short-term pullback to gather liquidity from the mid-zone. Once this corrective move stabilizes, the chart suggests a renewed bullish impulse with a projected upside target toward the $3,965 level.
This pattern highlights that the market remains in a controlled bullish phase, where temporary retracements are acting as setups for continuation rather than reversal. The underlying flow still favors higher levels as long as buyers maintain activity after corrections.

Gold Market Analysis – Sell Opportunity Emerging in XAU/USDGold has been climbing with strong momentum, but the current leg is showing signs of transition. After a period of consolidation, the market expanded upward, taking liquidity from previous highs and creating an extended run. This behavior often reflects the final stage of a bullish cycle before rebalancing begins.
What stands out now is the engineered path of price: a push into untested liquidity zones above, followed by a potential shift as large players unwind positions. Once liquidity is collected at the extremes, price tends to rotate back into inefficiencies left behind during the rapid climb.
This suggests gold is not simply trending higher, but moving through a liquidity cycle. The near-term structure favors a sweep of higher levels, then a corrective phase where price retraces to refill imbalances and reset order flow for the next directional move.

gold spot today will down close as per chart petterngold today will close down from friday closing . as per chart pettern
Gold Market Analysis & Trading Plan
📌 Macro Background
Gold prices continue to receive support from the decline in US interest rates and the weakening of the USD.
The DXY index decreased by 0.27% to 97.91, reducing the strength of the greenback.
The 10-year US Treasury yield fell by 3 basis points to 4.141%.
Real yield decreased to 1.761%, providing support for gold as the opportunity cost of holding gold is lower.
These factors reinforce the upward trend, although in the short term, gold may still experience adjustments to attract more capital flow.
📈 Technical Structure
The H4 frame shows that gold is maintaining a strong upward momentum, however, the RSI has moved deeply into the overbought zone.
⚖️ Trading Scenarios
🔴 Scenario 1 – Sell Scalping
Entry: 3,879 – 3,882
SL: 3,890
TP: 3,865 → 3,850 → 3,836 → 3,810
👉 Suitable for short-term orders when the price reacts at high resistance.
🟢 Scenario 2 – Buy Zone 1
Entry: 3,805 – 3,808
SL: 3,799
TP: 3,822 → 3,840 → 3,873 → 3,898
👉 Buy in line with the main trend when the price adjusts to the nearby support zone.
🟢 Scenario 3 – Buy Zone 2 (Deeper Support)
Entry: 3,745 – 3,742
SL: 3,735
TP: 3,765 → 3,780 → 3,798 → 3,820 → 3,850
👉 This is a value buy zone if the market adjusts strongly, suitable for short swings.
📊 Summary
The major trend of gold remains bullish, supported by the weakening USD and declining US yields.
In the short term, be aware of the potential for technical adjustments from the resistance 3,879 – 3,882.
Priority strategy: Buy on adjustments, Sell only for quick scalping.
📌 Note: Strict capital management, adhere to stop-loss to preserve profits when unexpected fluctuations from US news occur.

Gold Forecast: Liquidity Rotation Shaping Price ActionGold Forecast: Liquidity Rotation Shaping Price Action
Gold’s recent movement reflects shifting dynamics between liquidity capture and market rebalancing. The push above 3,800 was less about sustained trend extension and more about triggering stops and gathering liquidity before rotating lower. This type of move often indicates that large participants are managing positioning rather than chasing new highs.
The current correction phase is part of that process. Price is being driven back into zones where imbalances remain, allowing institutional flow to realign. Instead of showing weakness, this return highlights how markets redistribute liquidity to prepare for the next decisive move.
From a flow perspective, gold remains in an accumulation phase. Consolidation pockets reveal ongoing positioning, while the corrective dip reflects controlled market engineering rather than disorder. If this cycle continues, the next stage could see energy released in the form of a renewed expansion leg once sufficient liquidity has been absorbed.
In essence, gold is navigating a liquidity-driven cycle: sweep → redistribute → prepare → expand. The underlying order flow still favors upward continuation once the current rebalancing phase completes.

Gold 30/09 - Safe-haven flows surge | Gold sails toward new ATH 🟡 XAU/USD – 30/09 | Captain Vincent ⚓
🔎 Captain’s Log – Context & News
US Politics : Meeting between Trump and bipartisan leaders ended without agreement → growing risk of a US government shutdown by Wednesday.
Conflict : Democrats demand concessions, Republicans fiercely oppose → wide gap remains, both sides blaming each other.
Market : Investors watch JOLTS data and speeches from 3 FED members, but political risks are the strongest catalyst for Gold.
Trend : Safe-haven flows keep pouring into Gold → increasing likelihood of testing new ATH.
⏩ Captain’s Summary : US political seas are stormy, Gold becomes the fortress of safety. The voyage toward ATH is widening.
📈 Captain’s Chart – Technical Analysis (H1)
EMA : EMA 34 (yellow) > EMA 89 (red) → bullish trend clearly dominant.
Golden Harbor (Support / Buy Zone)
Big Volume Dock: 3,827
Storm Breaker (Resistance / Sell Zone)
ATH test: 3,916 – 3,917
Market Structure : Gold broke out strongly, now trading around 3,870. Main trend remains bullish, with 3,842 – 3,827 as key anchor zones.
🎯 Captain’s Map – Trade Plan
✅ Buy (main priority)
Buy Zone 2 – Big Volume
Entry: 3,827 – 3,824
SL: 3,815
TP: 3,870 – 3,899 – 3,916
⚡ Sell (short scalp – high risk)
Sell Zone – ATH test
Entry: 3,917 – 3,920
SL: 3,925
TP: 3,899 – 3,870 – 3,856
⚓ Captain’s Note
“The Golden sails are filled by safe-haven winds, pushing the ship close to ATH. Golden Harbor 🏝️ (3,842 – 3,827) is the ideal dock for sailors to position Buys. Storm Breaker 🌊 (3,916 – 3,920) may unleash violent waves, suitable only for short Quick Boarding 🚤 scalps. If the political storm from Washington breaks out, Gold’s voyage could surpass the peak and expand its horizon.”
📢 If you find the Captain’s Log useful, don’t forget to Follow for the earliest updates.
💬 What’s your view, crew? Will Gold conquer ATH around 3,917 this week?

Gold Price Analysis: Liquidity Redistribution in PlayThe current correction phase is unfolding as part of the broader cycle, where price is retracing into areas of liquidity to rebalance market flow. This is not necessarily weakness, but a redistribution process that allows the market to set up for its next decisive move.
Following the recent rally, price entered a period of consolidation before breaking higher again, showing that buyers remain active. The ongoing return toward previously untested zones reflects how institutional flow realigns, creating space for renewed expansion.
If bullish intent continues, gold could extend toward higher levels after short pauses, with volatility remaining a key factor. The structure highlights that retracements are being used as preparation for continuation rather than reversal.

Gold Trading Strategy for next Monday✅ On Friday, gold rose sharply. We had already advised members to go long around the 3748–3752 area, and the price later climbed to as high as 3783. However, during the second half of the U.S. session, gold pulled back without breaking a new high, indicating weakening bullish momentum. The key question now is whether gold still has the strength to refresh its all-time highs or if this was just a temporary spike. Next week will be a critical observation period.
✅ 4-Hour Chart: Gold has broken out of the recent consolidation range, extending its rally toward the historical high near 3791. The 21-period SMA around 3750 provides strong support. If the price holds below 3750, the short-term structure will turn bearish, possibly falling back into the previous range with downside targets at 3720 and 3700. Conversely, a clear breakout above the 3780–3791 resistance zone could unleash new bullish momentum and open the door to further highs.
✅ 1-Hour Chart: Gold is currently trading in a narrow range, with short-term moving averages gradually turning upward. However, if the rebound momentum fades, a potential double-top could form around 3780–3783, leading to short-term pressure. Overall, unless major news triggers a move, gold will likely remain range-bound early next week. Watch 3780 as resistance and 3720 as support.
🔴 Resistance Levels: 3780–3785 / 3791–3795
🟢 Support Levels: 3745–3755 / 3730–3720
✅ Trading Strategy Reference:
🔰 If gold holds above the 3745–3755 support zone, consider light long positions with targets at 3780–3785.
🔰 If gold breaks below 3745–3755, a 4-hour double-top will likely be confirmed. In this case, consider light short positions targeting 3730–3720.
🔰 If gold faces resistance at 3780–3785, short entries can be considered with targets back down to 3745–3730.
🔥Trading Reminder: Trading strategies are time-sensitive, and market conditions can change rapidly. Please adjust your trading plan based on real-time market conditions.
Traders Watch Gold Surge Ahead of Fed’s Next MoveGold 1H – Consolidation Before Fed Clarity
Gold on the 1H timeframe is currently trading around 3,746, moving within a well-defined consolidation range. Price action highlights a premium supply zone at 3,775–3,773 and a discount demand zone at 3,723–3,725. The market structure shows earlier signs of BOS and ChoCH, with engineered liquidity sweeps becoming evident. A potential Mitigation → Expansion sequence is in play, where a liquidity grab near discount demand could fuel a bullish leg toward premium supply.
From a macro perspective, today’s headlines underscore the cautious stance across financial markets as investors await the Federal Reserve’s upcoming guidance. Lingering inflationary concerns, coupled with speculation around the timing of future rate cuts, have kept volatility elevated. Meanwhile, geopolitical risks continue to underpin safe-haven demand for gold, adding an extra layer of support at discount levels.
This combination of technical liquidity zones and macro uncertainty sets the stage for tactical plays: fading moves into the supply zone while remaining prepared for dip-buying opportunities at defined demand areas.
________________________________________
📌 Key Structure & Liquidity Zones (1H):
• 🔴 SELL GOLD 3,775–3,773 (SL 3,782): Supply zone coinciding with a buy-side liquidity pool above 3,780, offering downside targets at 3,760 → 3,745 → 3,730.
• 🟢 BUY GOLD 3,723–3,725 (SL 3,718): Discount demand aligned with liquidity grab potential, with upside targets at 3,745 → 3,760 → 3,775+.
________________________________________
📊 Trading Ideas (Scenario-Based):
🔻 Sell Setup – Supply Rejection (3,775–3,773)
• Entry: 3,775–3,773
• Stop Loss: 3,782
• Take Profits:
TP1: 3,760
TP2: 3,745
TP3: 3,730
🔺 Buy Setup – Demand Mitigation (3,723–3,725)
• Entry: 3,723–3,725
• Stop Loss: 3,718
• Take Profits:
TP1: 3,745
TP2: 3,760
TP3: 3,775+
________________________________________
🔑 Strategy Note
With the Fed’s next move looming, traders should anticipate engineered sweeps into both premium and discount liquidity pools before the market establishes clearer direction. The tactical edge comes from aligning intraday setups with liquidity hunts:
• Fade supply at 3,775–3,773 if rejection confirms.
• Buy dips into 3,723–3,725 if liquidity is swept cleanly.
The broader narrative of inflation concerns, dollar sensitivity, and safe-haven flows reinforces the case for two-sided opportunities. Expect gold to remain volatile within this consolidation range, with sharp moves likely as liquidity is targeted ahead of Fed clarity.

LiamTrading – INTRADAY TRADING SCENARIO
When we look at the global financial landscape, an interesting picture emerges:
Equities – All Time High (ATH)
Housing Prices – ATH
Bitcoin – ATH
Gold – ATH
Money Supply – ATH
National Debt – ATH
CPI Inflation – averaging 4% per year since 2020, double the Fed’s “target”
Federal Reserve – continuing rate cuts this month
Clearly, easy money combined with inflationary pressure is a powerful driver pushing gold to new historical levels. This makes buying with the trend more reasonable than ever.
📊 Technical Analysis – H1 Chart
Gold is moving within a well-defined upward channel.
Volume Profile highlights the POC around 3840–3850, a key zone to watch for scalping buys.
The VAL coincides with the rising trendline near 3820–3822, offering strong confluence for medium-term buys.
If price breaks above 3895 to confirm a new ATH, trend-following buys remain the priority.
Key resistance: 3913–3915, suitable for short-term scalping sells.
🎯 Trading Scenarios
Buy scalping: 3845 | SL 3839 | TP 3856 – 3870
Buy zone (main): 3820 – 3822 | SL 3816 | TP 3832 – 3845 – 3860 – 3875 – 3890
Sell scalping: 3915 – 3913 | SL 3920 | TP 3900 – 3885 – 3872 – 3860
Buy breakout: If price breaks ATH 3895 and confirms, continue buying with the trend → Open targets towards 3915+
📌 Conclusion
Gold remains in a strong uptrend, both fundamentally and technically. Short-term pullbacks are simply opportunities to add to buy positions. However, traders should watch the immediate resistance zones to optimise entries.
👉 This is my personal outlook on XAUUSD, not financial advice.
Follow me to stay updated with the latest daily gold scenarios 🔥

Elliott Wave Analysis XAUUSD – 01/10/2025📊
________________________________________
🔹 Momentum
• D1:
Momentum is still rising but already entering the overbought zone → buying power is weakening. Price may continue to rise or move sideways in the short term, but the risk of reversal is increasing.
• H4:
Momentum is still pushing upward. Until it reaches the overbought zone and reverses, price can continue to rise or consolidate sideways.
• H1:
Momentum is moving into oversold territory and preparing to turn upward. This aligns with H4, suggesting another short-term push higher.
________________________________________
🔹 Wave Structure
• D1 Wave:
Price is still within Wave 5. Yesterday it reached the second target zone – a strong resistance area and potential top.
Once D1 momentum reverses in overbought territory, a major correction will be confirmed.
Note: If a correction occurs on D1, it will likely last longer than Wave 2 and Wave 4 → avoid catching swing bottoms too early.
• H4 Wave:
A strong drop yesterday gave sellers momentum, but price quickly recovered and is now testing highs.
With both D1 and H4 momentum showing more room to rise, price may still push higher.
→ Use the H4 price channel as a key observation tool.
• H1 Wave:
A 5-wave structure (12345 black) is forming. Wave 5 is usually the hardest to predict due to FOMO-driven buying.
As warned yesterday, long swing trades are risky. After a sharp drop, price rebounded but momentum signals weakness.
Multiple Wave 5 structures are converging near 3885, making this a high-probability reversal zone.
________________________________________
🔹 Trade Plan
• Sell Zone: 3885 – 3887
• Stop Loss: 3895
• Take Profit:
o TP1: 3830
📌 Notes:
• This is a sensitive potential top zone → volatility is usually unpredictable.
• If selling at 3885, use small position size and strict SL discipline.
• Best approach: wait for further confirmation before committing heavily.

XAUUSD – US Government Shutdown Pressure on Gold
Hello Traders,
For the first time since 2018, the US Government is facing the risk of a shutdown. This can only be avoided if Congress passes new funding legislation, but the timing remains uncertain. This political backdrop is exerting strong pressure on the financial markets, and gold – the traditional safe haven asset – has become the focal point for investors.
Technical Outlook
Gold continues to set new ATHs right in the Asian session today, indicating the uptrend remains intact.
The upward price channel on H4 maintains a beautiful structure, with the main trend continuing to favour buying.
Yesterday's dip was merely a "liquidity sweep," after which the price quickly returned to its upward momentum.
Short positions can be considered when the price hits strong resistance, combining Fibonacci + Trendline, to optimise winning probabilities.
Trading Scenario
Sell (short-term at resistance):
Entry: 3884 – 3886
SL: 3890
TP: 3872 – 3860 – 3845 – 3830
Buy (aligning with the main trend):
Entry: 3820 – 3823
SL: 3816
TP: 3835 – 3850 – 3862 – 3880
Conclusion
Gold remains strongly supported by the political instability in the US.
The medium-term strategy continues to prioritise Buying at support zones, while Selling should only be considered when there is a clear reaction at resistance zones.
Traders need to closely monitor political news, as any developments related to the US government could alter the short-term structure of gold.
Follow me for the quickest updates on new scenarios as the price path changes.

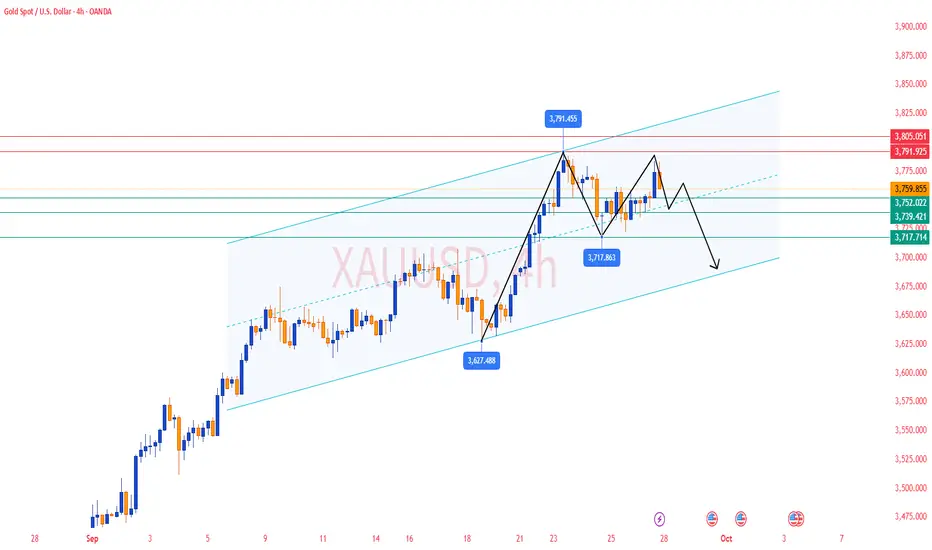
LiamTrading – Medium-term Gold Outlook H4Let's prepare the scenario for the new week, folks!
In my opinion, gold in the coming week may start to show a medium-term correction phase. However, it is important to note that nothing is absolutely certain on a larger timeframe. If you are trading intraday, stay closely aligned with price action to ensure higher accuracy.
Gold closed the weekly candle at 3759.85 – a price level that clearly indicates hesitation. The end-of-week session showed a rejection of price increase, mainly due to profit-taking pressure, so it cannot be immediately confirmed that a downtrend will begin.
The upward price channel is still strong, so it is essential to maintain a buying trend mindset to ensure the confidence in holding profits remains firm.
The upward structure is still stable, but the RSI has reflected a weakening in buying sentiment. To confirm a medium-term correction, gold needs to break 3720. At that point, a reasonable strategy would be to wait to sell around 3737–3740 (retracing to the trendline), targeting the support area coinciding with the highest volume profile cluster at 3645.
Conversely, the buying scenario will occur when:
- Price touches the 3735 boundary and a candle rejection reaction appears.
- Or gold breaks above the minor resistance at 3780, in which case you can buy immediately, with expectations towards the 3850 area.
Next week, be patient and wait for market confirmation to increase the probability of success. I will continue to share detailed scenarios in each trading session for everyone to stay updated.

XAUUSD MULTI TIME FRAME ANALYSISHello traders , here is the full multi time frame analysis for this stock , let me know in the comment section below if you have any questions , the position will be taken only if all rules of the strategies will be satisfied. wait for more price action to develop before taking any position. I suggest you keep this pair on your watchlist and see if the rules of your strategy are satisfied.
🧠💡 Share your unique analysis, thoughts, and ideas in the comments section below. I'm excited to hear your perspective on this pair .
💭🔍 Don't hesitate to comment if you have any questions or queries regarding this analysis.

Jobs vs. Inflation: Gold Steady Before PCE ShowdownHello, investors!
Gold saw only a marginal 0.1% gain, closing at $3,739.42/oz on September 25. This struggle was due to better-than-expected US jobs data (jobless claims dropped sharply), which slightly pared back the market's expectation for a Fed rate cut in October (down to 85%).
However, Gold maintains support from dovish Fed comments and potential political instability (like Trump's proposed 100% drug tariff). The entire market focus now shifts to today's (Sept 26) PCE Inflation Report.
Expert Alert: If the PCE data is hotter than anticipated, Gold could face sharp, temporary downward pressure.
Technical Analysis & Strategy
Gold is currently consolidating within a triangle pattern and has yet to break the $375x resistance. While more selling pressure is possible before the PCE release, the long-term trend remains bullish.
Outlook: Prioritize Buy if the price maintains above the Key Level $373x. If the news causes the price to break $373x, be ready to flip the strategy to Sell.
Key Resistance: $3755, $3768, $3778
Key Support: $3738, $3727, $3712
Suggested Trading Strategy (Strict Risk Management):
BUY SCALP
Zone: $3739 - $3737
SL: $3733
TP: $3742 - $3747 - $3752 - $3757 - $3767
BUY ZONE
Zone: $3704 - $3702
SL: $3694
TP: $3712 - $3722 - $3732 - $3742 - $3762
SELL ZONE
Zone: $3776 - $3778
SL: $3786
TP: $3768 - $3758 - $3748 - $3728 - $3708
The market is at a critical juncture. What is your game plan for today? 👇
#Gold #XAUUSD #PCE #Fed #Inflation #TradingView #ATH

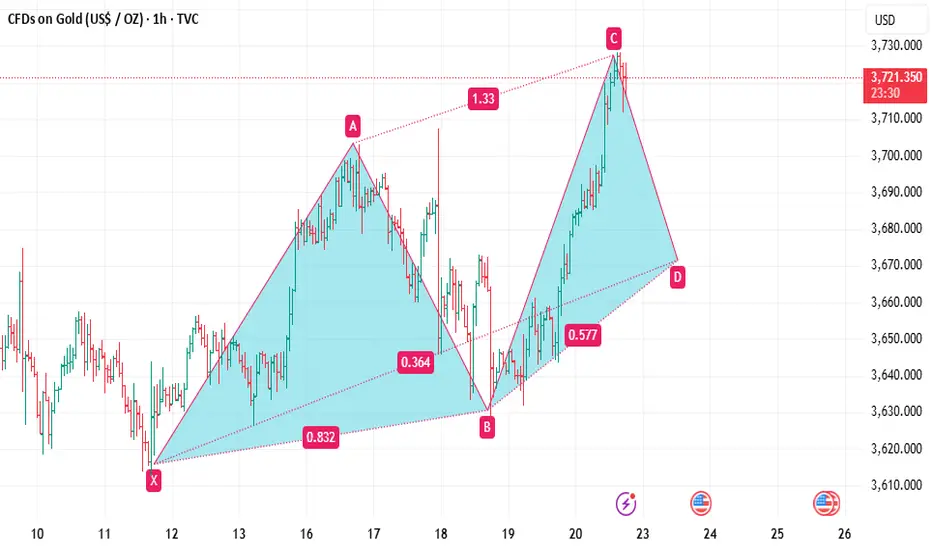
XAUUSD – Range 3735–3755 now serves as trend confirmation zoneXAUUSD – Range 3735–3755 now serves as trend confirmation zone
Technical Analysis
Gold (XAUUSD) is moving within a narrow range of 3735–3755, and this price zone currently acts as a “pivot point” to confirm the next direction.
Short-term resistance: 3755–3772, price has reacted strongly multiple times. If not decisively broken, selling pressure may continue.
Key support: 3735, this is the decisive zone – breaking it will confirm a downward trend, targeting lower levels.
Stronger resistance: 3790–3793, confluence of several previous peaks, where strong selling pressure may form.
EMA200 H1 (3723) still supports the major uptrend, but the price has moved far and is now in the phase of retesting supply – demand zones.
RSI (14) around 45–48, not yet in oversold territory but leaning towards the sellers.
From a technical perspective, this is a market phase that requires confirmation: breaking above 3755 will reopen the upward momentum, while losing 3735 will reinforce short-term downward pressure.
Trading Scenarios
Sell Scenario (preferred if resistance holds):
Sell 3769–3772, SL 3775, TP: 3755 – 3746 – 3737
Sell 3791–3793, SL 3798, TP: 3783 – 3772 – 3760 – 3745
Sell when price confirms below 3735, SL 3742, TP: 3726 – 3715 – 3702 – 3690
Buy Scenario (trend-following on breakout):
Buy when price confirms above 3755, SL 3747, TP: 3766 – 3778 – 3790
Buy 3705–3702, SL 3697, TP: 3717 – 3726 – 3744 – 3763 – 3780 – 3790
Price Zones to Watch
3735–3755: trend confirmation range, most important in the short term.
3769–3772 and 3791–3793: strong resistance zones, potential Sell zone.
3702–3705: deep Buy zone, combined with strong support and EMA200.
3790: key resistance level, breaking it will reinforce the major uptrend.
Outlook
The gold market is in a decisive phase at the 3735–3755 range. Sellers have a short-term advantage, but if the price exceeds 3755, the uptrend may soon return. The best strategy is to trade based on price confirmation at key zones, combining profit-taking at each successive TP level to optimise gains.
This is a reference scenario based on technical analysis, not an investment recommendation. Stay tuned for earlier analyses in upcoming sessions.

BUYER FOMO: BREAK ALL THE RULES📌 GOLD – Trading Plan OANDA:XAUUSD
Follow Signals On weekend Linda published you got SELL PLAN 3720 +120PIPS
Absolutely that up first down after:
1. Market Context (H1)
Main trend: Bullish (following several upward BOS).
The price has just broken the peak and created new liquidity above the 3715 – 3720 zone.
Below, there are CP Orders + FVG at 3693 / 3669 / 3650 → the price may retrace to test demand before continuing to rise.
Above: the 3749 – 3750 zone is a strong resistance, likely to see liquidity sweeps.
2. Main Scenario – BUY with the trend
Entry 1: CP ORDER + Trend Timing
Zone: 3693 – 3695.
Stoploss: 3685.
TP1: 3715.
TP2: 3730+.
R:R ratio: ~1:3.
Entry 2: Deeper CP ORDER
Zone: 3669 – 3670.
Stoploss: 3660.
TP1: 3710.
TP2: 3730+.
R:R: ~1:4.
Entry 3: Final FVG
Zone: 3650 – 3655.
Stoploss: 3640.
TP: 3710 – 3720.
This is the final entry; if it breaks, consider the trend reversed.
3. Alternative Scenario – SELL counter-trend (scalp)
Entry Sell
Zone: 3749 – 3750 (resistance + liquidity).
Stoploss: 3757.
TP1: 3730 – 3735.
TP2: 3695 – 3670 (if selling pressure is strong).
Confirmation required on M5/M15:
MSS down.
Bearish engulfing.
Long wick rejection.
4. Capital Management
Total risk for the day: max 3 – 4% of the account.
Each trade risk 1 – 1.5%.
Prioritize Buy, Sell is just a small scalp.
If the price hits TP1 → move SL to entry, let the rest run.
5. Notes
Main trend: Bullish, don't attempt too many counter-sells.
Only sell when clear signals appear at 3749 – 3750.
The 3693/3669 mark is a key zone → if it breaks strongly, wait for trend confirmation.

Part 2 Ride The Big Moves 1. Option Pricing and Valuation
Option prices are determined by two main components:
1.1 Intrinsic Value
The difference between the current price of the underlying asset and the option’s strike price.
1.2 Time Value
The remaining portion of the premium, reflecting time until expiration and volatility. Options with longer time to expiration usually have higher time value.
1.3 Factors Affecting Option Prices
Underlying Asset Price: Movement in the underlying asset directly affects the option’s value.
Strike Price: Determines whether the option is ITM, ATM, or OTM.
Time to Expiration: Longer expiration provides higher flexibility and premium.
Volatility: Higher volatility increases option premiums.
Interest Rates: Rising interest rates can increase call option values and decrease put option values.
Dividends: Expected dividends reduce the value of call options.
1.4 Option Pricing Models
Black-Scholes Model: Widely used for European options, factoring in asset price, strike price, time, volatility, and risk-free rate.
Binomial Model: Flexible and suitable for American options, where early exercise is possible.
2. Risk and Reward in Options Trading
2.1 Risk for Option Buyers
The maximum risk for buyers is limited to the premium paid. If the market moves unfavorably, the option can expire worthless, but the loss cannot exceed the initial investment.
2.2 Risk for Option Sellers (Writers)
Sellers face potentially unlimited risk:
For a call writer without owning the underlying asset (naked call), losses can be infinite if the asset price rises sharply.
For put writers, losses occur if the asset price falls significantly below the strike price.
2.3 Reward Potential
Buyers have unlimited profit potential for calls and substantial profit for puts if the market moves favorably.
Sellers earn the premium as maximum profit, regardless of market movement, assuming they manage positions correctly.
3. Hedging and Speculation Using Options
3.1 Hedging
Options are a powerful tool for risk management. For instance:
Investors holding a stock can buy put options to protect against downside risk.
Traders can use options to lock in profit targets or minimize losses.
3.2 Speculation
Speculators use options to capitalize on market movements with limited capital. Examples:
Buying calls to profit from an anticipated rise.
Buying puts to profit from an anticipated fall.
Using complex strategies to exploit volatility or time decay.
4. Options in Different Markets
4.1 Stock Options
Options on individual stocks are most popular and widely traded. They provide leverage and hedging opportunities.
4.2 Index Options
Options on market indices like Nifty or S&P 500 allow traders to speculate on broader market trends.
4.3 Commodity Options
Used in commodities markets like gold, crude oil, and agricultural products for hedging or speculation.
4.4 Currency Options
Provide protection or speculation opportunities in the forex market against currency fluctuations.

Why Gold and US Bonds Move Together!Hello Traders!
If you follow global markets, you’ll notice that Gold and US Bonds often move in the same direction.
When one rises, the other usually does too. But why does this happen? Let’s understand the link in simple words.
1. Both Are Seen as Safe Havens
In times of uncertainty, whether it’s recession fears, geopolitical tension, or market crashes, investors rush towards safety.
Gold is considered a timeless store of value.
US Bonds are backed by the US government, making them the safest fixed-income asset globally.
So, in panic situations, both attract inflows together.
2. Driven by Interest Rates & Inflation
When inflation rises or central banks cut interest rates:
Bond yields fall, but bond prices rise as investors lock in fixed returns.
At the same time, low yields make gold more attractive since the “opportunity cost” of holding it decreases.
That’s why both often rally when interest rates are falling.
3. Dollar Weakness Adds Fuel
Both gold and US bonds are influenced by the US dollar.
A weaker dollar makes gold cheaper for global buyers, pushing prices up.
Foreign investors also buy US bonds when the dollar weakens, supporting bond demand.
4. Why Traders Must Watch This Correlation
If both gold and US bonds are rising, it usually signals fear and risk-off sentiment in global markets.
If both are falling, it often reflects rising risk appetite, money moving back into equities.
This correlation can help you gauge global market mood even before equities react.
Rahul’s Tip:
Don’t just watch Nifty in isolation. Keeping an eye on gold and US bonds can give you early clues about global risk sentiment. It’s like reading the heartbeat of safe-haven flows.
Conclusion:
Gold and US bonds move together because they serve the same purpose, safety in uncertain times .
Understanding this relationship can help you read the bigger picture and prepare for market shifts more confidently.
If this post helped you connect the dots, like it, share your views in comments, and follow for more global market insights!