XAUUSD – The Weakness of Gold – Are Investors Ready?Gold is being heavily impacted by the strengthening of the US dollar, driven by recently released economic data from the US. A strong increase in employment and a 2.5% GDP growth show that the US economy is growing stronger than expected, pushing the US dollar higher and creating downward pressure on gold.
The chart shows that gold is trading within a downward price channel, with key support and resistance levels already identified. The strong resistance at 3,345 USD continues to be a major challenge for any upward movement in gold.
If gold cannot break through these resistance levels and continues to decline below 3,310 USD, we may see a deeper correction.
GOLDCFD trade ideas

XAU/USDThis XAU/USD trade setup is a buy trade, showing a bullish view on gold. The entry price is 3288, the stop-loss is 3278, and the exit price is 3327. This setup aims for a 39-point gain while limiting the risk to 10 points, which gives a strong risk-to-reward ratio of nearly 1:4.
Buying at 3288 suggests that the trader expects gold prices to rise due to favorable market conditions, such as a weaker US dollar, lower bond yields, or increased demand for gold as a safe-haven asset during economic uncertainty. The target at 3327 is likely set near a resistance level where profit can be booked once the price moves upward.
The stop-loss at 3278 protects the trader from excessive losses if the market reverses and moves downward. Since the stop-loss is tight, the trade requires close monitoring, and it is best executed during periods of strong bullish momentum in gold.
With disciplined risk management and strict adherence to the plan, this trade offers a good opportunity to profit from short-term price movement. Sticking to the entry, stop-loss, and target levels without emotional trading increases the chances of consistent success.

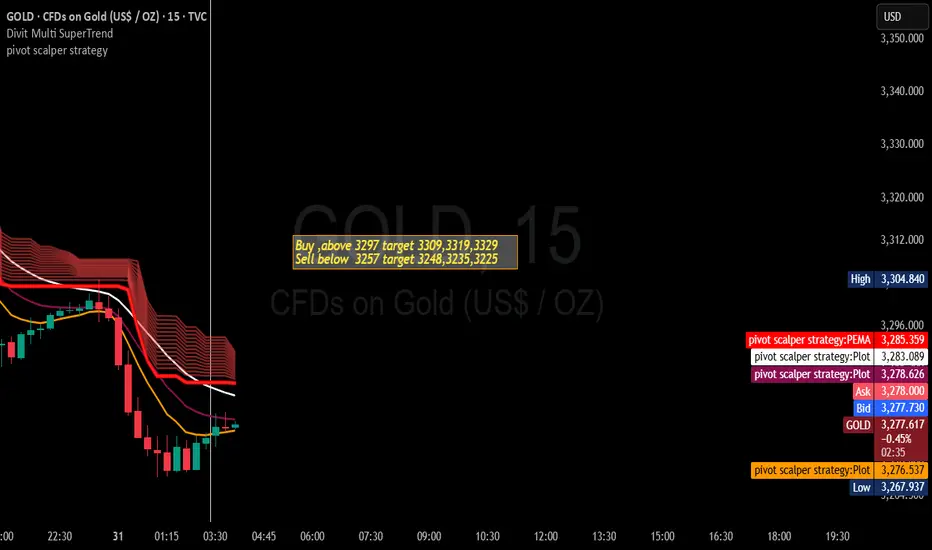
Gold Trading Strategy for 31st July 2025📊 GOLD TRADING IDEA
💰 Buy Setup:
Entry: Buy above the High of the 15-min candle (Close above $3297)
Targets: 🎯 $3309 | $3319 | $3329
Stop Loss: Below the breakout candle low
📉 Sell Setup:
Entry: Sell below the Low of the 15-min candle (Close below $3257)
Targets: 🎯 $3248 | $3235 | $3225
Stop Loss: Above the breakdown candle high
⚡ Trading Tips:
Confirm 15-min candle close before entering.
Follow the trend; avoid trading in sideways markets.
Risk management: Do not risk more than 1–2% of your capital.
Trail profits as the trade moves in your favor.
⚠️ Disclaimer:
This is only for educational purposes and not financial advice.
Commodity trading is highly risky. Trade at your own risk.
Gold breakdown?After a prolonged uptrend, gold has formed a triangle at the top and on the verge of breakdown. if breaks today and follows on Monday, can give a decent move
XAUUSD
ALWAYS TAKE TRADE WITH CONFIRMATION
Note : Trading in any financial market is very risky. I post ideas for educational purpose only. It is not financial advice. Do not hold us responsible for any potential loss you may incur. Please consult your financial adviser before trading.

GOLD: Is This a Bottom or the Calm Before the Storm?🌐 Fundamental & Macro Landscape
The recent US–EU trade and defense pact has temporarily reduced gold’s appeal as a safe haven.
The US Dollar and stock markets remain strong thanks to positive macroeconomic data.
Current sentiment is risk-on, which typically shifts capital away from metals and into riskier assets.
But the real volatility could come later this week:
📅 High-Impact Events to Watch:
US ADP Employment Report
FOMC Statement + Nonfarm Payrolls (NFP)
These will likely decide whether gold resumes its uptrend or continues sliding lower.
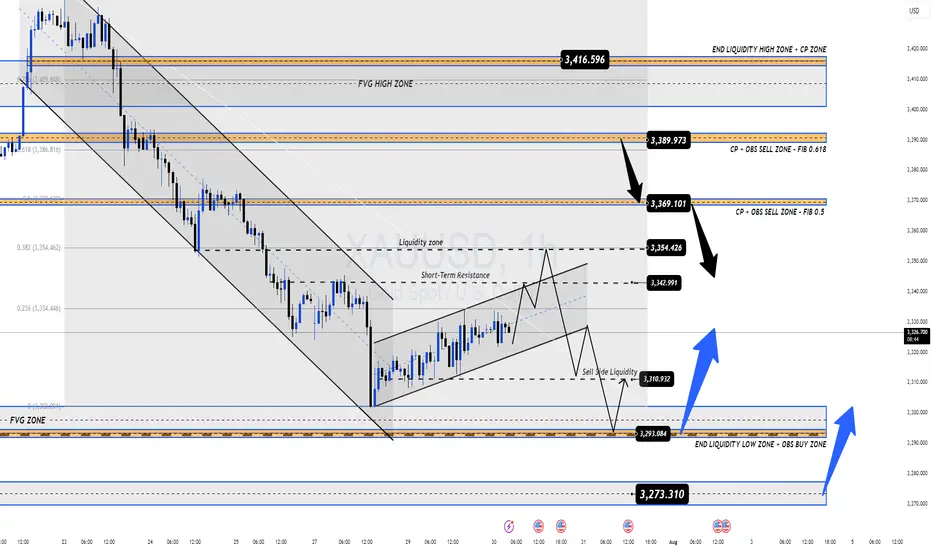
📊 Technical Outlook (H1–H4)
Gold is currently trading within a parallel bullish channel after rebounding from local lows.
However, price is now approaching a key resistance zone around 3342, where we might see either a breakout or a rejection, depending on market sentiment during the upcoming data releases.
🔍 Key Price Zones
🔺 Short-Term Resistance: 3342
🔺 Major Supply Zone: 3369–3388 (Order Block + FVG + Fib 0.5–0.618)
🔻 High-Liquidity Demand Area: 3293–3290
🔻 Deep Demand Zone (FVG): 3275–3273
🔺 Long-Term Resistance Target: 3416
📈 Trade Plan – Based on Price Reaction, Not Prediction
The best trades come from waiting for the right reaction at key zones. No chasing. No guessing.
✅ Scenario 1 – Buy the Dip (Scalp Setup)
Entry: 3293 – 3291
Stop Loss: 3286
Targets: 3296 → 3300 → 3304 → 3308 → 3312 → 3315 → 3320 → 3330
🟢 Works well in high-liquidity zones for quick short-term gains.
✅ Scenario 2 – Buy from Deeper Support (Swing Setup)
Entry: 3275 – 3273
Stop Loss: 3269
Targets: 3280 → 3284 → 3288 → 3292 → 3300 → 3305 → 3310 → 3320 → 3330
🟢 Great setup if price absorbs selling pressure and reverses from FVG demand.
❌ Scenario 3 – Short from Short-Term Resistance
Entry: 3340 – 3342
Stop Loss: 3346
Targets: 3335 → 3330 → 3325 → 3320 → 3310
🔴 Valid only if price fails to reclaim above 3342.
❌ Scenario 4 – Short from Major Supply Zone
Entry: 3369 – 3372
Stop Loss: 3376
Targets: 3365 → 3360 → 3355 → 3350 → 3345 → 3340 → 3330 → 3320
🔴 Higher risk – only act after confirmation (e.g., rejection wicks or bearish candle pattern).
⚠️ Risk Management Tips
Avoid entering right at London or New York opens – too much volatility and false breakouts.
Always wait for confirmation (candle rejection, pin bars, engulfing, etc.).
Use strict stop-loss rules – FOMC + NFP can spike price in both directions.
💡 Final Tips for Indian Traders
Trade with patience – the best setups often appear when others are panicking.
Respect your capital – don’t overleverage during high-volatility news events.
Focus on price action – not emotions or fixed bias.
📌 If you found this gold analysis helpful, feel free to drop your thoughts in the comments or follow for daily updates on XAU/USD.
Let’s grow and trade smarter, one setup at a time.
Namaste 🙏 | Trade safe, trade with clarity.
Today's Gold Price: (3280-3290) Be Cautious About Bottom-fishing
Today's Gold Price: (3280-3290) Be Cautious About Bottom-fishing
Today's gold price volatility was another lethargic day.
It oscillated back and forth between 3300 and 3330.
Like a loom, it was a lethargic experience.
In fact:
This market trend is typical of gold's volatility.
It suggests that significant news will be released today.
Buyers are reluctant to buy in large quantities.
Shorts are reluctant to sell in large quantities.
Everyone is waiting and watching.
Once news and market sentiment emerge, we will choose a new direction.
As shown on the 4-hour chart,
the area around 3330 has become a strong resistance zone.
The area around 3300 has become a temporary resistance zone.
The area around 3280 has become a strong support zone.
However, it is worth noting that when this ascending triangle descends, trading volume increases, indicating active selling.
Gold prices are rising, but trading volume is shrinking.
This clearly shows that the funds driving gold prices are not currently active enough.
This suggests that the current bullish momentum has yet to fully develop.
Bulls remain weak and wary of bears.
As a result, everyone awaits today's release of a small amount of non-farm payroll data and the Federal Reserve's interest rate decision.
I expect the Fed to adopt a more dovish stance this time, meaning that while they won't cut rates immediately, they will hint at a rate cut later this year.
Gold prices are likely to continue to fluctuate widely.
Trading Strategy:
Support: $3,280/$3,290
Resistance: $3,330/$3,300
Aggressive Strategy:
Sell Price: $3,295-$3,300
Stop Loss: $3,305
Target Price: $3,280-$3,280
Conservative Strategy:
Sell Price: $3,320-$3,330
Stop Loss: $3,335
Target Price: $3,300-$3,280
Bottom Picking Strategy: (Cautious)
Buy Price: $3,280-$3,290
Stop Loss: $3,275
Target Price: $3,330/$3,350

GOLD SELL TRADE SETUPHere’s a clean TradingView article draft for your Gold (XAU/USD) idea — written in proper format, with prices exactly as you mentioned:
🟡 GOLD (XAU/USD) – 4H Downtrend | Sell Setup in Premium Zone
🔍 Market Context
Gold remains in a clear 4H downtrend, making lower highs and lower lows.
Currently, price has retraced into a premium zone, aligning with:
Fibonacci retracement area (3352 – 3380)
4H Order Block (OB)
Fair Value Gap (FVG)
This confluence makes it a strong area to watch for potential short trades.
✅ Trade Plan
Sell Zone: 3352 – 3380 (OB + FVG + Fib confluence)
Execution: Wait for lower timeframe confirmation (Break of Structure / bearish candle displacement) before entry
Stop Loss (SL): Above 3385 (to stay safe from liquidity sweeps)
Targets (TP):
TP1: 3320
TP2: 3300
TP3: 3285 (extended target)
⚠️ Risk Note
This is a trend-continuation setup.
Avoid early entries — only execute if bearish confirmation appears in LTF.
Always follow strict risk management.

Elliott Wave Analysis – XAUUSD | July 30, 2025📊
🔍 Momentum Analysis
• D1 Timeframe: Momentum has started to reverse upward, but we need to wait for today’s daily candle to close for confirmation. Until then, there is still a risk of another short-term decline.
• H4 Timeframe: Momentum lines are clustering in the overbought zone, signaling a possible weakening of the current upward move. However, this signal alone is not enough to confirm that the uptrend has ended.
________________________________________
🌀 Wave Structure
• Price has reached the projected target for wave e, but there has been no strong bullish reaction. The recent candles are short-bodied and overlapping – typical of corrective structures. Also, this wave has lasted longer than previous corrective upswings, suggesting that the decline may not be over yet and the wave count needs to be reviewed.
Currently, we are facing two equally probable scenarios (50/50), but they suggest opposite outcomes:
➤ Scenario 1: Zigzag (5-3-5) Structure
• The current structure may represent only wave A of a larger zigzag.
• We are now in wave B, which tends to be complex and unpredictable, making it not ideal for wave-based trading.
• The red zones marked on the chart indicate potential target areas for wave B.
➤ Scenario 2: Completed 5-Wave Correction
• The downtrend may have completed at wave (e).
• The current upward movement could be wave 1 forming as a triangle – a potential start of a new bullish cycle.
• However, to confirm this scenario, price must hold above 3309. If it fails to do so and H4 momentum reverses downward, a new low is very likely.
________________________________________
📝 Trading Plan
Given the current market conditions, I only recommend short-term scalp trading based on the predefined support and resistance zones.
Avoid wave-based trading until the structure becomes clearer. Once clarity returns, I will provide an updated trading plan.

GOLD 1H Analysis🔹 After a sharp bearish leg, Gold is currently consolidating inside a rising wedge pattern on the 1H timeframe — a classic bearish continuation setup.
🔍 Technical Breakdown:
Pattern: Rising Wedge (typically breaks down)
Structure: Lower highs and higher lows forming tight price action
Price Rejection Zone: Around ₹3,321 – ₹3,334
Support Zone: ₹3,308 – ₹3,299 (critical breakout region)
🎯 Key Levels:
Resistance: ₹3,334 (Wedge Top), ₹3,321
Immediate Support: ₹3,308 → ₹3,299
Bearish Targets:
TP1: ₹3,266
TP2: ₹3,223
🧠 Trading Idea:
📉 If price breaks below ₹3,308 with strong volume or bearish momentum, we may see a sharp move toward the lower green zones.


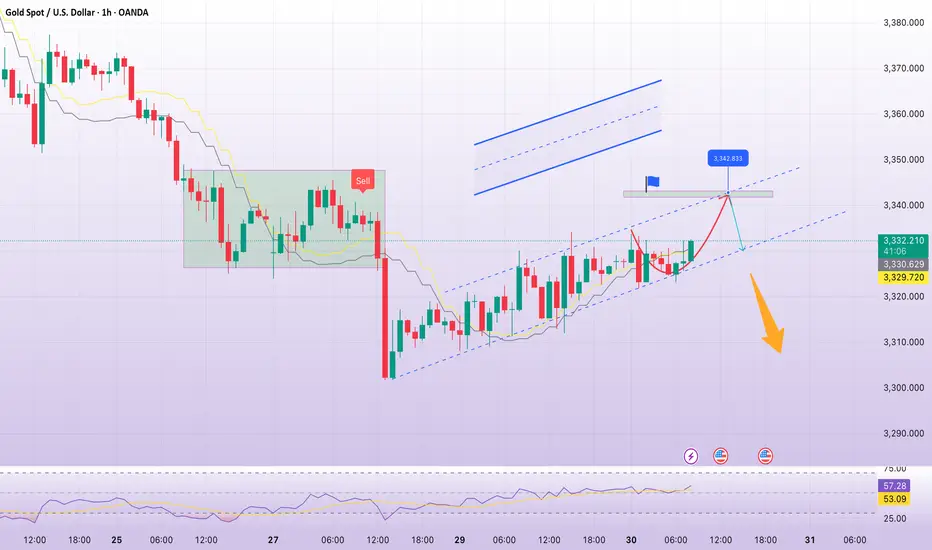
Gold price drops with FOMC today: 3342Plan XAU day: 30 July 2025
Related Information:!!!
Gold prices (XAU/USD) remain confined within a narrow range around the $3,325 level during the Asian session on Wednesday, struggling to extend the previous day's modest gains. Persistent market caution ahead of a pivotal central bank event lends some support to the safe-haven precious metal. In addition, a slight retreat in the US Dollar (USD) from a more than one-month high reached on Tuesday could provide an added boost to gold prices.
That said, upside potential appears limited, as investors exhibit restraint and await further clarity on the Federal Reserve's (Fed) monetary policy trajectory before making directional commitments. Meanwhile, the prevailing consensus that the Fed will maintain higher interest rates for an extended period is likely to prevent a significant USD pullback. Coupled with renewed trade optimism, these factors may continue to cap any meaningful gains in the XAU/USD pair
personal opinion:!!!
Gold price accumulated and compressed since the beginning of the week. Waiting for today's interest rate announcement. Decreased back to 3300.
Important price zone to consider : !!!
resistance zone point: 3342 zone
Sustainable trading to beat the market
Live : XAUUSD - TP hit - 30th July Session : Pre London / London Open
A green candle formed support,
Anticipated 1 hour candle wick fill
entered Long position ,
Closed with 1:1 tp
Happy Trading .!

XAUUSD (GOLD ) BO STRUCTURE SHORT TERMCurrently, the price is hovering near the mid-support box (~3300 zone) with a small bullish candle, indicating a possible bounce. The two blue arrows highlight potential scenarios:
A bullish breakout towards the upper resistance zone (~3427), if price holds and reverses upward from current support.
A bearish breakdown towards the lower support (~3201), if price breaches the current demand zone.

Gold price analysis before FOMC Looking at current price action, after sharp decline we witnessed earlier. Gold has found support around the monthly open level between 3300-3310, which is acting as a solid support zone right now. now price is attempting to climb higher with the help of ascending trendline, but it's running into resistance at the weekly open around 3329-31.
If we can see a clean breakout above this weekly resistance, I'd expect gold to make a move toward the 3350 level as the next logical target. Beyond that, we've got the pivot at 3367 which will likely serve as a stronger resistance barrier. On the downside, our immediate support remains at that trendline, with the major support zone at 3300 acting as our safety net.
Today's Fed interest rate decision is the major market mover event;;that could dictate gold next directional move. Personally, I'm leaning toward seeing some upward momentum today, but the real test will be whether price can hold those higher levels or if we'll see rejection and another leg down. The key is watching how gold reacts to whatever the Fed delivers and whether buyers can step in with conviction at these elevated levels. It's definitely a day to stay alert and let the market show its hand before making any big moves.

xau/gold get ready taken onxau/gold on AMD mode once compelete the accumulation when market trigger manipulation and start bullish... wait and watch today economic news night fed rate and fomc statement .once economic data release after take trade

Gold rebounds – Enough to shift the trend?Gold is trading within an ascending channel, recently bouncing modestly from the trendline after a series of declines. The structure suggests XAUUSD could continue a technical rebound toward the resistance zone near 3,374 before a new trend is confirmed.
On the news front, JOLTS job openings came in slightly below expectations, indicating a cooling U.S. labor market. This offers mild support for gold, as the Fed may consider easing policy sooner. However, with the figure still above 7 million, the impact remains short-term.
Strategy: Watch price reaction near the 3,374 zone. If it fails to break through, the bearish scenario remains dominant. Short-term buying may be considered as long as the trendline holds.

This is in SR Intrchange area.. after this it should support this level otherwise it will fall to its liquidity or OB area

Gold Trading Strategy for 30th July 2025📊 GOLD (XAU/USD) INTRADAY PLAN
🟢 BUY SETUP – Buy Above the High
✅ Condition:
Identify the latest 1-hour candle.
Buy only if the price closes above the high of that candle (above 3334).
⏳ Entry Timing: Enter after candle closes above the high.
🎯 Target Levels:
3344 – Book partial profit
3355 – Continue holding if trend is strong
3366 – Final target if bullish momentum continues
🛡️ Stop Loss (SL):
Place below the same 1-hour candle’s low.
⚡ Tip: Wait for a strong breakout candle to avoid false entries.
🔴 SELL SETUP – Sell Below the Low
✅ Condition:
Identify the latest 1-hour candle.
Sell only if the price closes below the low of that candle (below 3308).
⏳ Entry Timing: Enter after candle closes below the low.
🎯 Target Levels:
3298 – Book partial profit
3287 – Hold if bearish trend continues
3276 – Final target if heavy selling continues
🛡️ Stop Loss (SL):
Place above the same 1-hour candle’s high.
Tip: Confirm with volume spike or trend direction before shorting.
💡 GENERAL INSTRUCTIONS:
📌 Always wait for candle close to avoid fake breakouts or breakdowns.
📊 Confirm with RSI/MACD for better accuracy.
⏱️ Focus on London & New York sessions for higher volatility in gold.
💰 Risk Management: Risk 1-2% of capital per trade and use trailing SL for safety.
⚠️ DISCLAIMER:
Trading Gold and other commodities involves significant risk and is not suitable for all investors.
The above levels are for educational purposes only.
Always do your own analysis and use strict stop-loss to protect your capital.

Today's Gold Price: Short at HighsToday's Gold Price: Short at Highs
As shown in the chart:
Rebound Short Strategy
Resistance: 3330-3350
Support: 3310
Technical Analysis:
1: As long as the gold price is below 3330, the market is bearish.
2: As long as the gold price is below 3350, the market is short.
3: As long as the gold price is above 3300, the long position is to buy on dips.
Specific Strategy:
Aggressive Strategy:
Sell: 3325-3330
Stop Loss: 3335
Target Price: 3310
Conservative Strategy:
Sell: 3340-3350
Stop Loss: 3355
Target Price: 3330-3310
Bottom Picking Strategy:
Buy: 3300-3310
Stop Loss: 3290
Target Price: 3350+/3400+

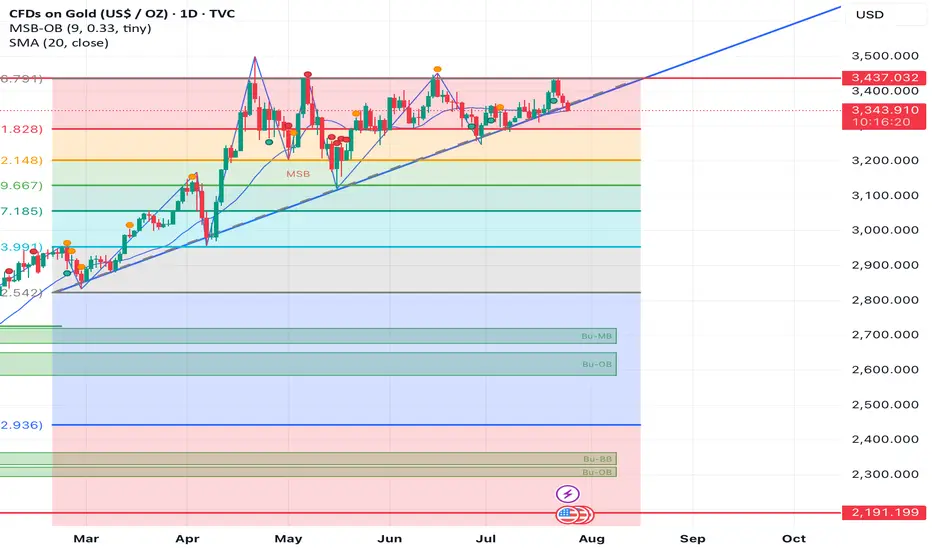
Rising wedge with equal highs| Aspect | **2016 Chart** (Image 2) | **2025 Chart** (Image 1) |
| ----------------- | --------------------------------- | ------------------------------------ |
| Pattern Type | Rising wedge with **lower highs** | Rising wedge with **equal highs** |
| Key Resistance | \~\$1,370 zone (flat top) | \~\$3,465 zone (flat top) |
| Trendline Support | Broken around \~\$1,315 | Just **testing break** at \~\$3,310 |
| Retest Zone | \~\$1,325–\$1,340 (small bounce) | Likely retest \~\$3,250–\$3,300 zone |
| Fall Target | \~\$1,200–\$1,150 zone | Targeting \~\$2,960 and below |

Gold Extends Correction, Retests $3300, Struggles to Clear $3332Gold extends downward correction reaching 3301 yesterday evening which is a tad below 61.8% Fibonacci zone and starts bounce back off the lows reaching immediate resistance 3330.
Price is currently consolidating above immediate support 3313 which if breaks, expect further decline towards retest of 3300 and extend downward correction to next leg lower 78.6% Fibonacci zone at 3291 and 3286
Gold rebound requires break and stability above 3332 which next targets 3342 followed by 3352 while next major resistance sits at 3365-3368
Note: As long as Gold maintains stability above local demand zone 3313, there's technical factors indicate possible rebound possibilities

Breaking 3322, gold price continues to recoverPlan XAU day: 29 July 2025
Related Information:!!!
Gold prices (XAU/USD) advance to a new intraday high during the first half of the European session on Tuesday, recovering from the nearly three-week low around the $3,300 level reached the previous day. As market participants absorb the latest wave of trade-related optimism, lingering uncertainty ahead of this week’s key central bank events and high-impact US macroeconomic releases continues to lend support to the safe-haven precious metal.
At the same time, the US Dollar (USD) has eased slightly from its highest level since June 23, providing an additional tailwind for gold. Nonetheless, the increasingly widespread expectation that the Federal Reserve (Fed) will maintain elevated interest rates for an extended period is likely to limit any significant USD correction. Consequently, this may act as a headwind for the XAU/USD pair as attention turns to the highly anticipated FOMC meeting set to commence later today.
personal opinion:!!!
Gold price recovered, broke 3322. Good buying power, continued to recover and accumulate above 3300
Important price zone to consider : !!!
Support zone point: 3322, 3302 zone
Sustainable trading to beat the market
