Go long on gold, but be wary of potential declines.Go long on gold, but be wary of potential declines.
Spot gold prices have hit consecutive record highs in the past hour. This strong rally is primarily driven by the following factors:
1: The market currently prices a 91.9% probability of another Fed rate cut in October. This expectation will depress the US dollar and real yields, thereby increasing gold's appeal.
2: Friday's release of US core PCE inflation data will be a key factor. If the data shows slowing inflation, it will further reinforce expectations of rate cuts, which will benefit gold.
Key Support: Safe-Haven Demand: Ongoing geopolitical risks and global economic uncertainty are driving investors to allocate gold as a safe-haven asset.
Currency Market Signals: Gold's rise is primarily driven by demand from central banks and Asia, while Western investors are also increasing their gold holdings through channels such as gold ETFs.
Simply put, the current gold market presents a situation where "long-term logic is sound" and "short-term technical overbought" coexist.
Key Strategy: Follow the trend, but be wary of pullbacks.
The current market trend is bullish, so the strategy should primarily focus on buying dips, avoiding blindly speculating on tops and shorting. However, we must also be prepared for possible technical pullbacks.
Buy on Dips (Primary Strategy)
This strategy is suitable for entering the market when gold prices moderately retreat from their highs and find support before rising again.
Timing of Entry:
Best entry: When prices retreat to the $3705-3710 area (strong support during the Asian and European trading sessions) and a bullish candlestick pattern (such as a hammer or bullish engulfing candlestick pattern) appears on the 5-minute or 15-minute chart.
Second option: Enter after a strong breakout above the previous intraday high (such as $3726), and a minor pullback confirms this move.
A more conservative option: Enter if prices experience a deep pullback to the more critical support level of $3685-3695 (the resistance-turned-support level broken yesterday), then stabilize and rebound.
Stop-loss Setting:
Set your stop-loss $5-8 below your entry price. For example, if you go long at $3710, set your stop-loss at $3702.
The absolute bottom line: Stop-loss should not be set below $3673 (the bull-bear watershed). If it falls below, the short-term trend may weaken.
Target Price Levels:
First target: $3730-3735 (a new all-time high to attract buying).
Second target: $3740-3750 (a psychological round number).
Use a trailing stop: As the price moves in your favor, gradually raise your stop-loss to protect your profits.
Data Risk: Friday's US core PCE price index is the biggest variable.
GOLDCFD trade ideas

XAUUSD – Gold Trading Plan: Fresh Record Highs & Fibo Zone React📊 Market Context
Gold regained strong bullish momentum on Monday, surging to a new record high above 3,720 USD/oz. The Fed’s dovish outlook, signaling the possibility of two additional rate cuts this year, continues to support non-yielding assets like gold. At the same time, geopolitical risks remain a tailwind for safe-haven demand.
🔢 Technical Analysis (H2)
Immediate Resistance / SELL Zones:
3,818.769 – Key reaction zone where sellers may defend aggressively.
3,754.890 – Secondary SELL zone reaction area for short-term pullbacks.
Mid-Level Support / BUY Zone:
3,694.521 – First key area to watch for dips and potential buy reactions.
3,660.130 – Stronger support level if price pulls back deeper.
Major BUY Zone Reaction:
3,583.663 – Critical confluence of structure and Fibonacci support, a potential bounce zone if a major correction unfolds.
📈 Suggested Trading Scenarios
1️⃣ Bullish Continuation Setup
BUY: Look for pullbacks to 3,694–3,660 with bullish candlestick confirmation.
Targets: 3,754 → 3,818, leave partial position open if momentum breaks higher.
Stop Loss: Below 3,645 for safer positioning.
2️⃣ Countertrend SELL Setup
SELL: Enter short at 3,754–3,818 zones only with strong rejection signals.
Targets: 3,694 → 3,660, trail stops aggressively to lock profits.
3️⃣ Deep Correction Opportunity
BUY: If price flushes to 3,583–3,585, consider scaling into longs.
Targets: 3,660 → 3,754, aligning with the broader uptrend.
⚠ Key Trading Notes
Expect increased volatility with Fed guidance and ongoing geopolitical risks.
Use smaller position sizes near resistance zones and employ stop-loss discipline.
Avoid mid-range entries; focus on well-defined zones for optimal risk-to-reward setups.
💬 Community Discussion
📊 Will gold sustain its rally toward 3,818 or see a deep pullback before another leg higher? Share your charts and insights below so we can compare strategies!

Gold's Rally Continues: Why a Fed Cut Isn't Slowing It DownHello, traders!
Gold started the new week on an impressive note, trading at $3,685 in early Monday's session. The main drivers are the market's continued reaction to the Fed's recent rate cut and escalating geopolitical events. So, the big question is, how far will this rally go?
Fundamental Analysis: Why Is Gold Still Soaring?
Although the Fed cut interest rates by 0.25%—the first time in 2025—Chair Jerome Powell maintained a cautious stance, calling it a "risk management cut." While this initially caused some market jitters, in the long run, lower interest rates are a strong supporting factor for gold.
Lower Rates: They reduce the opportunity cost of holding gold, which is a non-yielding asset.
Geopolitical Tensions: Conflicts in Ukraine and the Middle East are escalating, boosting safe-haven demand. Ukrainian President Zelenskyy reported that Russia carried out a major drone and missile attack, reaffirming gold's role as a protective asset against global risks.
Technical Analysis: Breaking Resistance, The Uptrend Continues
Gold had a powerful rally at the start of the week, successfully breaking the key resistance zone at $370x. The price is currently hovering around $3720 with a slight correction, but the uptrend remains firmly intact.
Outlook: Given the strong upward momentum, short-selling (going short) with a tight stop-loss is extremely risky. We will continue to prioritize long positions (going long) as long as gold holds above the $370x level.
Suggested Trading Strategy (Strict Risk Management):
BUY SCALP
Zone: $3413 - $3711
SL: $3407
TP: $3716 - $3721 - $3726 - $3731 - $3741
BUY ZONE
Zone: $3700 - $3798
SL: $3790
TP: $3708 - $3718 - $3728 - $3738 - $3758
SELL ZONE
Zone: $3734 - $3736
SL: $3744
TP: $3726 - $3716 - $3706 - $3796 - $3779
The market is showing unpredictable volatility. Can gold overcome all barriers and set new records? Share your opinion in the comments below! 👇
#Gold #XAUUSD #Fed #GoldAnalysis #TradingView #FinancialMarkets #TechnicalAnalysis #GoldTrading #USD #Geopolitics
Gold (XAUUSD) Technical Analysis – September 22, 2025Gold (XAUUSD) technical analysis: Strong buy signal at $3,706. Support levels, resistance targets, stop loss strategy. September 2025 trading guide.

Part 3 Learn Institutional Trading1. Introduction to Option Trading
Option trading is one of the most fascinating areas of financial markets. Unlike buying shares of a company, where you directly own a piece of the business, option trading gives you the right but not the obligation to buy or sell an underlying asset (like stocks, indices, currencies, or commodities) at a specific price within a specific period.
This flexibility makes options powerful tools for hedging, speculation, and income generation. However, the same flexibility also makes them risky if not handled with proper knowledge. Many beginners are drawn to the huge profit potential in options, but without understanding the risks, they often lose money quickly.
2. What Are Options? Basic Concepts
An option is a financial derivative contract.
It derives its value from an underlying asset (like Reliance shares, Nifty index, gold, crude oil, or even USD/INR).
When you buy an option, you’re not buying the asset itself; you’re buying the right to transact in that asset at a pre-decided price, called the strike price.
Example:
Suppose you buy a Call Option for Reliance at ₹2500 strike price, valid for 1 month.
If Reliance’s stock rises to ₹2600, you can exercise your right to buy at ₹2500 (cheaper than market).
If Reliance falls to ₹2400, you can simply let the option expire worthless (you don’t have to buy).
This right-without-obligation feature is what makes options unique.
3. Key Terms in Option Trading
Before diving deeper, let’s decode the important terminology:
Strike Price – The fixed price at which you may buy/sell the underlying.
Expiry Date – The date when the option contract ends.
Premium – The cost you pay to buy the option.
Lot Size – Options are traded in fixed quantities (e.g., Nifty option = 50 units per lot).
Underlying Asset – The stock, index, or commodity on which the option is based.
Exercise – The act of using your right to buy or sell at strike price.
Settlement – How the trade is closed (cash settlement or physical delivery).
4. Types of Options (Call & Put)
Call Option
A Call Option gives you the right (not obligation) to buy the underlying at a fixed strike price before expiry.
Buyers of Calls = Bullish (expect price to rise).
Sellers of Calls = Bearish/Neutral (expect price to stay same or fall).
Put Option
A Put Option gives you the right (not obligation) to sell the underlying at a fixed strike price before expiry.
Buyers of Puts = Bearish (expect price to fall).
Sellers of Puts = Bullish/Neutral (expect price to stay same or rise).

"Bullish Breakout Potential for Gold (XAU/USD) Above Key ?Key Observations:
The price is currently rising and is reaching a key resistance level.
A potential breakout is shown above the resistance at approximately 3,723.
A blue support zone between 3,686 and 3,690 suggests that the price has recently bounced off this level, implying bullish momentum.
The target price shown in the chart (with the green box) is positioned around 3,730, indicating that the trader is expecting further upward movement.
The stop-loss is placed just below the support zone, around 3,672, which suggests that the trader is managing risk.

Fed Dovish Signals & Geopolitical Tensions Boost Gold📊 Market Context
Gold continues to receive solid support from the Fed’s dovish tone and rising geopolitical tensions. However, the USD has extended its rebound from multi-year lows, which may temporarily limit gold’s upside. Broader risk-on sentiment in financial markets could act as a short-term headwind for XAU/USD before the next round of Fed speeches. Still, the long-term bullish trend has re-emerged, and gold is positioned to challenge new all-time highs in the near term—an important signal for Indian traders watching for fresh momentum in precious metals.
🔎 Technical Analysis (H1/H4)
Price has broken above the descending trendline, confirming that bullish momentum has returned.
Short-term support: 3686–3684, maintaining this level preserves the bullish structure.
Additional support: 3670–3668, overlapping with CP and liquidity zones on the chart.
Key resistance: 3720–3722, a crucial reaction level for profit-taking or liquidity sweeps.
🔑 Key Levels
Resistance: 3707 ➡️ 3720
Support: 3685 ➡️ 3669 ➡️ 3658
📈 Scenarios & Trading Plan
✅ BUY ZONE 1: 3686–3684
SL: 3680
TP: 3690 ➡️ 3695 ➡️ 3700 ➡️ 3705 ➡️ 3710 ➡️ 3720 ➡️ …
✅ BUY ZONE 2: 3670–3668
SL: 3664
TP: 3675 ➡️ 3680 ➡️ 3690 ➡️ 3700 ➡️ …
✅ SELL ZONE (Liquidity Trap Watch): 3720–3722
SL: 3726
TP: 3715 ➡️ 3710 ➡️ 3705 ➡️ 3700 ➡️ …
⚠️ Risk Management Notes
Watch for false breakouts at 3720–3722 — price could sweep stops before reversing lower.
Only enter longs with price action confirmation at the buy zones; avoid chasing price mid-range.
Manage trade size carefully given potential volatility from Fed comments and geopolitical news.
✅ Summary
Gold’s long-term bullish trend is firmly back, supported by Fed dovishness and geopolitical factors—key drivers for India’s gold market sentiment. The plan focuses on buying dips at 3686–3684 and 3670–3668 targeting 3705–3720, while short-term selling at 3720–3722 is valid if rejection appears.
📢 Stay updated with MMFLOW TRADING on TradingView for fresh market insights and actionable setups tailored for gold traders

Stock Market Gains and Related Terms1. Types of Stock Market Gains
Stock market gains can be broadly classified into two types:
1.1 Capital Gains
Capital gains are the profits realized when an investor sells a stock at a higher price than the purchase price. They can be:
Short-Term Capital Gains (STCG): Gains from selling assets held for less than a year. Often taxed at a higher rate.
Long-Term Capital Gains (LTCG): Gains from selling assets held for more than a year. Usually taxed at a lower rate.
Example:
You buy 100 shares of a company at ₹500 each. After a year, the price rises to ₹700.
Capital gain = (700 – 500) × 100 = ₹20,000
1.2 Dividend Gains
Dividends are periodic payments made by companies to shareholders from their profits. Investors earn gains without selling shares. Dividends can be:
Cash Dividends: Direct cash paid to shareholders.
Stock Dividends: Additional shares given instead of cash.
Example:
You own 100 shares, and the company pays a ₹10 per share dividend: ₹10 × 100 = ₹1,000 gain.
1.3 Total Return
Total return combines capital gains and dividend gains, giving a holistic picture of the investor’s profit.
Formula:
Total Return = (Ending Value – Initial Investment + Dividends) / Initial Investment × 100%
2. Related Terms in Stock Market Gains
Understanding stock market gains involves several interrelated concepts:
2.1 Market Capitalization
Market capitalization (market cap) is the total market value of a company’s outstanding shares. It helps investors gauge the company’s size and potential for gains.
Formula:
Market Cap = Share Price × Number of Outstanding Shares
2.2 Earnings Per Share (EPS)
EPS is a measure of a company’s profitability, calculated as:
EPS = Net Income / Outstanding Shares
Higher EPS often leads to stock price appreciation, contributing to capital gains.
2.3 Price-to-Earnings Ratio (P/E Ratio)
The P/E ratio measures stock valuation relative to earnings:
P/E = Share Price / EPS
High P/E may indicate growth potential, influencing expected gains.
Low P/E may suggest undervaluation, signaling possible future gains.
2.4 Dividend Yield
The dividend yield measures the dividend relative to the share price:
Dividend Yield = Annual Dividend / Share Price × 100%
Indicates income component of stock market gains.
2.5 Volatility
Volatility represents the degree of price fluctuation in a stock. High volatility can mean higher potential gains but increased risk.
2.6 Liquidity
Liquidity is the ease with which a stock can be bought or sold without affecting its price. Higher liquidity ensures investors can realize gains quickly.
2.7 Risk and Return
There is a direct relationship between risk and expected return:
High-risk stocks → Potential for higher gains.
Low-risk stocks → Steady, smaller gains.
3. Market Factors Affecting Gains
Stock market gains are influenced by macroeconomic, microeconomic, and behavioral factors.
3.1 Economic Indicators
GDP growth
Inflation rate
Interest rates
3.2 Corporate Performance
Revenue and profit growth
Product launches and innovations
Management efficiency
3.3 Market Sentiment
Investor behavior, market trends, and news can drive short-term gains.
3.4 Global Factors
Geopolitical stability
Foreign investment flows
Currency fluctuations
4. Investment Strategies to Maximize Gains
Investors use various strategies to maximize gains:
4.1 Buy and Hold
Long-term investment to capture capital appreciation and dividends.
4.2 Swing Trading
Exploiting short- to medium-term price movements for gains.
4.3 Dividend Investing
Focusing on high dividend-paying stocks for consistent income.
4.4 Growth Investing
Investing in companies with high growth potential, expecting large capital gains.
4.5 Value Investing
Buying undervalued stocks to profit as their prices reflect intrinsic value over time.
5. Measuring Stock Market Gains
Investors track gains using several tools and metrics:
Portfolio Value Growth
Return on Investment (ROI)
Alpha and Beta (Risk-adjusted return)
Sharpe Ratio (Risk vs. Reward)
6. Tax Implications on Gains
Gains from stock market investments are subject to taxation:
Capital Gains Tax: Varies based on short-term vs. long-term holdings.
Dividend Tax: Taxed as per investor’s income bracket.
Wealth/Transaction Tax: Some countries impose additional charges.
Understanding taxes is critical for calculating net gains.
7. Psychological and Behavioral Factors
Investor behavior impacts the ability to realize gains:
Greed vs. Fear: Can lead to impulsive decisions, affecting gains.
Overtrading: Frequent buying and selling may reduce overall gains.
Herd Mentality: Following market trends without analysis can impact profits.
8. Advanced Concepts Related to Gains
8.1 Compound Gains
Reinvesting gains to generate exponential growth over time.
8.2 Leverage
Using borrowed capital to increase potential gains (but also risk).
8.3 Hedging
Strategies to protect gains against market downturns using derivatives like options and futures.
8.4 Diversification
Spreading investments across sectors and asset classes to stabilize gains.
9. Case Study Example
Investor A:
Buys 200 shares of XYZ Ltd. at ₹100.
Receives ₹5 per share dividend annually.
Stock price rises to ₹150 in 2 years.
Calculation:
Capital Gain = (150 – 100) × 200 = ₹10,000
Dividend Gain = 5 × 200 × 2 = ₹2,000
Total Gain = ₹12,000
This illustrates how both capital appreciation and dividends contribute to overall stock market gains.
10. Conclusion
Stock market gains are not merely about stock price increases. They encompass dividends, reinvestment, risk-adjusted returns, and strategic decision-making. Related terms like capital gains, dividends, EPS, P/E ratio, volatility, and portfolio management are all critical to understanding the nuances of gains. Effective investing requires a combination of financial literacy, market knowledge, and psychological discipline.

LiamTrading – XAUUSD Trading Scenario for TodayGold continues its robust upward momentum and is now approaching the critical resistance zone around 3,697 – 3,700. This is a confluence point with the Fibonacci extension level and also a zone where sellers might re-enter strongly.
Technical Analysis
On the H1 chart, the price has tested the resistance zone multiple times but hasn't broken through decisively. This indicates that profit-taking pressure is emerging.
The sell confirmation zone will form if the price breaks below 3,685 – 3,686, at which point the correction target could be around 3,673.
The main Buy Zone is located at 3,650 – 3,645, coinciding with previous support and a strong liquidity area. This is a region where a price increase reaction is likely.
Further down, the 3,628 – 3,630 zone is considered solid support on the larger frame, and if retested, it will be a long-term buying opportunity.
Conversely, if the price decisively surpasses the strong resistance zone of 3,720 – 3,730, the upward trend will be confirmed to continue, opening up higher targets around 3,750+.
Trading Plan Reference
Short-term sell around 3,697 – 3,700, SL 3,707, TP 3,686 – 3,673.
Short-term buy around 3,650 – 3,645, SL 3,640, TP 3,673 – 3,690.
Long-term buy around 3,628 – 3,630, SL 3,620, TP 3,660 – 3,690 – 3,720.
These are my personal views on XAUUSD, and you can use them as a reference to build your own plan. If you find this useful, follow me for the latest updates on new gold trading scenarios.

XAUUSD – Daily Trading Plan
Hello Traders,
Gold opened the Asian session holding its price structure firmly. The 3708 level will be the key pivot today:
If price sustains above this level, the next upside targets are 3750 and possibly 3780.
If price reacts lower at 3708 resistance, then 3650 or even 355x could be the zones to watch for buying opportunities.
Fundamental Context
Last week’s correction was triggered by comments from the Fed Chair on interest rate policy. The Fed does not intend to cut rates too frequently, and this week’s PCE data will play a decisive role in shaping the outlook.
Trading Strategy for Today
Buy Setup
Entry: 3650 – 3653
SL: 3645
TP: 3662 – 3675 – 3690 – 3706 – 3725
Sell Setup 1
Entry: 3700 – 3703
SL: 3708
TP: 3690 – 3675 – 3662 – 3650 – 3633
Sell Setup 2
Entry: 3738 – 3740
SL: 3746
TP: 3725 – 3710 – 3700 – 3675 – 3650
Summary
The preferred bias for today is to look for buy opportunities on dips, in line with the broader uptrend.
Follow me to receive the latest updates as soon as market structure changes

Elliott Wave Analysis XAUUSD – September 21, 2025
Momentum
• D1: Momentum is still declining → suggesting that early next week price may either experience a downward move or continue to range sideways.
• H4: Momentum is in the overbought zone → likely to see a corrective move on Monday.
• H1: Momentum is also in the overbought zone → during the Asian session on Monday, a short-term corrective decline is highly probable.
Wave Structure
• D1:
o Scenario 1: Wave v (black) has already completed (refer to H4). This means the market is now in a larger corrective phase, and price is unlikely to break above 3709, the high set last week.
o Scenario 2: Wave 4 (black) of wave v has completed, and Friday’s rally was wave 5 (black) of wave v. In this case, early next week we could see a breakout above 3709 with a daily close higher.
• H4: Since D1 and H4 momentum still support a corrective move on Monday, I will keep the current wave labeling unchanged. Only if price breaks strongly above 3709 will I update the labeling to Scenario 2.
• H1: On D1, the two scenarios are contradictory:
o One scenario suggests a decline.
o The other suggests a new high.
Therefore, the best approach for now is to wait for more confirmation. On H1, the labeling from last Friday (the bearish scenario) has not yet been invalidated and is still supported by both D1 and H4 momentum, so I will continue to monitor this count.
Trading Plan
During complex corrective phases, when wave structures are not yet clear, I do not recommend trading solely based on Elliott Wave. For now, the prudent approach is to continue observing until more data becomes available.
If trading is necessary, it’s better to focus on short-term scalps rather than larger swing positions.

Gold Trading Strategy for Monday✅ On Friday's US trading session, gold saw a strong upward movement and successfully broke the downward trendline on the 1-hour chart, indicating that bulls are in control of the market. The current short-term pullback is merely a correction and has not changed the overall uptrend. Due to the strong bullish momentum, the short-term pullback does not indicate a trend reversal and, in fact, provides an opportunity for buying on dips.
✅ On the 4-hour chart, gold has experienced short-term consolidation, but the overall trend remains bullish. The MACD is in a strong zone, and the KDJ indicator is still in a bullish zone, suggesting that the price may continue to rise in the short term.
In the short term, there is support around the 3660-3670 region. If the price pulls back to this level, consider buying. If the price breaks above 3685, further bullish movement can be expected.
🔴 Resistance levels: 3702-3707 / 3720-3730
🟢 Support levels: 3660-3670 / 3636-3640
✅ Trading strategy reference:
🔰 If gold price rebounds to the 3702-3705 area, consider selling in batches with a target of 3690-3680, and if broken, look for a further move to 3670.
🔰 If gold price pulls back to the 3665-3670 area, consider buying in batches with a target of 3685-3695, and if broken, look for a further move to 3705.
🔥Trading Reminder: Trading strategies are time-sensitive, and market conditions can change rapidly. Please adjust your trading plan based on real-time market conditions.

Gold Price Today: XAUUSD Sets Stage for Continued Bullish ExpansGold (XAUUSD) Market Report – September 21, 2025
Gold remains positioned near 3,685, with recent price behavior showing a structured climb despite short bursts of volatility. The market is cycling through phases of expansion and retracement, where each corrective leg has been followed by renewed upward momentum. This rhythm signals that buyers are steadily maintaining control of the broader trend.
The current setup reflects a market that is rebalancing efficiently. Short-term pullbacks are being absorbed quickly, keeping pressure aligned toward the upside. The sequence of structural shifts on the chart points to a continuation of this momentum, suggesting that higher valuations are within reach if the present flow persists.
Overall, gold’s tone is constructive, characterized by resilience and sustained demand. The pattern unfolding indicates a market preparing for further expansion, with the potential for continuation into higher ranges in the sessions ahead.

PLAN FOR SUNDAY EVENING SUNDAY TRADING CHEAT-SHEET (XAUUSD & USDJPY)
✅ General Rules
• Avoid thefirst 15–30 min of Sunday open (low liquidity, wide spreads).
• Always mark: PDH, PDL, Weekly Open, Friday Close.
• Trade only after confirmation:
Liquidity Grab → BOS/CHOCH → Retest → Conviction Candle.
• No confirmation = No trade.
• Risk ≤ 1% per trade.
⸻
🟡 GOLD (XAUUSD)
Bias: Bearish from supply unless broken.
🔻 Short Setup (preferred)
• Supply Zone: 3,693 – 3,701
• Entry: 3,695 – 3,700 (after BOS down on 3m–5m)
• SL: Above 3,710
• TP1: 3,660
• TP2: 3,640
• TP3: 3,615
🟢 Long Setup (counterplay)
• Demand Zone: 3,640 – 3,650 (deep: 3,615 – 3,630)
• Entry: After BOS up on 3m–5m
• SL: Below 3,600
• TP1: 3,670
• TP2: 3,700
• TP3: 3,720
⸻
💴 USDJPY
Bias: Range between 147.40–148.40. Short from premium, long from discount.
🔻 Short Setup (preferred)
• Supply Zone: 148.20 – 148.40
• Entry: 148.25 – 148.35 (after BOS down on 3m–5m)
• SL: Above 148.50
• TP1: 147.90
• TP2: 147.60
• TP3: 147.00
🟢 Long Setup (counterplay)
• Demand Zone: 147.40 – 147.60
• Entry: 147.45 – 147.55 (after BOS up on 3m–5m)
• SL: Below 147.20
• TP1: 147.90
• TP2: 148.20
• TP3: 148.40
⸻
⚡ Confirmation Checklist
✅ Liquidity sweep inside zone
✅ BOS / CHOCH in your favor (on 3m–5m chart)
✅ Retest OB/FVG from that BOS
✅ Conviction candle close (red near low for shorts, green near high for longs)
⸻
📌 Plan Summary:
• Gold: Watch 3,693–3,701 for shorts, 3,640–3,650 for longs.
• USDJPY: Watch 148.20–148.40 for shorts, 147.40–147.60 for longs.
• Always confirm with BOS/CHOCH before entry.

XAU/USD: Sideway or Waiting for a Breakout?Hello traders, gold is currently in a clear sideways phase , moving within a narrow trading range between support at 3,652 USD and resistance at 3,700 USD. The chart shows that gold continues to fluctuate in this area without any signs of a strong breakout.
Although there is no major immediate news impact, the recent Fed rate cut has created a slight bullish bias for gold, as it continues to be viewed as a safe-haven asset in a low-interest-rate environment. This may support gold in holding within the current range, with a slight upside potential if price stays above the 3,652 USD support level.
If gold breaks above the 3,700 USD resistance , the uptrend could continue. However, if it breaks below current support levels , the market may see a correction. We need to monitor market signals closely to determine any trend shift.

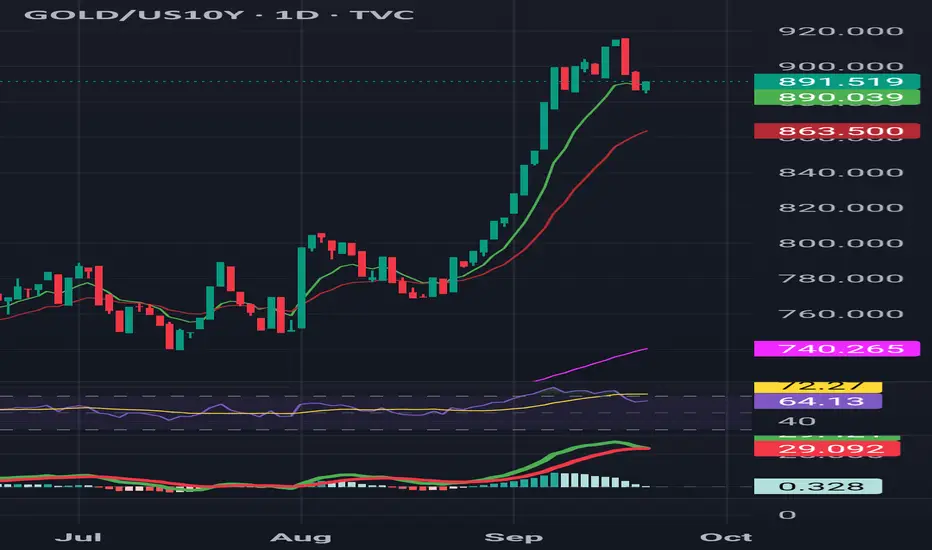
GOLD/US10Y RATIO ANALYSIS Gold vs. US 10Y yield ratio surged to extreme highs but is now showing weakening momentum. RSI has pulled back from overbought and MACD is cooling.
🔎 If this ratio rolls over, it may signal profit-taking in Gold as yields recover.
Futures & Hedging Techniques1. Understanding Futures Contracts
1.1 Definition and Basics
A futures contract is a standardized agreement between two parties to buy or sell an underlying asset at a predetermined price on a specific future date. Futures are traded on regulated exchanges and cover a wide range of assets, including commodities (oil, gold, wheat), financial instruments (bonds, stock indices), and currencies.
Key characteristics:
Standardization: Contract size, expiration date, and quality of the underlying asset are predefined.
Leverage: Futures allow traders to control a large position with a relatively small margin, magnifying both gains and losses.
Obligation: Unlike options, both parties are obligated to fulfill the contract unless it is closed before expiration.
1.2 Types of Futures Contracts
Futures contracts can be broadly classified into:
Commodity Futures: Contracts for physical goods like crude oil, natural gas, metals, or agricultural products.
Financial Futures: Contracts based on financial instruments such as stock indices (e.g., S&P 500), government bonds, or currencies.
Currency Futures: Agreements to exchange a specific amount of one currency for another at a future date.
Interest Rate Futures: Contracts based on the future level of interest rates, often used to hedge bond positions.
2. The Concept of Hedging
2.1 What is Hedging?
Hedging is a risk management strategy used to offset potential losses in an investment by taking an opposite position in a related asset. It acts as a financial "insurance policy," protecting against price volatility.
Example:
A wheat farmer expects to harvest 10,000 bushels in three months. To protect against a price drop, he sells wheat futures. If prices fall, gains from the futures contract offset losses in the cash market.
2.2 Hedging vs. Speculation
Hedgers: Aim to reduce risk and protect profit margins.
Speculators: Take on risk to profit from price movements.
Hedgers use futures primarily, while speculators are attracted to leverage and profit potential.
3. Hedging Techniques
3.1 Long Hedge
A long hedge is used when an investor or business anticipates purchasing an asset in the future and wants to protect against price increases. It involves buying futures contracts.
Example:
An airline company expects to buy jet fuel in three months. To hedge against rising fuel prices, it buys fuel futures. If fuel prices increase, gains from the futures offset higher cash market costs.
3.2 Short Hedge
A short hedge is applied when the investor or business owns the asset and wants protection against price declines. It involves selling futures contracts.
Example:
A farmer expecting to sell corn in six months may sell corn futures. If market prices drop, gains from futures contracts compensate for lower cash sales prices.
3.3 Cross Hedging
Cross hedging occurs when the exact underlying asset is not available for hedging, so a related asset's futures contract is used. This method carries basis risk, as the hedge may not perfectly offset price changes.
Example:
A steel manufacturer might use iron ore futures to hedge against steel price fluctuations when no steel futures are available.
3.4 Rolling Hedges
Futures contracts have expiration dates. To maintain continuous hedging, traders roll over contracts from a near-month to a later-month contract, locking in protection over a longer horizon.
4. Advanced Hedging Strategies
4.1 Delta Hedging
Primarily used in options trading, delta hedging involves adjusting positions to remain neutral against price movements of the underlying asset. Though complex, it can minimize directional risk.
4.2 Ratio Hedging
This involves using a proportionate number of futures contracts to hedge a position. Over-hedging or under-hedging can be applied based on risk appetite.
4.3 Hedging with Options on Futures
Options provide asymmetric protection:
Buying put options hedges against price declines.
Buying call options hedges against price increases.
This approach limits losses while retaining upside potential.
5. Real-World Applications of Futures and Hedging
5.1 Commodities
Agriculture: Farmers hedge crops to lock in prices and stabilize income.
Energy: Airlines and utilities hedge oil, gas, and electricity prices to manage operational costs.
Metals: Industrial manufacturers hedge metals like copper and aluminum to control production expenses.
5.2 Financial Markets
Equities: Portfolio managers hedge against market downturns using index futures.
Interest Rates: Banks hedge bond portfolios against interest rate fluctuations using Treasury futures.
Currency Exposure: Multinational companies hedge foreign currency transactions to mitigate exchange rate risk.
5.3 Corporate Finance
Corporations employ hedging to:
Protect profit margins.
Secure predictable cash flows.
Reduce volatility in earnings reports.
6. Advantages and Limitations
6.1 Advantages
Risk Management: Reduces exposure to adverse price movements.
Liquidity: Futures markets are highly liquid.
Price Discovery: Transparent pricing aids decision-making.
Standardization: Contracts are uniform and regulated.
6.2 Limitations
Basis Risk: Imperfect hedging can leave residual risk.
Margin Calls: Leverage can lead to unexpected losses.
Market Volatility: Extreme events may cause margin strain.
Complexity: Advanced hedging requires financial expertise.
7. Practical Tips for Effective Hedging
Identify Exposures: Determine what risks need hedging—commodity prices, interest rates, currencies.
Choose the Right Instrument: Use futures, options, or combinations to optimize coverage.
Calculate Hedge Ratios: Apply statistical methods for precision.
Monitor Positions: Markets are dynamic; regular evaluation is critical.
Understand Costs: Consider transaction costs, margin requirements, and potential losses.
8. Case Studies
Case Study 1: Airline Fuel Hedge
A major airline facing volatile fuel prices purchased crude oil futures. When prices surged 12% in three months, the gains from futures offset the higher fuel costs, stabilizing operational expenses.
Case Study 2: Wheat Farmer
A farmer expecting to sell wheat in 90 days sold futures contracts. Prices fell by 8%, but the futures gain neutralized losses, ensuring predictable revenue.
Case Study 3: Multinational Corporation
A tech firm receiving payments in euros hedged using currency futures. Adverse EUR/USD fluctuations could have reduced earnings, but gains from futures mitigated the impact.
9. Emerging Trends in Futures and Hedging
Algorithmic Hedging: AI and quantitative models optimize hedge ratios in real-time.
ESG Hedging: Companies hedge exposure to carbon credits or renewable energy costs.
Cryptocurrency Futures: Digital assets now offer hedging tools for crypto portfolios.
Globalization: Increasing cross-border trade creates diverse hedging needs in multiple currencies and commodities.
10. Conclusion
Futures and hedging techniques are indispensable tools in modern finance. They allow market participants to manage risk, protect profits, and plan for uncertainties. While futures provide standardized, leveraged instruments for price speculation and risk management, hedging techniques enable businesses and investors to achieve stability amid market volatility.
Mastering these concepts requires a combination of theoretical knowledge, practical experience, and an understanding of market behavior. With careful planning, risk assessment, and strategy execution, futures and hedging can transform uncertainty into a manageable, predictable component of financial decision-making.

LiamTrading – Long-Term Trend for XAUUSD is Taking ShapeGold continues its robust upward momentum, currently trading around 3,680 – 3,685. After a series of consecutive bullish candles, the price is showing signs of consolidation and slight adjustment, paving the way for crucial scenarios in the upcoming phase.
Technical Analysis
On the Daily chart, the RSI has surpassed the 70 mark, indicating an overbought condition. This is often an early warning sign for a potential correction.
The price structure suggests that the FVG zone of 3,630 – 3,600 will be the first observation point if a short-term correction occurs.
A stronger support zone lies at 3,510 – 3,475, coinciding with Fibonacci levels 0.5 – 0.382, and also the previous resistance area that has been broken. This is considered a potential long-term 'Buy zone'.
If the correction completes, gold has the potential to return to its upward trend with a further target around 3,800 (Fibonacci extension levels 2.618 – 3.618).
Trading Scenarios
Short-term: Monitor the reaction at 3,630 – 3,600. If it holds, there might be a short recovery.
The price area around 3552-3562 should be watched for reactions.
Medium-term: Wait for the price to test the 3,500 – 3,475 zone to find more sustainable buying opportunities.
Long-term: The major trend still leans towards an increase, with an expected target towards 3,800.
This is my personal view on XAUUSD, and you can consider it to build your own plan. If you find it useful, follow me for the latest updates on gold's upcoming scenarios.

XAUUSD – Strong Resistance at 3760–3770 Await ConfirmationHello trader,
Gold continues to fluctuate within the accumulation zone after the recent recovery. Although the larger trend leans towards an increase, a clear confirmation at key resistance-support levels is needed for a stronger breakout.
Strong Resistance: 3760 – 3770, converging with the Fibonacci extension zone. This is a crucial level if the price aims to create a new ATH in the mid-term.
Key level Sell: 3685 – 3695, currently a short-term resistance zone. If the price fails to break through, gold may face downward pressure.
Important Support:
3564 – 3574: mid-term support.
3534 – 3540: deep support zone, aligning with previous liquidity.
MACD H4: Histogram remains weak, momentum is unclear → the market needs further confirmation to clearly define the trend.
Trading Scenario
Bullish Scenario
Condition: Price breaks above 3695 and holds.
Entry: Retest 3665 – 3668.
Target: 3680-3698-3715-3730 – 3760 – 3770.
Extension: If successfully surpassing 3770 → expect a move towards 3800+.
Bearish Scenario
Condition: Price fails at 3695 and reverses.
Entry: Sell at 3685 – 3695 zone upon rejection signal.
Target: 3672-3655-3635 – 3600 – 3574.
Extension: If breaking 3574, the decline may target 3540, or even deeper.
Mid-term Scenario
Price may retest 3534 – 3550 to gather liquidity, then rebound following the larger trend. This will be an attractive long-term Buy zone.
The gold market is at a crucial stage: buyers need to break 3695 to confirm the uptrend, while sellers still have opportunities at the short-term resistance zone. Deep support levels will continue to serve as a foundation for mid-term Buy strategies.
Keep a close watch on 3695 and 3760 – 3770 to determine the next direction.
Stay tuned for the latest scenarios as the price structure evolves.

Gold Hits New Record: Should You Buy or Sell in This Hot Market?Namaste traders,
This past week, gold surprised everyone by closing strong. On Friday (19/09), it moved higher again, marking its 5th consecutive weekly gain at $3,683.24/oz, while futures touched $3,718.50/oz. This surge followed the Fed’s rate cut, which many thought would cool the yellow metal. So, is this a genuine rally or just a bull trap?
Fundamentals: Rate Cut Pushes Gold Higher
Lower interest rates reduce the cost of holding gold.
Fed’s dovish signals raised expectations for more easing.
In India, physical gold demand is at a 10-month high, while China also shows strong appetite despite higher prices.
Technical Outlook
Gold broke its downward trendline, signaling bullish continuation. Buyers are in control.
This Week’s View: Focus on buying near-term targets at $372x and $373x, but stay alert to macro news.
Trading Setups (with strict risk management):
Buy Scalp: $3671–$3669 | SL: $3666 | TP: $3674–$3694
Buy Zone: $3657–$3659 | SL: $3647 | TP: $3669–$3709
Sell Scalp: $3713–$3715 | SL: $3719 | TP: $3705–$3785
Sell Zone: $3731–$3733 | SL: $3741 | TP: $3723–$3683
Will gold shine brighter and set another all-time high? Share your view! 👇

Part 8 Trading Master Class1. Introduction to Option Trading
Financial markets are constantly evolving, offering traders and investors a wide variety of tools to manage risk, speculate on price movements, or generate income. One of the most fascinating and versatile financial instruments is the option.
Unlike buying a share of a company directly, which gives you ownership, an option gives you rights, not obligations. This small distinction makes options powerful. They can amplify profits, reduce risks, and allow traders to play multiple angles of the market.
Option trading might sound complicated at first, but once you understand the foundation, it’s like learning a new language – everything starts connecting.
2. The Basics: What Are Options?
An option is a contract between two parties – a buyer and a seller – that gives the buyer the right, but not the obligation, to buy or sell an underlying asset at a predetermined price within a set time frame.
The underlying asset could be a stock, an index, a commodity (like gold or crude oil), or even currencies.
The predetermined price is called the strike price.
The time frame is defined by the expiry date.
In simple words:
Options are like a reservation ticket. You pay a small amount now (premium) to lock in the ability to buy/sell later, but you don’t have to use it if you don’t want to.
3. Types of Options: Call and Put
There are two main types:
Call Option: Gives the buyer the right to buy the underlying asset at the strike price.
Example: You buy a call option for Reliance at ₹2500. If Reliance goes to ₹2700, you can still buy it at ₹2500, making profit.
Put Option: Gives the buyer the right to sell the underlying asset at the strike price.
Example: You buy a put option for Infosys at ₹1500. If Infosys falls to ₹1300, you can still sell it at ₹1500.
Think of calls as a bet on prices going up, and puts as a bet on prices going down.
4. Key Terminologies in Options
To understand option trading, you must master its unique vocabulary:
Strike Price: The pre-agreed price at which you can buy/sell the underlying.
Expiry Date: The date on which the option contract expires.
Premium: The price you pay to buy the option.
In-the-Money (ITM): Option has intrinsic value. (E.g., stock is above strike for calls, below strike for puts).
Out-of-the-Money (OTM): Option has no intrinsic value.
At-the-Money (ATM): Stock price and strike price are nearly the same.
Option Writer: The seller of the option, who takes the opposite side.
Lot Size: The minimum quantity you can trade in an option contract.

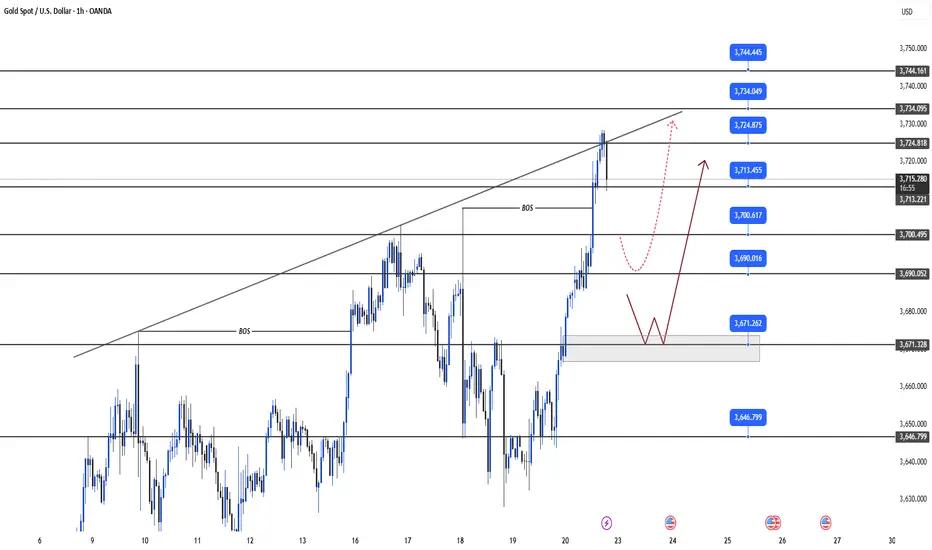
XAU/USD – Captain Vincent Weekly Plan🔎 Captain’s Log – Context
📈 Main Trend : Strong uptrend after BoS.
📊 Price moving sideways within the rising channel, staying below Weak High 3674 .
📌 EMA 50 > EMA 200 → bullish trend remains solid.
🎯 Captain’s Map – Trading Scenarios
1️⃣ Golden Harbor (BUY – Main Priority)
🎯 Entry:
FVG Dock: 3602 – 3593
FVG Deep: 3567 – 3560
OB Harbor: 3535 – 3540
⛔ SL: below 3520
✅ TP1: 3674 (sweep Weak High)
✅ TP2: 3720 – 3740
2️⃣ Quick Boarding (Short-term SELL – Counter-trend)
Condition: If price breaks 3674 first → watch for false break.
🎯 Entry: 3670 – 3680
✅ TP: back to 3602 – 3567
⚠️ Note : scalp only, don’t hold long.
3️⃣ Storm Breaker Alert (Bearish Scenario)
If 3535 breaks → short-term uptrend invalidated.
🎯 Bearish target: 3480 – 3500
Captain’s Note ⚓
“The golden sail still catches the wind after BoS, leading the captain and crew on the bullish tide. Golden Harbor 🏝️ (3593 – 3560 – 3535) remains the preferred docking point to load cargo and continue the voyage. Quick Boarding 🚤 at Storm Breaker 🌊 (3670 – 3680) is only a short ride when the ship sweeps liquidity at Weak High 3674 . Should 3535 break, the ship might be dragged toward 3480 – 3500, but as long as it anchors at Golden Harbor, the grand journey still heads north toward 3720+.”

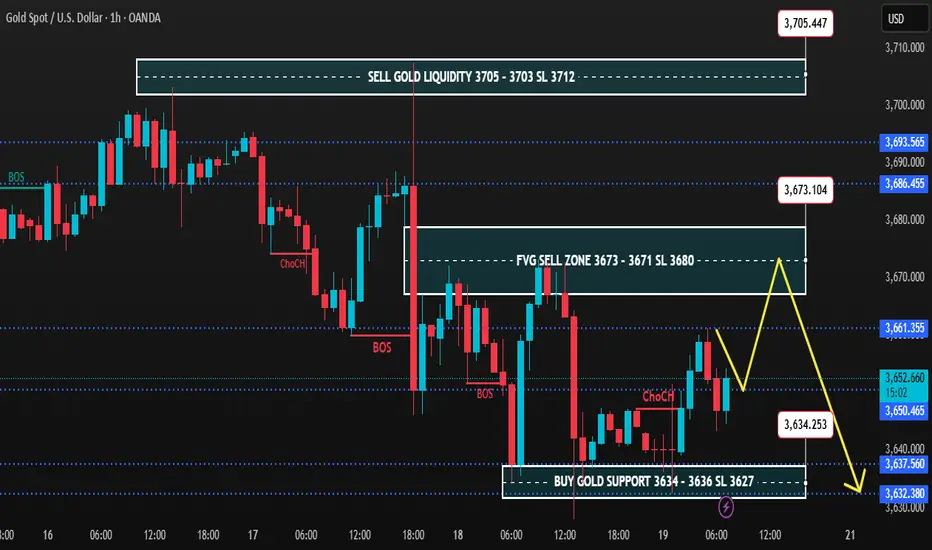
Gold 1H – Risk of Premium Sweeps Before ReversalOn the 1H timeframe, gold is consolidating after consecutive BOS and ChoCH signals, showing rejection from premium levels. The market is oscillating between the fresh FVG sell zone at 3,673–3,671 and the deep discount support at 3,634–3,636. Liquidity remains positioned above 3,705 and below 3,632, keeping scope for engineered sweeps before a clearer directional move emerges.
________________________________________
📌 Key Structure & Liquidity Zones (1H):
• 🔴 FVG SELL ZONE 3,673 – 3,671 (SL 3,680)
Premium intraday pocket for rejection, targeting 3,660 → 3,650 → 3,640.
• 🔴 SELL GOLD LIQUIDITY 3,705 – 3,703 (SL 3,712)
Major premium liquidity trap, likely to precede continuation lower towards 3,690 → 3,675 → 3,660.
• 🟢 BUY GOLD SUPPORT 3,634 – 3,636 (SL 3,627)
Discount demand zone, aiming for recovery towards 3,645 → 3,660 → 3,670 if defended.
________________________________________
📊 Trading Ideas (Scenario-Based):
🔻 Sell Setup – FVG Rejection (3,673–3,671)
• Entry: 3,673 – 3,671
• Stop Loss: 3,680
• Targets:
TP1: 3,660
TP2: 3,650
TP3: 3,640
👉 Expect engineered liquidity grab into the FVG before downside extension.
🔻 Sell Setup – Premium Liquidity Sweep (3,705–3,703)
• Entry: 3,705 – 3,703
• Stop Loss: 3,712
• Targets:
TP1: 3,690
TP2: 3,675
TP3: 3,660
👉 Smart money may sweep highs near 3,705 before resuming bearish leg.
🔺 Buy Setup – Discount Reversal (3,634–3,636)
• Entry: 3,634 – 3,636
• Stop Loss: 3,627
• Targets:
TP1: 3,645
TP2: 3,660
TP3: 3,670
👉 High risk-reward opportunity if gold defends discount demand; suitable for counter-trend scalps.
________________________________________
🔑 Strategy Note
Gold remains under pressure below 3,673–3,705, favouring short setups into premium sweeps. However, close attention is needed at 3,634–3,636, as buyers may attempt to accumulate and reclaim structure. Best practice: trade smaller lots until the New York session provides confirmation of direction.