Accumulated Gold on Support, 3,952 USD is the Gateway for a New 🔍 Market Context
Gold is oscillating within a symmetrical triangle pattern , reflecting price compression and waiting for a breakout signal.
Buyers still maintain a short-term bullish structure, but the series of lower highs indicates increasing selling pressure.
The zone 3,959–3,964 USD is currently the “balance point” — if this area is breached, the downtrend may extend to the lower liquidity zone around 3,929–3,921 USD .
💎 Key Technical Zones
• Resistance Zone: 4,020 – 4,040 USD → the main resistance of the triangle, where strong reactions are likely.
• Support Zone: 3,959 – 3,964 USD → the support zone maintaining the bullish structure.
• Liquidity Zone: 3,929 – 3,921 USD → a low liquidity zone, potentially attracting price sweeps before reversing.
🎯 Trading Scenarios
1️⃣ BUY Setup – Preferred when price holds above support
• Entry: 3,959 – 3,964 USD
• Stop Loss: 3,940 USD
• Take Profit:
– TP1: 3,985
– TP2: 4,020
– TP3: 4,040
– TP4: 4,096
✳️ “Buy the discount” – Buy at the trendline support zone when a confirmation signal appears (rejection or bullish ChoCH).
2️⃣ SELL Setup – Scenario if support breaks
• Entry: 3,950 – 3,955 USD (after closing a candle below the support zone)
• Stop Loss: 3,970 USD
• Take Profit:
– TP1: 3,935
– TP2: 3,925
– TP3: 3,912
✳️ “Sell the breakdown” – Sell when support is clearly breached, targeting the lowest liquidity zone (3,912 USD).
💬 Summary
Gold is in a phase of accumulation before a major move .
If it holds above 3,952 USD → prioritize BUY according to the bullish structure .
If it breaks below 3,952 USD → SELL according to the breakout towards the Liquidity Zone.
The scenario will be clearly confirmed when the current symmetrical triangle is broken.
💡 Today's Tagline:
“Liquidity defines direction — follow where the money hides.”
⏰ Timeframe: 1H
📅 Update: 04/11/2025
✍️ Analysis by: Captain Vincent
Trade ideas

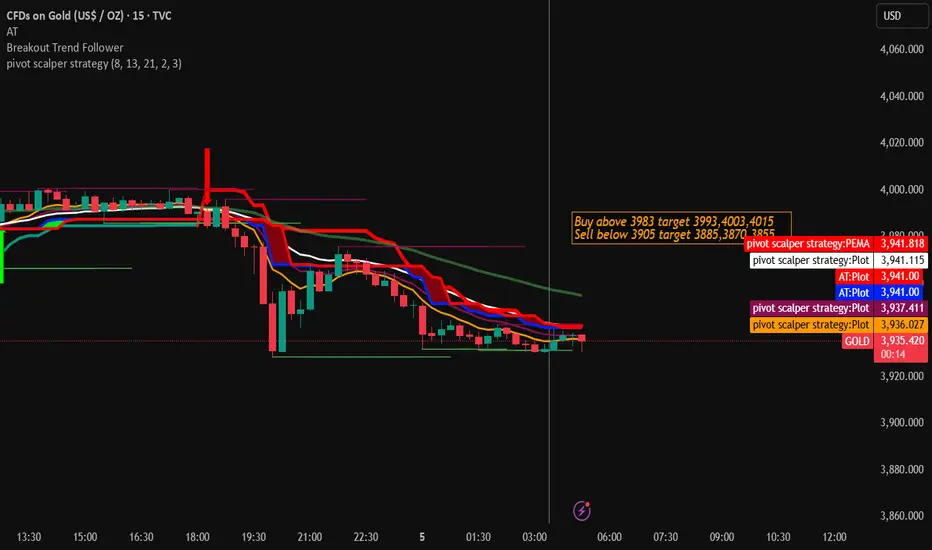
Gold Trading Strategy for 05th November 2025💰 GOLD TRADING PLAN 💰
📈 BUY PLAN:
➡️ Wait for the 1-hour candle to close above $3983.
Once it closes above that level, you can plan to buy above the high of that candle.
🎯 Targets (Profit Levels):
First target: $3993
Second target: $4003
Third target: $4015
💡 Tip: Don’t enter before the candle closes — wait for confirmation!
📉 SELL PLAN:
➡️ Watch the 30-minute candle.
If it closes below $3905, plan to sell below the low of that candle.
🎯 Targets (Profit Levels):
First target: $3885
Second target: $3870
Third target: $3855
💡 Tip: Always use a stop loss to protect your money in case the market reverses.
⚠️ Disclaimer:
This plan is for learning purposes only.
Trading gold or any market involves risk of loss. 📊
Always do your own research, start small, and never trade with money you can’t afford to lose.
XAUUSDUS has 35 trillion dollars dept and its going to pay everyday interest of 25000 crs if jobs rates once completed we have clear about interest rate cut if i had happen US market is gonna crash and safest investment like gold ,silver and bonds gonna rise let’s hope all gonna good
Gold Faces Strong Rejection at Supply Zone – Bearish ContinuatioThe chart shows Gold testing a strong supply zone around 4000–4025. Price attempted to push higher but failed, forming a clear rejection wick followed by consolidation.
Key observations:
Supply Zone (Resistance): 4000–4025 area has repeatedly rejected price, showing strong seller presence.
Structure: Market is forming lower highs, indicating weakening bullish momentum.
Break & Retest: Price pulled back to the broken structure level and is now reacting bearishly.
Projected Move: The arrow suggests a potential drop toward the 3900–3910 demand zone.
Momentum: Candlestick rhythm supports a bearish continuation scenario as long as price stays below 4000.
✅ Bearish Bias
If the rejection holds:
Downside target: 3900–3910
Invalidate bearish idea: A 4H close above 4025

Gold is only bouncing backThe best phase of the gold bull run is over. The daily RSI has been relieved from the overbought condition, as has the weekly, but not the monthly. It will take a longer grinding cycle for that to happen. Gold is in a complex pattern in WXYXZ. Follow this slow grind, as it can take months to complete.

Gold updated levels sell on rise until 4050 not break How My Harmonic pattern projection Indicator work is explained below :
Recent High or Low :
D-0% is our recent low or high
Profit booking zone ( Early / Risky entry) : D 13.2% -D 16.1 % is
range if break them profit booking start on uptrend or downtrend but only profit booking, trend not changed
SL reversal zone (Safe entry ) : SL 23.1% and SL 25.5% is reversal zone if break then trend reverse and we can take reverse trade
Target : T1, T2, T3, T4 and .
Are our Target zone
Any Upside or downside level will activate only if break 1st level then 2nd will be active if break 2nd then 3rd will be active.
Total we have 7 important level which are support and resistance area
Until , 16% not break uptrend will continue if break then profit booking will start.
If break 25% then fresh downtrend will start then T1, T2,T3 will activate
1,3,5,10,15,20 minutes are short term levels.
30 minutes 60 minutes , 2 hours,3 hours, ... 1 day and 1 week chart positional and long term levels

XAU/USD: Powell vs. The Discount ZoneHello, Traders! Let's dive deep into Gold (XAU/USD). The price is currently caught in a crucial tug-of-war: a hawkish US Federal Reserve (Fed) is strengthening the Dollar, while the political risk of a potential US government shutdown offers strong support to Gold. This is where the opportunity lies!
📰 Key Fundamental Drivers (Watch Closely):
The Fed & Powell's Stance: The likelihood of a US rate cut in December has decreased significantly. This signals a Hawkish view, which generally makes the USD stronger and places DOWNWARD pressure on Gold prices.
US Government Shutdown Risk: Concerns are rising that a prolonged government closure could harm the US economy. This economic uncertainty acts as a strong tailwind for Gold, as it is a premier safe-haven asset.
📉 Technical Analysis (The Chart View):
We observe XAU/USD moving within a Rising Wedge pattern (often a signal for a bearish reversal) and is now heading towards a critical price level we call the Strategic Support Zone.
🔥 Strategic Support Zone (The Discount Zone): $3,941 - $3,953. This is the key zone where patient buyers typically look to enter Buy (Long) trades, ensuring a favourable risk/reward profile.
Major Resistance Zone: $4,004 - $4,025.
🎯 Our Two-Sided Trading Strategy:
1. The Bullish Scenario (Long):
Action: Wait for the price to test and show a strong reversal signal (like a rejection candlestick) from the $3,941 - $3,953 support area.
Target: $4,004 - $4,025.
2. The Bearish Scenario (Short):
Action: SELL (SHORT) if the price is strongly rejected at the $4,004 - $4,025 resistance zone, OR if it decisively breaks and closes below $3,941.
Target: Below $3,900.
🚨 Important Note: We must closely monitor any further statements from FOMC members this week. They will dictate the short-term direction. Trade wisely and always use a Stop Loss!
#xauusd #forexindia #powell #fomc #technicalanalysis #gold #usd #indiaforex #tradingview #marketanalysis

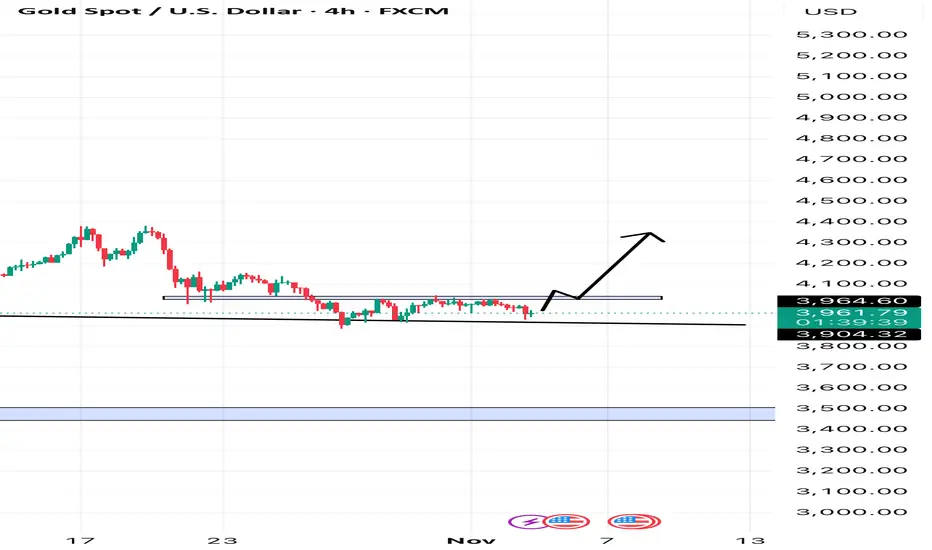
GOLD – TRIANGLE COMPRESSION ON H4 ✨ GOLD – TRIANGLE COMPRESSION ON H4, AWAITING A STRONG BREAKOUT IN WAVE 5 ✨
💬 Gold is accumulating in a compression triangle – when silence lasts too long, the market is about to speak.
Hi everyone 💖, Kristina is back with today's perspective on gold. I hope this analysis will help you – whether you're a new trader or have been trading gold for years – gain a clearer view to prepare for the upcoming breakout.
📉 Technical Analysis:
Currently, gold is moving within a triangle pattern on the H4 frame, indicating that market energy is being compressed. When the price breaks out of this area, the movement range could reach several tens of points.
Important support zone: 3960–3980
Strong resistance zone: 4035–4045
👉 When the price breaks one of these zones, the trend will be clearly confirmed.
According to Elliott Wave, Kristina is observing two scenarios:
1️⃣ Long-term: Wave (5) could be a downward wave, heading towards 3820.
2️⃣ Medium-term: Wave (5) can still rise if the price holds the 4000 zone, targeting around 4110–4130.
💎 Trading zone according to ICT:
Order Block around 4040 is a potential supply zone – a reversal signal is likely to appear.
The area around 4000 is a notable support point – it can create a bounce reaction if the price retests.
🎯 Reference trading scenarios:
Sell around 4040 when there is a reversal signal, SL 10 points, TP 4020–4000.
Buy around 4000 after the price retests the OB, SL 10 points, TP 4110.
If the price breaks 3970, wait to Sell around 3980, SL 10 points, TP 3820.
🕊️ Currently, gold is in a waiting phase – observe, don't rush, to act with the trend when the market "speaks."
🌷 The analysis reflects Kristina's personal perspective, not an investment recommendation.
If you share the same viewpoint or have a different perspective, please leave a comment below 💬💕

XUD/USD-Long-15MinInitially, the Previous Day High (PDH) and Previous Day Low (PDL) are marked on the Daily Time Frame. After that, we switch to the 4-Hour Time Frame to identify the Imbalance (IMB) candle for a potential entry setup. Once the IMB candle is identified, we move to the 15-Minute Time Frame, where the chart clearly highlights the Order Block and Liquidity Area.
The market then shows a clear Change of Character (CHOCH) indicating a shift from an uptrend. Following this, a liquidity hunt occurs as the market moves downward to capture liquidity. After this liquidity sweep, we shift to a Lower Time Frame (LTF) to plan the entry at the next Order Block. The target is set at the Previous Day High, while the stop loss is placed below the last liquidity hunting area.

Gold Range Compression — Breakout Imminent🟥 Resistance Zone (Key Supply Zone): 4028 – 4045
Price has tested this zone multiple times but failed to break through.
A clean break above this red zone will signal strong bullish continuation.
🟦 Support Zone (Key Demand Zone): 3995 – 4005
This is the immediate support keeping price from falling lower.
A break below this blue zone will confirm bearish momentum.
✅ Bullish Scenario
If price breaks and retests the red zone (4028–4045):
Expect upward continuation
Target 1: 4060
Target 2: 4095 – 4105
This matches the upward blue arrows on your chart.
✅ Bearish Scenario
If price breaks below 3995 and retests the blue zone as resistance:
Expect strong downward momentum
Target 1: 3960
Target 2: 3925
This matches the downward blue arrows shown.
✅ Current Bias
Market is neutral right now — sitting between support and resistance.
A breakout from either zone will decide the next direction.

Sell Trade - XAU/USDGreetings to everyone!
You can place a sell trade on XAU/USD and check out my chart for the ideal entry, stop-loss & target placement.
Remember :-
* Move your SL to breakeven once the trade reaches 1:1 R.
* Aim for a minimum reward of 1:1.5 R.
* Don't risk more than 3% of your total margin.
Let's execute this trade smartly! 🚀
💬 About Me:
I am a professional trader with over four years of experience in the markets. I focus on swing trading using the 4H timeframe, mainly in the forex space. The trades I share here are the actual positions I’m executing. I post them as a small gesture to give back to the trading community that’s been a big part of my journey.
Cheers! 🙏

POWER OF 30_M VS LONDONAfter years of trading XAUUSD, I’ve discovered that each market session forms its own unique characteristics and patterns shaped by time, price movement, and volume behavior. This setup highlights how session-based dynamics influence downside movements in gold.
GOLD PULLBACK BEFORE FINAL LEG DOWN🧭 DAILY TRADING PLAN – GOLD (XAU/USD)
📅 Date: Nov 04, 2025
📊 Main timeframe: H2 confirmation + M30 execution
🎯 Strategy: SMC + Liquidity Grab + OB Rejection
MARKET CONTEXT
Gold is currently trading around the 3970 zone after a clear Break of Structure (BOS) on the M30 timeframe, confirming short-term bearish pressure. On the H2 chart, price remains in a descending channel, forming lower highs since 4128 → 4006, aligning with overall bearish sentiment.
Recent CHoCH signals on M30 indicate that buyers tried to defend the 3980–3970 area twice but failed to sustain momentum. Liquidity was swept below minor lows, suggesting a potential continuation toward deeper liquidity pools near 3960–3955.
KEY LEVELS
SELL ZONE 1: 4025–4027
SELL ZONE 2: 4011–4013
BUY ZONE 1: 3980–3978
BUY ZONE 2: 3970–3968
TRADING IDEA
Current bias: Bearish, expecting a pullback before continuation.
If price retraces to 4011–4027, watch for rejection and BOS on M5/M15 to enter short.
TP1: 3978, TP2: 3960
SL: above 4027 (≈6 points)
Alternatively, if price sweeps liquidity below 3968 and shows strong CHoCH upward, consider scalp long back to 3980–3990, with SL below 3962 (≈6 points).
CONFIRMATION
M30: BOS down confirmed after CHoCH
H2: Resistance zone rejection aligning with trendline + EMA confluence
RSI showing mild bearish momentum, not yet oversold → room for downside continuation
OUTLOOK
As long as price remains below 4027, the bearish structure holds. Watch for liquidity grabs at support zone 3960–3970 before a potential short-term retracement. A clean break above 4030 would invalidate this plan and flip bias to neutral.
📌 Plan Summary
🎯 Sell the pullback at 4011–4027
🎯 TP: 3978 / 3960
🛑 SL: 4027 (6 points)

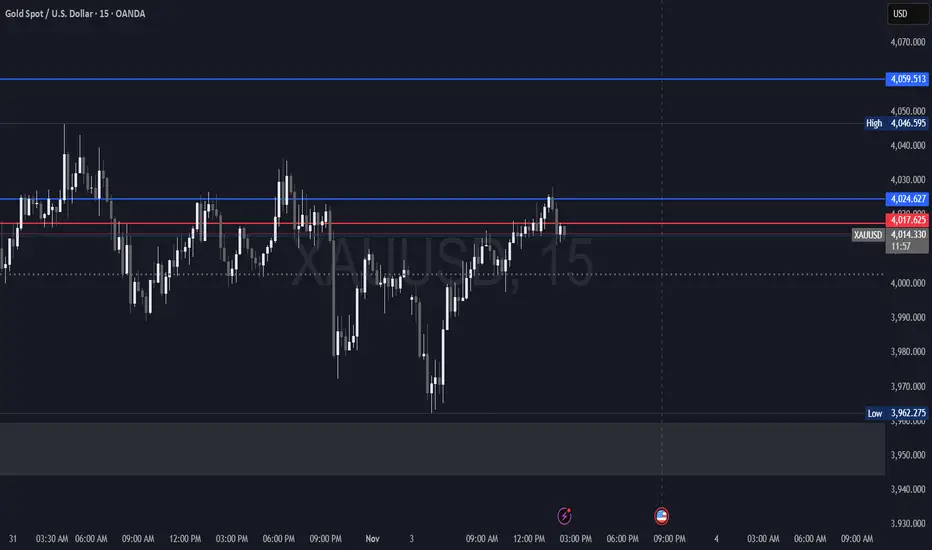
Gold Pauses Below $4,000 as Markets Digest Hawkish Fed Tone🔍 Market Context
Gold struggles to find direction in early Asia, hovering just below the $4,000 psychological level after the Fed’s hawkish remarks dampened bullish momentum.
Chair Jerome Powell reaffirmed that another rate cut this year is “not a given”, keeping yields supported and safe-haven demand balanced.
Meanwhile, ISM Manufacturing PMI fell to 48.7, signalling cooling momentum but not enough to alter the Fed’s cautious stance.
With odds of a December rate cut near 70%, gold remains trapped between policy uncertainty and soft macro sentiment.
📊 Technical Outlook (H1–H4)
Price is consolidating within a tight structure between 3,963$ and 4,024$, showing compression before a potential expansion move.
The 3,984$–3,963$ zone acts as short-term liquidity support, aligning with the rising intraday trendline.
Key Levels
• 💎 Liquidity Support: 3,963$ – 3,984$
• 🎯 Immediate Resistance: 4,024$
• ⚙️ Bullish Target: 4,046$ (liquidity sweep + expansion zone)
• ⚠️ Invalidation: Below 3,923$, bias shifts to neutral
A clean breakout above 4,024$ could trigger a move toward 4,046$, while failure to hold above 3,963$ may invite another liquidity grab before buyers re-enter.
🎯 MMFLOW View
Smart money remains patient.
As long as 3,963$ holds, dips are seen as accumulation rather than weakness.
But conviction only returns when liquidity confirms above 4,024$ — that’s where momentum aligns with intent.
⚜️ MMFLOW Insight:
“Liquidity doesn’t chase price — it creates the path for it.”

Elliott Wave Analysis – XAUUSD | November 04, 2025
🔹 Momentum
D1 timeframe:
D1 momentum has entered the overbought zone — this signals that the bullish momentum is weakening and a potential reversal could occur today or tomorrow.
H4 timeframe:
H4 momentum is currently in the oversold zone and preparing for a bullish reversal. This suggests that the market may produce 4–5 consecutive bullish H4 candles to lift momentum back toward the overbought region.
H1 timeframe:
H1 momentum is also turning upward, indicating that a short-term bullish phase may be forming.
________________________________________
🔹 Wave Structure
D1 timeframe:
A WXY corrective structure is forming. Wave W appears to be completed, and the current move is part of wave X.
However, this X wave seems relatively shallow, and with D1 momentum already in the overbought zone, there’s likely only one final upward push left to complete wave X before a possible reversal.
H4 timeframe:
Given that D1 is already overbought, the yellow wave (4) scenario remains the primary outlook.
Still, since H4 momentum is about to turn upward, there’s a high probability of one last upward movement to finish wave X before resuming a downward move.
H1 timeframe:
On H1, price action is forming a red WXY structure for wave X.
Wave W has already completed, and price is currently developing within wave X (red).
Inside this X wave, a black abcde triangle is taking shape, with price currently hovering near the lower boundary (ac line) of the triangle.
• If wave e (black) ends near the ac line, the triangle pattern will be complete → price is expected to break above the upper boundary, triggering an upward continuation as wave Y.
→ This aligns with the bullish reversal signals seen in H4 and H1 momentum.
• Conversely, if price breaks below the ac line and drops under 3927, it would suggest that the purple X wave on D1 has already completed, and the market may resume a downtrend following D1 momentum.
________________________________________
🔹 Trading Plan
• Buy Stop: 4000
• Stop Loss: 3973
• Take Profit 1: 4050
⚠️ Note: The current candle range is quite wide → stop loss is relatively large, so it’s advisable to reduce position size and manage trades carefully.

GOLD TRADING INSIGHTS TODAY WITH LUCYGOLD TRADING INSIGHTS TODAY WITH LUCY 💛
Hello everyone 🌸
The gold market (XAUUSD) today is showing many interesting signals as the price continues to test the crucial trendline area. Traders' sentiment is quite cautious at the moment – both buyers and sellers are “squaring off” around the liquidity balance zone.
🔍 Technical Analysis
On the chart, gold is moving within a narrowing triangle price channel – this indicates momentum is accumulating, and when the price breaks in either direction, the subsequent volatility will be very strong ⚡
Currently, the price is reacting around the main trendline, but there is no clear breakout signal yet.
In my personal view, the probability of a decline remains higher, however, further confirmation is needed before entering a trade.
The important point to note is the support area at 3965, which is the key boundary to confirm a clear downtrend.
If the price breaks through this area, the possibility of extending towards the Fibonacci 2.618 area around 3890 is entirely possible.
⚙️ Price Levels to Watch
Currently, the 3990 – 4012 area is short-term resistance, where sellers may reappear.
Meanwhile, the 3965 – 3945 – 3920 areas are the main supports that need close observation.
If the price continues to hold above 3945, the likelihood of a short-term rebound is quite high.
🎯 Today's Trading Scenario
💼 Buy: 3945
⛔ SL: 3938
🎯 TP: 3958 – 3977 – 3992 – 4012
💼 Sell: When the price clearly breaks below support 3965
⛔ SL: Above the breakout area
🎯 Expected TP: extending towards the Fibonacci 2.618 area around 3890
I still prefer to observe the price reaction at the trendline area, and only act when there is clear confirmation — because in a triangle pattern, the patient one will always be the winner 🌙
⚠️ Note & Conclusion
The above analysis reflects only Lucy's personal perspective, based on Trendline – Fibonacci – ICT factors 📊
This is not investment advice.
Please share your views on gold in the comments section 💬
And don't forget to follow Lucy for daily updates on insightful analyses —
where technical analysis merges with market emotions 💫🌸

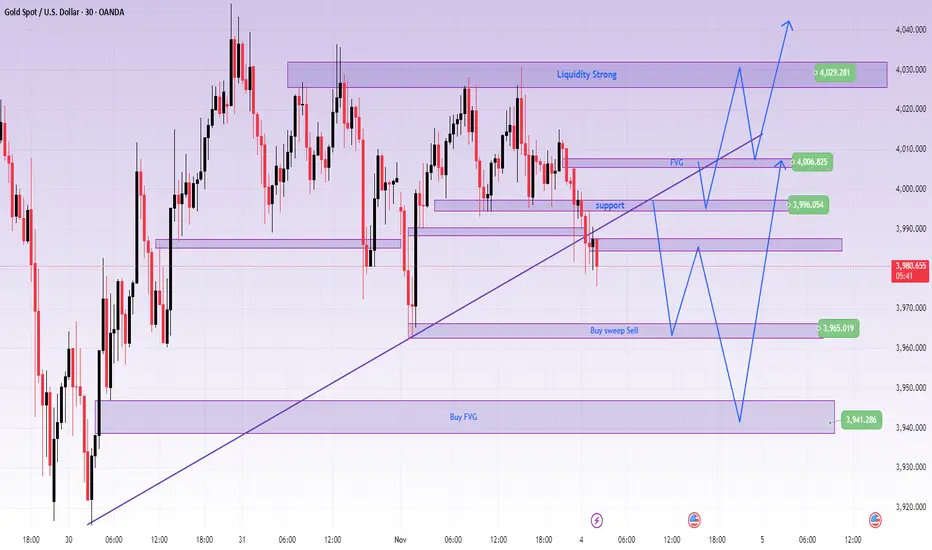
GOLD CONFIRMS SHORT-TERM DECLINE AFTER BREAKING TRENDLINEXAUUSD – GOLD CONFIRMS SHORT-TERM DECLINE AFTER BREAKING TRENDLINE
🪞 1. Overview
🌤️ In the Asian session this morning, gold broke the upward trendline even though the selling pressure wasn't particularly strong.
However, this is the first signal indicating that the short-term trend is leaning towards the sellers.
💬 Currently, the 3996 level is a significant resistance, and the price might retest this area before continuing to decline.
If the price surpasses the FVG at 4007, the trend might temporarily rebound in the short term.
💹 2. Technical Analysis (ICT Perspective)
🔸 Market structure: After breaking the trend, the structure temporarily shifts to short-term bearish.
🔸 Liquidity & FVG: Liquidity is drawn to the 3960–3940 area, while FVG 4007 is the first barrier.
🔸 Order Flow: Smart Money may lightly sweep up to the resistance area before pushing the price further down.
🎯 3. Reference Trading Scenarios
💔 MAIN SELL
Entry: 3996 | SL: 4004
TP: 3985 – 3972 – 3948
💢 SELL scalping
Entry: 4007 | SL: 4014
TP: 3998 – 3978
💖 REACTIVE BUY
Entry: 3965 | SL: 3957
TP: 3976 – 3988 – 3999
🌸 DEEP BUY
Entry: 3941 | SL: 3931
TP: 3955 – 3968 – 3988 – 4012 – 4066
🔍 4. Price Levels to Note
✨ 4007 → FVG resistance, short-term trend confirmation area
✨ 3996 → Retest area of the broken trendline
✨ 3965 – 3941 → Strong support area, likely to see reversal reactions
💬 5. Notes & Call for Interaction
⚠️ This is not an investment recommendation, but merely a personal technical perspective following the ICT method.
Observe the price reaction around the trendline carefully before making a decision 💭
If you find this post helpful, please 💛 like – 💬 leave a comment – 🔔 follow LanaM2
to stay updated with daily gold insights and learn more about the Smart Money Concept 🌷✨
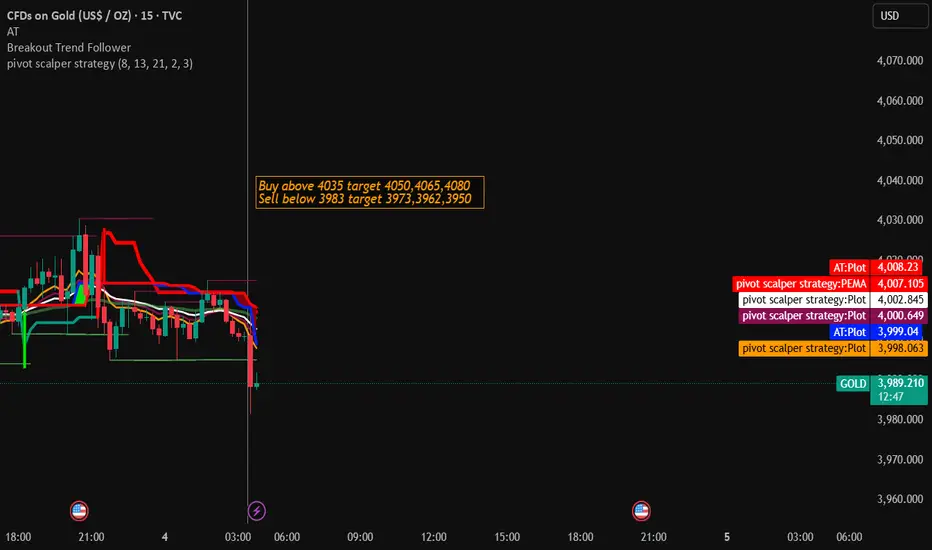
Gold Trading Strategy for 04th November 2025💰 GOLD TRADING PLAN (INTRADAY STRATEGY)
🟢 BUY SETUP (Bullish Scenario)
📈 Condition to Enter (Buy Entry):
➡️ Wait for a 30-minute candle to close ABOVE $4035.
➡️ Once a candle closes above this level, look to buy above the high of that same candle.
💵 Example:
Suppose a 30-min candle closes at $4036, and its high is $4038.
Then your Buy Entry would be above $4038.
🎯 Target Levels:
🎯 1st Target: $4050
🎯 2nd Target: $4065
🎯 3rd Target: $4080
🛑 Stop-Loss (SL):
Place SL below the low of that 30-minute candle (for example, if the candle’s low is $4025, set SL around $4024–$4025).
🔴 SELL SETUP (Bearish Scenario)
📉 Condition to Enter (Sell Entry):
➡️ Wait for a 1-hour candle to close BELOW $3983.
➡️ Once a candle closes below this level, look to sell below the low of that same candle.
💵 Example:
Suppose a 1-hour candle closes at $3982, and its low is $3980.
Then your Sell Entry would be below $3980.
🎯 Target Levels:
🎯 1st Target: $3973
🎯 2nd Target: $3962
🎯 3rd Target: $3950
🛑 Stop-Loss (SL):
Place SL above the high of that 1-hour candle (for example, if the candle’s high is $3992, SL can be set around $3993–$3995).
⚖️ RISK MANAGEMENT (Must-Read for Beginners)
✅ Risk only 1–2% of your total capital per trade.
✅ Always use a stop-loss — never trade without it.
✅ Avoid entering both buy and sell trades at the same time.
✅ Track your trades in a journal to improve over time.
⚠️ DISCLAIMER
⚠️ This analysis is for educational and informational purposes only.
📊 It is not financial advice or a guarantee of profit.
💡 Always do your own research or consult a certified financial advisor before trading.
🚫 Trading in gold and financial markets involves risk of capital loss.
Gold Trading Strategy | November 3-4✅ From the 4-hour timeframe, after a period of continuous consolidation, gold is still moving near the middle line of the Bollinger Bands, showing a weak sideways pattern in the short term. Short-term moving averages (MA5, MA10) are slightly turning downward, while MA20 above continues to suppress price. This indicates insufficient bullish momentum and weak continuation on the upside.
The Bollinger Bands are narrowing, and the middle band (around 3998) remains a key support level. Price has tested this area multiple times without breaking below, but lacks effective upward breakthroughs, reflecting a low-volume consolidation structure. Both upside and downside space are limited, keeping the market in a narrow-range fluctuation.
✅ From the 1-hour timeframe, gold is facing repeated pressure below 4050, weakening once again. Short-term moving averages (MA5, MA10) have turned downward, and the price is now trading below the short-term moving average cluster, indicating rising bearish sentiment in the short term. The Bollinger middle band (around 4007) has become a short-term pivot. Currently, price is operating below it, with a slightly bearish structure.
The Bollinger Bands are opening downward, and price is moving near the lower band, suggesting concentrated selling pressure. If price fails to quickly reclaim the middle band, further downward retests of support are likely.
🔴 Resistance Levels: 4030 / 4050 / 4080
🟢 Support Levels: 3998 / 3968 / 3933
✅ Trading Strategy Reference:
📌 If gold rebounds into the 4025–4030 zone and shows obvious rejection, consider light short positions, targeting 4005–3998.
📌 If gold pulls back to 3965–3970 and holds, consider light long positions from lower levels, targeting 4020-4030.
🔥 Gold is currently in a short-term bearish, medium-term consolidation structure. Downside support remains strong, limiting bearish continuation, while dense resistance above makes bullish breakouts difficult. Volatility is shrinking, and capital is showing hesitation. This is a typical event-driven waiting phase, where neither side can form a strong trend until momentum is clearly released.
It is recommended to trade within the range, buying low and selling high. Conservative traders should wait patiently for a directional breakout and then follow the trend for safer and more stable results.

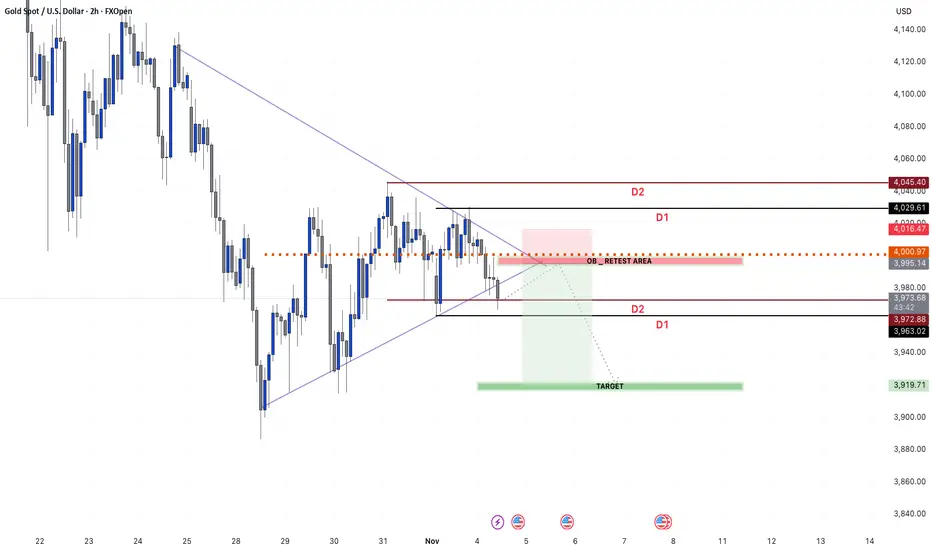
XAU/USD – Gold Accumulating Before Breakout, Target 4,096 USD🔍 Market Context
Gold is trading within a symmetrical triangle pattern , indicating short-term accumulation before forming a new breakout wave.
Following a sharp decline from the peak region of 4,096 USD, the market has shown two instances of Change of Character (ChoCH) – early signs of buying pressure returning.
As long as the price holds above the 3,959 – 3,917 USD zone, the short-term bullish structure remains intact. This support zone acts as a crucial “discount zone” in the current accumulation cycle.
💎 Key Technical Zones
• Support Zone 1: 3,959 USD → main structure holding zone, coinciding with the lower trendline.
• Support Zone 2: 3,917 USD → final liquidity reaction zone.
• Resistance Zone: 4,040 USD → potential break & retest zone.
• Liquidity Zone: 4,096 USD → expansion target if the peak is breached.
🎯 Trading Scenarios
1️⃣ BUY Setup – Prioritise bullish structure
• Entry: 3,959 – 3,917 USD
• Stop Loss: 3,905 USD
• Take Profit:
– TP1: 3,985
– TP2: 4,040
– TP3: 4,072
– TP4: 4,096
✳️ “Buy the discount” – prioritise buy orders at the confluence support zone of trendline + FVG to follow the SMC flow.
2️⃣ SELL Scalp – Secondary strategy when price reacts at the peak
• Entry: 4,096 USD
• Stop Loss: 4,108 USD
• Take Profit:
– TP1: 4,072
– TP2: 4,040
– TP3: 3,985
✳️ “Sell the premium” – only activate if there is a strong price rejection signal at the liquidity peak.
💬 Summary
The short-term trend of gold remains bullish as the price stays above the trendline and continuously forms higher lows.
The main strategy is buy the dip – sell reaction around the 3,959 → 4,096 USD zone.
The confirmation of a strong uptrend will be when the price closes steadily above 4,040 USD .
“Smart money accumulates in silence before the market makes noise.”
⏰ Time Frame: 1H
📅 Update: 03/11/2025
✍️ Analysis by: Captain Vincent

Leading Diagonal possibleIts still possible to complete a leading diagonal and then a wave 2 down.
Or it will turn into a running flat inside an expanding flat.

Gold Squeeze: Range Breakout Can Trigger $4,100+ MoveLooking at the current gold price action on the H1 chart, we're seeing a technical setup that's been developing over the past several sessions. The market has clearly established a well-defined range between approximately $3,900 and $4,040, with price respecting both the upper and lower boundaries quite consistently.
price is holding above this ascending support while simultaneously testing the middle-to-upper zone of the range suggests building bullish momentum.
We've seen multiple attempts to push lower get absorbed by buyers, creating a series of higher lows that demonstrate underlying strength. The grey horizontal zone around $4,020-$4,040 represents the key resistance level where sellers have previously shown up, but notice how price action is becoming increasingly compressed near this level a classic sign that a breakout may be imminent.
From a probability standpoint, the combination of higher lows, sustained buying interest, and the current positioning near range highs favors an upside breakout. If gold manages to close convincingly above $4,040, we could see an accelerated move toward the $4,100+ zone fairly quickly, as there's limited technical resistance overhead once this range ceiling is breached.
However, it's worth noting that range-bound markets can be deceptive, and false breakouts are always a possibility. The key will be watching for a decisive move with strong volume and follow-through. Until we get that confirmation, remaining patient with existing positions while maintaining appropriate risk management makes sense.
The market appears coiled and ready to make its next significant move all signs point to higher prices, but as always, let the price action confirm the breakout before adding to positions.

SHORT SCALP IN XAUUSD GOLD AT RESISTANCE and will be selling here with SL above swing breaking resistance and target at 3999 .