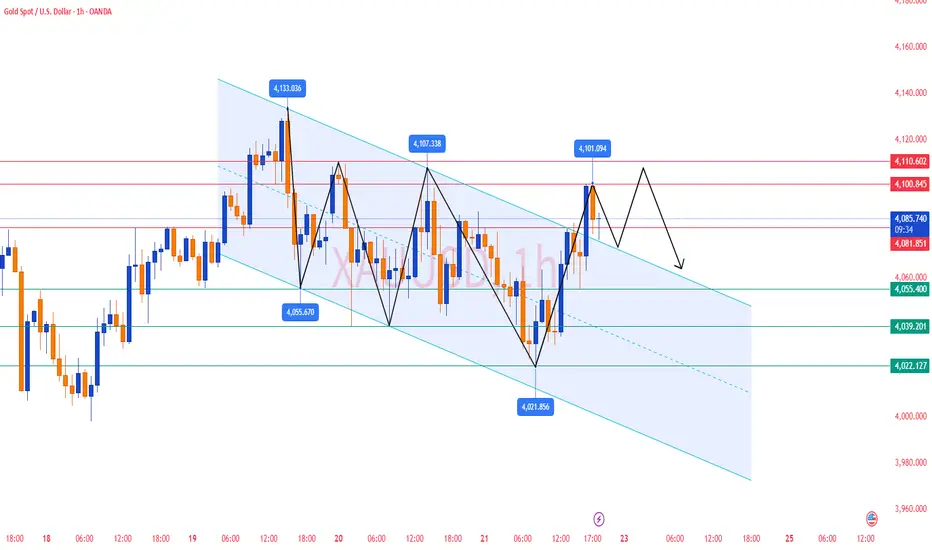
Gold Analysis and Trading Strategy | November 21-22✅From the 4-hour timeframe, gold rebounded strongly to 4101 (previous high + Bollinger upper band + MA20 resistance) and then quickly fell back to the 4080 area, indicating that selling pressure at higher levels remains very strong.
1️⃣ Moving averages remain bearish
MA5 and MA10 have turned upward slightly, but overall still remain below MA20.
MA20 (around 4155) acts as strong resistance, and the failure to break above shows the rebound is still a weak corrective move, not a trend reversal.
2️⃣ Bollinger Bands remain weak
Price continues to trade near the Bollinger mid-band (around 4071) and has failed multiple times to break the upper band.
The Bollinger Bands have not expanded upward, indicating the market is still in a weak, range-bound structure.
3️⃣ Clear rejection signal
A long upper wick formed at 4101 — a classic “spike and reversal” pattern.
Bears aggressively sold at resistance, forming a clear short-term top.
📌 H4 Conclusion:
Rebound met resistance, the market remains in a weak corrective phase, and no bullish reversal structure has formed.
✅ On the 1-hour timeframe, gold rebounded strongly from 4022 → 4101, but still failed to break through key resistance.
1️⃣ Rebound failure at 4101 → structure shifts to consolidation
After touching 4101, gold quickly pulled back to the 4080 area, showing weakening bullish momentum.
This level corresponds to previous highs + Bollinger upper band resistance, making a breakout difficult.
2️⃣ Moving averages continue to suppress
MA10 / MA20 / MA60 remain in a bearish configuration; the H1 structure has not turned bullish.
Although 4080 provides support, rebound highs are gradually decreasing, signaling fading momentum.
3️⃣ Short-term rebound strength is limited
The most recent rebound only reached MA10 and failed to regain key levels.
This confirms the bounce is a weak correction, not a structural trend change.
📌 H1 Conclusion:
Short-term spike faded, structure remains weak, and rebound is unlikely to break above the 4100–4110 strong resistance zone.
🔴 Resistance Levels
4100–4110 (major resistance zone: previous high + MAs + Bollinger upper band)
4132
4155
🟢 Support Levels
4075–4070
4044–4038
4022
3997
✅If you would like to receive real-time trading signals and professional guidance, you are welcome to join our membership. We provide comprehensive services including account risk management, position control, and strategy adjustments to help you achieve stable and consistent profits in the market🤝
✅ Trading Strategy Suggestions (Key Focus Today)
🔰 Strategy 1: Sell the Rebound (Primary Strategy)
If gold rebounds to 4095–4105 and faces rejection:
✔️ Light short positions
❌ Stop-loss: 4118 (exit immediately if price breaks above 4110)
🎯 Targets: 4075 / 4055 / 4040
👉 Reason: 4100–4110 is extremely strong resistance with low probability of a breakout.
🔰 Strategy 2: Short After a Failed Breakout
If price makes a false breakout above 4110 but fails to hold:
✔️ Enter short immediately
🎯 Same targets as above
⚠️ A long upper wick is a bearish signal.
🔰 Strategy 3: Trend-Following Short on Breakdown
If gold breaks 4038–4044:
✔️ Follow with breakout shorts
🎯 Targets: 4022 / 4008 / 3997
👉 This zone is the key dividing line; breaking it gives full control to the bears.
🔥Trading Reminder: Trading strategies are time-sensitive, and market conditions can change rapidly. Please adjust your trading plan based on real-time market conditions.
Trade ideas
Elliott Wave Analysis XAUUSD – 28/11/2025Hello my friends, let’s update the Elliott Wave analysis on Gold together to see how the wave development may unfold today.
1. Momentum
Momentum D1
D1 momentum is currently contracting. We need to wait for a strong bearish daily close to confirm a momentum reversal. Once confirmed, the market may enter a downward phase lasting 4–5 days.
Momentum H4
H4 momentum is also narrowing, suggesting a potential short-term downside reversal. However, note the following:
• Price highs and momentum highs are forming higher highs and higher lows, which still supports the bullish structure.
• If H4 momentum truly reverses and moves into the oversold zone, price must break below 4142 to confirm a structural break and signal a genuine trend reversal.
Momentum H1
H1 momentum is turning downward and is aligned with H4. I expect the current price area to be the potential wave top.
________________________________________
2. Wave Structure
Wave Structure D1
The D1 wave structure remains unchanged. With D1 momentum still converging, price action continues to show slow upward movement.
• If price breaks above 4243, the 5-wave structure of the purple Y wave is invalidated.
• In that case, a different wave structure will be triggered (as mentioned in the previous plan), and I will update you when it occurs.
Wave Structure H4
We continue to follow the green ABC corrective structure, with price currently in wave C (green).
• As H4 momentum is in the overbought zone, I expect the current region to be the top of wave C.
• If H4 momentum dips into the oversold zone and price breaks below 4142, this will confirm a structural breakdown.
• However, if momentum enters oversold while price stays above 4142, we must be prepared for a continued bullish move.
Wave Structure H1
Yesterday, the RSI on H1 showed divergence, suggesting a possible completion of wave C. However, with the additional push during the Asian session, wave C likely extended further. Price is now at the target zone calculated earlier.
• With D1, H4, and H1 momentum all preparing to reverse, I expect the current price zone to be the top of wave C.
________________________________________
3. Trading Plan
The current price region remains our preferred SELL zone.
During the next H4 momentum cycle:
• If momentum enters the oversold zone but price fails to break below 4142, we should consider exiting early to protect capital.
Trade Setup
• Sell Zone: 4187 – 4190
• Stop Loss (SL): 4210
• TP1: 4158
• TP2: 4112
• TP3: 4081

Gold Awaits PPI & GDP – Buy Dips, Sell Rallies🟡 XAU/USD – PPI & GDP Data to Define Range Expansion
🔍 Market Context
Gold remains range-bound between $4000–$4100, consolidating after last week’s liquidity sweep.
This week’s key U.S. data — Core PPI, Retail Sales, GDP, and Core PCE — will likely dictate the next major move.
Slight improvement in inflation and consumption data could strengthen the USD temporarily, but overall bias remains bullish mid-term as the Fed is expected to maintain a dovish stance into Q1.
📊 Technical Outlook (4H Chart)
Main Sell Zone (Super OB): 4170–4200 → potential reversal supply zone.
Fair Value Gap (FVG): 4130–4160 → short-term reaction zone if price retraces.
Sell Zone: 4090–4095 → short opportunity aligned with intraday bearish structure.
Buy Zone 1: 4024–4025 → minor demand, expecting internal liquidity sweep.
Buy Zone 2 (Main OB): 4003–4001 → strong order block with multiple rejections; key liquidity pool.
Structure: H4 BOS (Bullish) intact, suggesting a liquidity sweep before next expansion upward.
🎯 Trade Plan
1️⃣ SELL Setup – Short-term reaction from FVG
Entry: 4090–4095
Stop Loss: 4100
Take Profit 1: 4055
Take Profit 2: 4040
Take Profit 3: 4025
➡️ Reasoning: Price is likely to tap the lower edge of FVG and sweep local liquidity before a downside reaction toward internal range demand.
2️⃣ BUY Setup – First demand zone test
Entry: 4024–4025
Stop Loss: 4022
Take Profit 1: 4065
Take Profit 2: 4080
➡️ Reasoning: Expecting a short-term liquidity grab below the mid-range before bullish continuation.
3️⃣ BUY Setup – Main OB accumulation zone
Entry: 4003–4001
Stop Loss: 3998
Take Profit 1: 4045
Take Profit 2: 4075
Take Profit 3: 4090
➡️ Reasoning: Deep liquidity zone aligning with higher-timeframe OB. If macro data disappoints, this area can trigger the next impulsive leg to retest 4170+.
🧭 Overall Bias
→ Ranging bias before Core PCE
→ Buy dips – Sell rallies within 4000–4100 until a clear breakout post-GDP/PCE data.
→ Watch for false breakouts around FVG and maintain risk control before U.S. session releases.

Part 2 Intraday Trading Master ClassMargin and Risk Management
Option buying requires no margin except the premium.
Option selling requires high margin because:
Risk is unlimited.
Exchanges demand safety.
Risk Management Rules
Never sell naked options without stop-loss.
Avoid selling during high volatility events.
Use spreads to reduce risk.
Position size properly—do not over-leverage.

Gold Reaches Exhaustion Zone — Sell Momentum LoadingGold Reaches Exhaustion Zone — Sell Momentum Loading
Gold is showing signs of upside exhaustion, with price repeatedly failing to gain momentum as it approaches the mid-range premium zone near the 4,245 area. The recent structure reflects a market transitioning from short-term recovery into renewed weakness, with each bullish attempt losing strength faster than the previous one.
Order flow remains dominated by distribution behaviour, and the chart signals a potential liquidity sweep followed by a bearish continuation. The projected rejection zone suggests that buyers are running into an area of heavy supply, where institutional activity has previously triggered aggressive downside extensions. Volume distribution across the range also highlights diminishing demand at higher prices, reinforcing the likelihood of a downward rotation.
As the market continues to respect its broader range ceiling, the probability increases for price to revisit deeper value regions. With momentum fading and the current leg showing hesitation, gold is positioned for a potential sell-side move toward lower mean-reversion levels.

LiamTrading – XAUUSD H1 | Gold breaks bullish structure...LiamTrading – XAUUSD H1 | Gold breaks bullish structure, short-term downside takes control
Gold has dropped sharply by more than $20 in a short time, losing over 1% on the day and moving close to the lower 4,030 area. The previous bullish structure has officially been broken, 4040 failed to hold, and today’s focus continues to be selling with the trend until the 4000–398x support zone shows clear reactions.
Macro Analysis
Gold prices declined as expectations for a December rate cut weakened: JPMorgan no longer forecasts a Fed rate cut in December, opposite to their earlier 25 bps cut scenario.
Some institutions still believe rising unemployment and weaker economic data may force the Fed to cut 25 bps at the upcoming meeting.
The market is currently pricing the probability of a December rate cut at nearly “50–50,” creating strong uncertainty and putting short-term pressure on gold, even though the metal still benefits in the long term if the rate-cut cycle begins.
Technical Analysis H1 – Bearish structure, price channel, and support zones
After breaking below 4040, price formed a series of Lower Highs – Lower Lows, confirming a Dow-theory bearish structure on H1.
A falling channel is forming; the channel’s upper boundary aligns with the short-term resistance zone at 4050–4060.
4000 zone: a key psychological support. If broken decisively, the medium-term structure may shift into a deeper corrective phase.
Buy Zone 3987–3989
Strong support confluence + Fibonacci extensions (1.618/2.272) of the current bearish swing
Optimal area for catching a corrective bounce if clear reversal signals appear
Key Resistance Levels Today
4052–4054: retest of former support + upper boundary of falling channel → ideal area for a pullback-sell setup.
Trading Scenarios Today (LiamTrading)
Scenario 1 – SELL with the prevailing downtrend (priority)
Entry: 4052–4054
SL: 4060
TP: 4030 → 4015 → 3990
Logic: Price retraces to resistance + channel top, suitable for trend-continuation selling. Prefer setups where M15 shows rejection candles (pin bar/bearish engulfing) around 405x.
Scenario 2 – BUY at strong support 398x (counter-trend bounce)
Entry: 3987–3989
SL: 3980
TP: 3999 → 4014 → 4040 → 4080
Logic: 398x is a high-confluence support zone; trigger only when clear price reaction appears (long lower wicks or reversal patterns on M15–H1).
This is counter-trend, so use smaller position sizes and take partial profits.
Risk Notes & Invalidation
H1 closes above 4060: short-term bearish structure weakens → pause all sell setups and reassess.
H1 closes below 3980: buy zone fails → downside could extend further; only sell setups preferred.
Always keep risk per trade at 0.5–1%, and once reaching +1R, move SL to break-even.
Are you leaning towards continuing to sell with the trend, or waiting to buy the dip at 398x?
Follow LiamTrading on TradingView for daily XAUUSD updates

XAU/USD Near Breakdown – Bears Eying Liquidity SweepGold remains under pressure after a stronger-than-expected NFP print reduced near-term Fed rate-cut expectations.
The USD stays moderately supported, while weak risk sentiment keeps gold in a cautious, defensive phase.
📊 Technical Snapshot (H1–M30)
Price continues to reject the descending trendline and the supply zone 4,054–4,078.
Lower highs structure intact → bearish momentum remains dominant.
Liquidity pockets sit at 4,013 and especially 3,989, a key downside magnet.
Any pullback toward 4,054 is likely just a retest before continuation lower.
🎯 MMF Intraday Plan
Primary Bias: SELL – follow the trend
Sell 4,054–4,078
SL: 4,090
TP: 4,013 → 3,989 → 3,975
Countertrend BUY (only at deep liquidity):
Buy 3,985–3,990
SL: 3,972
TP: 4,013 → 4,054
⚡️ MMF View
As long as price stays below the trendline and lower-high structure, gold remains in distribution.
A sweep of the 3,99x liquidity zone is highly likely before any meaningful reversal can form.

Gold Turning BEARish #XAUUSD turning BEARish 🐻
Now at 4060.
SELL on RISE 🤞
Expecting significant downside moves
that may last for a couple of hours...
Until trades below 4064 weak trend wud remain
&
wud get intensified after crossing 4049-51 range...🤞
Expected to hit-
TP 1: 4041
TP 2: 4029
TP 3: 4019
SL: 4087

XAUUSD GOLD Analysis on (27/11/2025)#XAUUSD UPDATEDE
Current price - 4157
Best Buy Area - 4131-4129 (Stop loss -4110)
BUY TARGET - 4175-4191

GOLD / XAUUSD - Classic Example of Liquidity GRAB
TF: 30 Minutes
CMP: 4075
GOLD and Silver seem to have completed the corrective rise and ready to tumble down.
In case of GOLD, price got rejected from the 50% fib level of the A leg and now resuming the C leg down.
The channel, possible price action etc, all are marked in the chart published herein.
In addition, the classic example of Liquidity GRAB concept is explained in the charts below.
The alternate case is that, in this 4th wave (larger degree TF), GOLD could be forming a Triangle (3 subwaves within the abcde triangle wave) and then move higher.
Either case, price should be testing the recent swing lows soon.
It purely depends on how the buyers would react when the price reaches 3900 levels..
My Bias is on the Simple ZIG/ZAG ABC correction to move below 3700 USD
Lets review the moves at each of the levels to come.
Disclaimer: I am not a SEBI registered Analyst and this is not a trading advise. Views are personal and for educational purpose only. Please consult your Financial Advisor for any investment decisions. Please consider my views only to get a different perspective (FOR or AGAINST your views). Please don't trade FNO based on my views. If you like my analysis and learnt something from it, please give a BOOST. Feel free to express your thoughts and questions in the comments section.

XAUUSD is skyrocketing after the Adam & Eve pattern!OANDA:XAUUSD is really interesting right now. The price seems likely to rise further after the formation of the Adam & Eve pattern. With such an easy-to-remember name, the Adam & Eve pattern is one of the most memorable. Below, I’ll explain the reasons and how to easily recognize it.
The Adam pattern is characterized by a sharp drop, followed by a quick recovery, forming a "V" on the chart. High, sharp, and aggressive! You could say it's more "masculine."
On the other hand, the Eve pattern develops more slowly. The price becomes more rounded, forming a wider and smoother base before rising again, creating a shape similar to the letter "U." Softer, more curved, and more "feminine."
Combining these two elements gives us the Adam & Eve pattern, which often signals a potential trend reversal. Especially when accompanied by fundamental analysis or other strong technical indicators.
This pattern will stick in your mind when you connect its shapes to the male and female aspects. A pattern that's truly hard to forget.

#XAUUSDPlease stick to your strategies
Any resistance will lead to big losses
Never take revenge on the market if a loss is triggered
Close the trade if the channel ceiling is broken

XAUUSD – H2: The Discount Zone Is Formed, Now Waiting for ...XAUUSD – H2: The Discount Zone Is Formed, Now Waiting for Price to Retrace for Continuation Buys
On the H2 timeframe, gold has just made a strong breakout above the 4,180 zone after a period of tight consolidation. Since it is the weekend and also Thanksgiving in the US, I will only prioritise pullback buys at discounted levels — absolutely no chasing price at the highs.
🎯 PRIMARY SETUP – BUY THE DIP at Fibo & POC Zone (4.163–4.160)
Buy Entry: 4.163 – 4.160
Stop Loss: 4.155
Take Profit: 4.178 – 4.195 – 4.220
⭐ SECONDARY SETUP – DEEPER BUY at VAL + Strong Support (4.139–4.136)
Buy Entry: 4.139 – 4.136
Stop Loss: 4.130
Take Profit: 4.150 – 4.172 – 4.190 – 4.220
I always keep total risk per setup within 1–2% of the account.
Fundamental Context
Weekend + Thanksgiving → thin liquidity, more price whipsaws near the close.
Recent comments from Trump & credit data show the economic picture and the December rate path are still uncertain.
This keeps gold supported as a defensive asset, but not strong enough to expect a straight-up rally.
Therefore, I prefer trading based on technical levels and clear zones.
Technical Analysis – H2
Market Sentiment & Trading Outlook
After the breakout, buyers still hold momentum, but the sideways movement at the top suggests partial profit-taking and liquidity patience.
In thin liquidity conditions, price often makes a liquidity sweep down into support before reversing — exactly the move I aim to catch.
Plan
Prioritise Buy at 4.163–4.160.
Only consider the deeper 4.139–4.136 setup if price flushes harder.
All trades use strict Stop Losses (4.155 & 4.130) — no widening.
Take partial profits step-by-step and trail SL as price approaches TP levels.

Gold H1 – Liquidity Plays as Hassett Leads Fed Chair Race🟡 XAUUSD – Intraday Smart Money Plan | by Ryan_TitanTrader (26/11)
📈 Market Context
Gold opens the week reacting to fresh political headlines as Kevin Hassett emerges as the frontrunner for Trump’s next Fed Chair.
This matters for gold because:
• A hawkish-leaning Fed Chair pick typically strengthens USD and weighs on gold.
• Markets may price in tighter policy expectations, increasing short-term bearish pressure.
• Political volatility ahead of the official announcement often triggers liquidity grabs on both sides.
With sentiment shifting toward a stronger USD, gold is positioned for classic SMC-style sweeps around key premium and discount zones.
🔎 Technical Analysis (1H – Smart Money Structure)
• Market Structure
Price has tapped into a minor premium zone and is showing early rejection signs.
Below, the 4140–4138 area aligns with intraday demand and the origin of recent displacement.
• Premium Sell Zone (1H Supply)
4210 – 4212
• Sits above current buy-side liquidity
• Clear premium relative to intraday structure
• High-probability sweep zone before any downside displacement
• SL region: 4220 liquidity pocket
• Discount Buy Zone (1H Demand)
4140 – 4138
• Previous CHoCH origin
• Aligns with discount retracement
• Confluence with unmitigated internal demand block
• SL region: 4130 sell-side liquidity
• Liquidity Map
• Buy-side: 4212 → 4220
• Sell-side: 4138 → 4130
Expect the typical SMC sequence:
Sweep → CHoCH → Displacement → Retest → Expansion.
🔴 Sell Setup – Premium Reaction
Entry: 4210 – 4212
Stop-Loss: 4220
Take-Profit:
→ 4160 (reaction level)
→ 4145 (mid-range liquidity)
→ 4140–4138 (discount zone retest)
📌 Only activate after a liquidity sweep + bearish CHoCH on M5–M15.
🟢 Buy Setup – Discount Reaction
Entry: 4140 – 4138
Stop-Loss: 4130
Take-Profit:
→ 4160 (intraday reaction)
→ 4185 (premium edge)
→ 4210 (liquidity sweep target)
📌 Valid only after sell-side sweep + bullish CHoCH.
⚠️ Risk Management Notes
• Headlines around the Fed Chair nomination may create sudden USD strength spikes—wait for structure shifts.
• Avoid trading inside the chop zone 4150–4180 without clear displacement.
• Treat today as a liquidity-driven session, not a directional trend day.
📝 Summary
Gold is rotating between premium and discount zones as markets digest news of Kevin Hassett leading the Fed Chair race, a development that could tilt expectations toward firmer policy.
Institutional players are likely to hunt liquidity above 4210 or below 4140 before committing to direction.
Key Levels Today (26/11)
🔴 Sell Zone: 4210–4212
🟢 Buy Zone: 4140–4138
Prepare for:
Accumulation → Sweep → Displacement → Retest → Target.
📍 Follow @Ryan_TitanTrader for daily Smart Money updates.

Strong news chain could push gold to retest 4300🟡 XAU/USD – Weekly Trading Plan (Nov 23–29)
SMC – FVG – Supply/Demand – High-Impact News Week
1. Market Context
Gold is sideways in the H4 accumulation structure, forming higher lows along the trendline.
Above are 3 important supply layers:
OLD FVG 1
OLD FVG 2
Large FVG 4220–4300
the price needs to sweep liquidity & hit the supply zone before creating a new direction.
2. Strong News Schedule for the Week
This week has a lot of USD news directly affecting gold:
Tuesday (Nov 25)
Core PPI – Retail Sales – PPI (4 consecutive red news) → strong volatility.
Wednesday (Nov 26)
Unemployment Claims
Durable Goods → Core Durable Goods
GDP q/q – GDP Price Index
Core PCE (most important inflation news of the week)
➡️ This is the decisive day for the trend for the rest of the week.
Friday (Nov 28)
German CPI (affects EUR → USD indirectly)
🎯 News Conclusion:
→ Gold likely to fake move – sweep liquidity before running correctly.
→ Thin SL zones will be continuously hunted.
3. Key Levels (from the chart you sent)
🔻 SELL Zone (Supply – FVG)
4189 – 4191 (Main Sell)
SL: 4195
This is a strong reaction zone for the week.
4132 – 4134 (Sell scalp)
SL: 4138
🔵 BUY Zone (Demand – Trendline – SMC)
4906 – 4904 (main BUY scalp zone in the chart)
SL: 3999
→ This is the only zone clearly marked as BUY in the chart.
Psychological level: 4000 – 3985
If the price falls → strong reaction to form the weekly low.
4. Weekly Trading Scenarios
🅰️ Scenario 1 – Price retraces to supply zone before dropping (most likely)
Price is forecasted to retest 4132–4134 → 4189–4191
After hitting 4190 ± → potential appearance of:
Bearish BOS H1/H4
Strong reversal to 4050 – 4000
🔻 SELL Plan
Sell 4132–4134 (scalp) SL 4138
Main Sell 4189–4191 SL 4195
TP targets:
TP1: 4090
TP2: 4050
TP3: 4000
🅱️ Scenario 2 – Price dips before news then surges (kill liquidity)
If gold is pushed down before PPI/GDP news:
Best BUY zone: 4000 – 3985
Form a low → surge back up to test supply.
🔵 BUY Plan
BUY 4000–3985
SL: 3975
TP:
4050
4100
4130
🅾️ Scenario 3 – If 4200 breaks
If 4200 is broken by a large-bodied H4 candle:
➡️ High probability gold will move up to test large FVG 4250–4300
→ At that point, only look for BUY pullbacks, no more SELL.

XAUUSD – Inverse Head and Shoulders Pattern Still Active...XAUUSD – Inverse Head and Shoulders Pattern Still Active, Continue to Prioritise Buying at POC
I maintain the view that the current dominant trend is buying based on the inverse head–and–shoulders structure, and the bullish wave is not yet complete. The plan is to wait for price to retrace into the POC zone to re-enter with the trend, avoiding chasing buys at the highs.
🎯 Main Scenario – BUY THE DIP AT POC
Buy: 4,133 – 4,130
SL: 4,123
TP: 4,155 – 4,178 – 4,200 – 4,250 – extended targets if momentum remains strong
For me, total risk per trade never exceeds 1–2% of the account. A good setup with poor risk management is still a bad trade.
1. Fundamental Context
Gold is maintaining its upward momentum, trading near its highest levels in about two weeks.
The US Dollar is weakening as markets increase bets on the Fed cutting rates soon, following data showing continued cooling in inflation.
Lower yields and a softer USD reduce the opportunity cost of holding gold, supporting the flow back into safe-haven assets.
With this backdrop, I do not prioritise large sell setups. Most pullbacks are mainly opportunities for me to accumulate long positions.
2. Technical Analysis & Market Sentiment
On the H1 timeframe, gold has formed and activated an inverse head–and–shoulders pattern, confirming a bullish reversal phase.
Price is retracing to retest the POC zone around 4,133–4,130, overlapping the previous accumulation area where heavy sell orders were absorbed. This is the zone I prioritise for buying.
Below this lies a deeper FVG acting as secondary support; however, I’m not waiting for price to drop too far to avoid missing the core move of the pattern.
Regarding price behavior, recent pullbacks have been absorbed quickly, with multiple long-wick candles showing buyers are still in control. I’m waiting for a clean pullback into POC with a strong bullish reaction to trigger the entry.
3. Action Plan
Only enter positions when price returns to the 4,133–4,130 zone — absolutely no FOMO buying at higher levels.
Take partial profits at 4,155 – 4,178 – 4,200 – 4,250, leaving the remaining position open if gold continues to extend its bullish leg.
If price breaks below 4,123 and closes under that level, I will cut the trade immediately and reassess the structure — never hold on to a bias when the market has changed.
If this analysis is helpful, follow my TradingView channel and leave your comments. I always read feedback to improve and refine my future posts.

Building a Quarterly Results Trading Checklist1. Pre-Earnings Preparation: Setting the Foundation
Before any earnings are announced, traders must prepare. Preparation removes guesswork and gives clarity. Key factors include:
a. Identify High-Impact Companies
Not all results move the market equally. Focus on:
Large-cap companies
Sector leaders
Companies with a history of large earnings-day volatility
Stocks with heavy FII/DII ownership
Companies with recent major news (M&A, regulatory changes, product launches)
These stocks typically see stronger price reactions.
b. Know the Earnings Date
Many traders get caught off guard because they miss the exact results-announcement timing. Check:
Whether results are announced before market, during market, or after market close
If management commentary or concall is on the same day or the next day
Timing helps you plan intraday or positional trades better.
c. Study the Previous Quarter’s Performance
Review the last 2–3 earnings releases. Note:
Revenue growth trends
Margins (EBITDA, PAT)
Management guidance accuracy
Market reaction to previous results
Surprise elements (positive or negative)
This helps form expectations about whether the upcoming result can challenge or follow historical patterns.
d. Analyze Expectations (Street Estimates)
Quarterly results trading is more about expectations vs. reality than actual performance. Expectations come from:
Analyst projections
Bloomberg/Refinitiv consensus
News flow
Channel checks
Management guidance
If expectations are too high, even decent results can cause the stock to fall.
2. Fundamental Metrics to Watch in Results
Quarterly results contain dozens of data points, but traders should focus on the most high-impact ones. These include:
a. Revenue Growth
Shows overall demand. Compare YoY and QoQ growth:
YoY reveals long-term momentum
QoQ signals near-term growth consistency
b. Profit Margins
Margins show operational efficiency. Key margins:
Gross margin
EBITDA margin
PAT margin
Expanding margins often result in bullish moves.
c. Profit After Tax (PAT)
A company may show revenue growth but shrinking profits due to higher costs. Such divergences significantly impact stock direction.
d. Guidance and Commentary
Often more important than the numbers themselves. Traders watch:
Next quarter revenue outlook
Margin guidance
CapEx plans
Industry demand expectations
Management tone (optimistic, neutral, cautious)
Negative guidance can tank the stock even if the reported numbers are strong.
e. Segment-Wise Performance
Multi-segment companies like Reliance, Tata Motors, or IT companies require detailed segment analysis:
Which segment grew/dropped?
Is the core business performing well?
Are new initiatives gaining traction?
This helps identify future revenue drivers.
3. Technical Checklist Before Trading Results
Fundamentals show what happened; technicals show how traders positioned themselves before results.
a. Identify Key Support and Resistance Levels
Mark:
Major swing high and low
20-, 50-, 200-day moving averages
Trendline support
Supply zones
These levels help shape entry and exit plans.
b. Assess Pre-Earnings Momentum
Check if the stock is:
Running up before results (a sign of high expectations)
Consolidating (indecision)
Selling off (low investor confidence)
Stocks that run too fast ahead of earnings often correct even on good results.
c. Volume Analysis
Higher volumes before results indicate:
Institutional positioning
Potential for large post-earnings moves
Smart money activity
d. Volatility Check
Recent volatility helps determine:
Lot sizes
Stop-loss width
Position sizing
Whether to take a trade at all
If volatility is extreme, avoid leveraged positions.
4. Crafting the Trading Strategy
Once fundamentals and technicals are studied, create actionable trade plans using this checklist.
a. Decide Your Trading Style
You can trade quarterly results in three ways:
Pre-Earnings Positional Trade
Based on expectation buildup
Suitable only for high-conviction setups
Post-Results Intraday Trade
Safer
Trade only after numbers are out
Post-Results Positional Trade
Based on guidance
Ideal for capturing multi-week moves
Choose one based on risk tolerance.
b. Define Entry Trigger
Triggers can include:
Breakout above resistance
Breakdown below support
High-volume candle
Reversal candle after a knee-jerk reaction
A rule-based entry prevents emotional decisions.
c. Set Stop-Loss and Target Levels
Risk management is the spine of the checklist. For results trading:
Keep wider stops due to volatility
Use position sizing to manage risk
Avoid averaging down
Use ATR-based stops for best results.
d. Avoid Trading Immediately at Results Time
The first 5–10 minutes after results are volatile and full of fake moves. Let the market:
Absorb data
Form a stable direction
Build volume confirmation
Then act.
5. Psychology and Behavior Checklist
Earnings trading requires strong emotional control.
a. Don’t Chase the First Spike
The initial price spike is often wrong. Wait for confirmation.
b. Avoid Bias
If you "like" the company, you may misread the results. Let the data dictate the trade.
c. Stick to the Plan
Do not:
Increase position size impulsively
Trade without stop-loss
Overtrade because of excitement
A structured checklist reduces psychological stress.
6. Risk Management Checklist
Earnings trading can flip sharply. Risk control is crucial.
a. Never Trade Full Capital
Limit exposure to:
2–5% of total capital for intraday
5–10% for positional
b. Use Hedging When Needed
Hedging tools:
Options (buying calls/puts)
Straddles/strangles
Futures for protection
For unpredictable companies, hedge or avoid.
c. Avoid Illiquid Stocks
Low-volume stocks widen spreads and increase slippage.
7. Post-Results Evaluation Checklist
After the trade, analyze performance to refine your strategy.
a. Review What Happened
Document:
Were expectations correct?
Did the stock reaction match your analysis?
Was your entry/exit well-timed?
b. Update Your Earnings Database
Maintain a simple log:
Company name
Estimate vs. actual results
Market reaction
Volatility levels
Over time, this builds pattern recognition.
c. Identify Mistakes
Mistakes commonly include:
Entering too early
Ignoring guidance
Trading on gut feeling
Correct them in the next cycle.
Conclusion: Why a Quarterly Results Checklist Matters
Quarterly results bring both opportunity and chaos. Without a checklist, traders rely on emotions and incomplete information, leading to inconsistent outcomes. A well-designed checklist—combining fundamentals, technicals, psychology, and risk management—creates a structured, rule-based approach. It helps identify winning trades, avoid traps, and build long-term trading consistency.
By following this 1000-word guide, you can build a reliable earnings-season trading framework that maximizes profit potential while protecting your capital.
XAUUSD – Waiting for Trend Confirmation Around the 4,160–4,170..XAUUSD – Waiting for Trend Confirmation Around the 4,160–4,170 Zone
At the moment, gold has not shown a clearly defined medium-term trend. Price is moving around an important resistance zone, so instead of predicting direction early, I prefer waiting for price reaction at key levels before taking action.
The main focus today is the 4,160–4,170 area – where the market will decide whether to continue the uptrend or start a deeper correction.
🎯 Scenario 1 – SELL at 4,162–4,165 (Priority if No Clear Breakout)
Sell: 4.162 – 4.165
SL: 4.173
TP: 4.140 – 4.122 – 4.110 – 4.100
The 4.162–4.165 zone on H1 is a strong resistance area combining Fibonacci confluence, previous supply, and proximity to the short-term rising trendline.
If price taps this zone and shows weakness (upper-wick rejection, reversal candle, low volume confirmation), I prefer taking a short-term sell toward 4.140, with deeper targets at the liquidity cluster around 4.110–4.100.
Risk for this scenario is capped at 1–2% per trade. Do NOT hold the position if price closes above 4.173.
⭐ Scenario 2 – BUY on Break Above 4,170 (Trend Continuation Confirmation)
Buy: 4.171 – 4.173 (only after a clean breakout)
SL: 4.163
TP: 4.188 – 4.200 – 4.215
If price breaks decisively above 4.170 and sustains above it, that confirms buyers are still in control.
In this case, I switch my bias to buying the breakout, targeting the next resistance zones around 4.200–4.215, and possibly higher if momentum remains strong.
Note: Only buy if the breakout is genuine — strong candle body closing above 4.170, not a stop-hunt wick that pulls back immediately.
1. Fundamental Outlook
The DXY continues slipping below 99.50, now near 99.45, showing sustained weakness as markets increase expectations for a December Fed rate cut.
Easier monetary conditions generally support gold because the opportunity cost of holding gold is reduced.
However, U.S. initial jobless claims have dropped to the lowest level since April, showing the labour market is still resilient.
This creates a mixed environment: rate-cut expectations support gold, but strong economic data may cause sudden volatility around news releases.
Overall, fundamentals lean slightly bullish for gold, but not strongly enough to ignore potential technical pullbacks.
2. Technical Structure
On the H1 chart, after a strong rally, gold is now consolidating right below the 4.160–4.170 resistance.
The 4.162–4.165 region is a confluence zone:
• horizontal resistance
• previous supply
• area where strong selling pressure appeared earlier
The 4.140 level is the “correction confirmation level” — if price breaks and closes below it, the market will likely aim for the major liquidity area around 4.110–4.100, where many Buy-side stop losses are clustered.
The current structure allows for both long and short setups, but each scenario requires clear price confirmation at the 4.160–4.170 zone.
3. Market Sentiment & Action Plan
Both buyers and sellers are watching the same price zone — 4.160–4.170.
This makes it a high-liquidity area where stops for both sides may get swept before the market shows its real direction.
If price rejects strongly from this zone, it could be a sign of late buyers being flushed out.
If buyers hold price above 4.170, trapped short positions may fuel a short squeeze toward higher resistance zones.
My plan: I do not enter mid-range. I wait for clear signals:
• Sell at 4.162–4.165 if reversal confirmation appears.
• Buy at 4.171–4.173 after a confirmed breakout and hold above the zone.
• Always use a hard stop-loss. No widening stops if price goes against the trade.
If price breaks both zones without giving clear signals, I stay out and wait for a new structure instead of forcing a prediction.
I always read feedback to improve how I share these analyses in future posts.

XAU/USD – Gold Holds Above Key Support as Pullback Stays LimitedGold remains capped below its two-week high during the Asian session, but the downside is clearly limited.
Market sentiment is shaped by:
A weaker USD as dovish Fed expectations gain traction
Rising probability of rate cuts in upcoming meetings
Improving global risk sentiment amid hopes of progress in Russia–Ukraine negotiations
Even though Gold is retracing, the bigger picture remains bullish as long as price holds above key support zones.
📊 Technical Outlook – MMF Trading Style (M30/H1)
Price is currently consolidating below the resistance cluster 4,156 – 4,170, retracing into multiple demand zones.
Key Levels to Watch
Support 1: 4,131 – 4,137
Support 2: 4,115 – 4,118
Support 3 (major liquidity): 4,083 – 4,090
Main Resistance: 4,170 – 4,193
Market structure shows a clean zigzag pullback, suggesting a potential bullish continuation once liquidity is collected below.
🎯 MMF Intraday Trading Plan
Scenario 1 – Buy the Dip (Primary Bias)
Best trade today: Buying retracements into demand.
BUY: 4,115 – 4,118
SL: 4,103
TP: 4,131 → 4,156 → 4,170
BUY (extended liquidity sweep): 4,083 – 4,090
SL: 4,070
TP: 4,118 → 4,145 → 4,170 – 4,193
Reason: Fibo confluence + strong demand + liquidity zone = high-probability reversal area.
Scenario 2 – Short-Term SELL (Scalp Only)
Only valid if price rejects strongly at resistance.
SELL: 4,156 – 4,170
SL: 4,177
TP: 4,145 → 4,131
This is not the main bias today.
⚜️ MMF Trading View
Gold is forming a healthy pullback—not, at this stage, a bearish reversal.
As long as price stays above 4,08x, the bullish structure remains intact.
“In Gold, the goal isn’t chasing the breakout — it’s waiting for price to return to value.”
Today’s focus: Prefer BUY setups on retracement – SELL only for quick scalps.


XAU/USD: Gold Bullish, Waiting for Perfect Buy Pullback📊 Market Structure
Gold is maintaining a strong bullish structure after a series of BoS from the bottom region. The most recent rally broke the 4,130 mark and continues to hold above the small OB area, indicating that the BUY side is still in control.
Currently, the price is slightly retracing to retest the structure — the target is to test the area:
• OB 4,130 – 4,126 USD
• Or deeper to FVG 4,104 – 4,089 USD
In both cases, these are discount areas to continue BUYING according to the main trend.
The larger trend still targets the upper liquidity levels including:
• 4,151
• 4,181
• 4,207
• 4,243
💎 Key Technical Zones
• OB Retest Zone: 4,130 – 4,126 (quick bounce area)
• FVG Zone: 4,104 – 4,089 (best discount area to BUY)
• Large Bearish OB: 4,045 – 4,060 (final area if price adjusts deeply)
• Target Zones: 4,151 – 4,181 – 4,207 – 4,243
🎯 Trading Plan – BUY (priority)
1️⃣ BUY 1 – Retest OB 4,130
• Entry: 4,126 – 4,131
• SL: below 4,115
• TP1: 4,151
• TP2: 4,181
• TP3: 4,207
• TP4: 4,243
→ This is a quick setup – for a short retracement before continuing.
2️⃣ BUY 2 – FVG 4,104 – 4,089 (best)
• Entry: 4,089 – 4,104
• SL: 4,070
• TP1: 4,151
• TP2: 4,181
• TP3: 4,207
• TP4: 4,243
→ This FVG area is a strong confluence: fibo, small demand, and trendline.
3️⃣ BUY 3 – OB Bearish shift (deep entry)
• Entry: 4,045 – 4,060
• SL: 4,020
• TP1: 4,104
• TP2: 4,151
• TP3: 4,207
→ Only activate when the market shakes strongly, but RR is extremely good.
🎯 SELL Scalp (secondary – only short trades)
Only SELL when the price reaches strong resistance areas and rejection signals appear:
• 4,151
• 4,181
• 4,207
• 4,243
Entry SELL: only enter when there is H1 rejection
SL: 10–15 USD
TP: back to 4,151 → 4,130
→ This is counter-trend, not a priority setup.
🧠 Vincent’s View
The overall trend is still bullish. The current retracements are just a “breathing phase” – the market is accumulating energy to continue pushing up to higher liquidity areas.
As long as the price stays above 4,089 – the bullish trend is not threatened.
“Smart Money buys the dip — Retail buys the breakout.” ⚜️
⏰ Timeframe: 1H
✍️ Analysis by: Captain Vincent

XAU/USD – Gold Under Heavy Pressure, 4,000$ Break Looks ImminentGold continues to slide as the US Dollar strengthens, fueled by resilient US data. With markets waiting for the final week of November and the upcoming FOMC decision, safe-haven flows remain weak—making XAU/USD extremely vulnerable to further downside.
📊 Technical Outlook – H1/H30
The short-term structure remains clearly bearish:
1️⃣ Trend Bias: Bearish
Price keeps rejecting the descending trendline.
Every pullback is shallow and absorbed quickly by intraday supply zones.
2️⃣ Key Technical Levels
Resistance / Supply Zones:
4,078 – 4,089
4,104 (major confluence: Fibo + H1 supply)
Support / Liquidity Targets:
4,023 – 4,013
3,989 – 3,975 → major liquidity zone (high reaction probability)
3️⃣ Scenarios to Watch
🔻 Scenario 1 — Continuation Drop (Primary Bias)
Break below 4,044 → targets 4,023, then the liquidity sweep at 3,99x – 3,97x.
🔄 Scenario 2 — Pullback Before Drop
Retracement to 4,054 – 4,078 → rejection → continuation lower.
🔺 Scenario 3 — Deeper Recovery (Low Probability)
Only valid if price closes above 4,104, unlocking a move toward 4,13x – 4,15x.
🎯 MMF Trading Plan
SELL – Trend-Following (Primary)
Sell Zone 1: 4,054 – 4,078
SL: 4,105
TP: 4,023 → 4,013 → 3,99x
Sell Zone 2: 4,089 – 4,104
SL: 4,112
TP: 4,054 → 4,023
BUY – Only as a Reaction Trade (Liquidity Sweep)
Buy Zone: 3,99x – 3,97x
SL: 3,955
TP: 4,023 → 4,054
⚠️ Buy setups are counter-trend and require strong confirmation.
Primary bias remains SELL as long as price stays below 4,104.
⚜️ MMFLOW TRADING View
Gold is being pushed toward the psychological 4,000$ support.
A clean break could trigger a broader bearish expansion into 3,98x – 3,95x.
With month-end positioning, FOMC expectations, and shifting Fed sentiment, volatility is likely to increase sharply.
Stay with the trend—SELL the rallies. BUY only at deep liquidity zones with confirmation.

Gold Stuck Between 4050-4100. Now What?Gold price is currently trading in classic range-bound behavior on the daily timeframe, with price action consolidating between the 4050-4100 area (On closing basis ) as marked by the rectangle on the chart.
Based on the current technical setup, I'm anticipating continued consolidation for approximately 6-7 weeks from this point. However, this isn't likely to be a simple sideways move the consolidation is expected to carry a bearish undertone, meaning we may see more pressure toward the lower end of the range during this period.
after mid-January, conditions appear favorable for a fresh buying rally to develop. This consolidation phase may simply be the market gathering momentum for the next leg higher, allowing for profit-taking and position adjustments before the next bullish impulse.
While range trading can be tempting during consolidation phases,., buying on dips remains the more favorable approach.
