XAUUSD SUPPORT, RESISTANCE & TRENDLINE ANALYSISHello guyz hope uall r doing well. I am on a travelling spree so I.apologize for not providing consistent updates.
However, my levels shall remain the same and you'll can trade within the levels confidently.
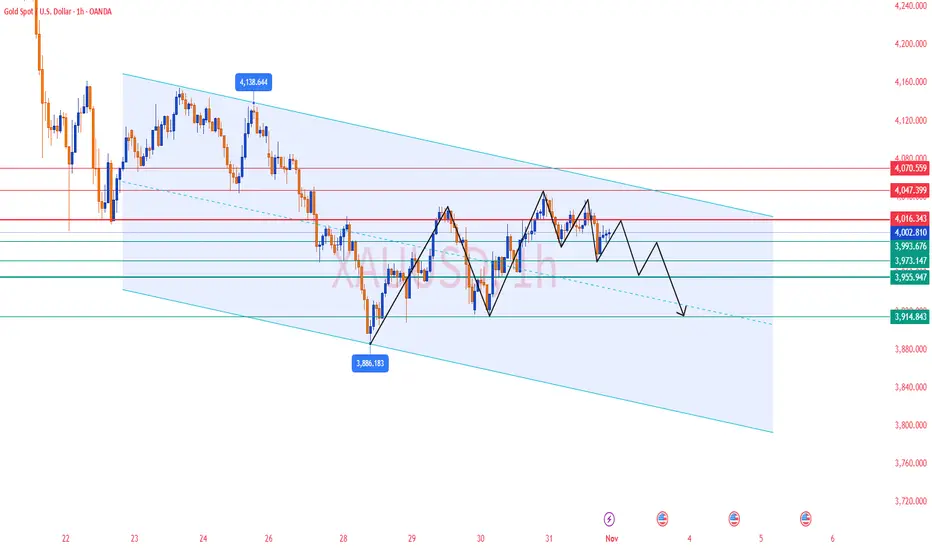
Go for LONG only if it stays below 3980. If it breaks 3980 then you can plan for SHORT positions with a max target of 3929.
Trade ideas

Part 1 Ride The Big Moves Option Expiry and Settlement
Every option has an expiry date. In India:
Index options (like Nifty and Bank Nifty) are cash-settled.
Stock options are physically settled, meaning actual delivery of shares can occur if positions are held until expiry.
As the expiry date approaches, time decay (Theta) reduces the option’s value if the underlying doesn’t move in the trader’s favor.

Part 2 Intraday Tradiing Master ClassHow Option Pricing Works
Option prices (premiums) are influenced by several factors. The most important are:
Underlying Price: The current price of the stock/index.
Strike Price: The difference between the current price and strike determines moneyness.
Time to Expiry: The more time left, the higher the premium (time value).
Volatility: Higher volatility increases the premium since there’s a greater chance of price movement.
Interest Rates & Dividends: These also affect option pricing slightly.
A famous model called the Black-Scholes Model is commonly used to calculate theoretical option prices based on these factors.

Gold (XAUUSD) – Bears Eye the 4045 Wall! Short Setup AheadGold is currently trading within a tight range of 3980 – 4045, and price action is now approaching the crucial resistance zone at 4035 – 4045.
📈 This area has acted as a strong supply zone in recent sessions — and could once again attract sellers.
💡 Trading Plan:
🔸 Sell Zone: 4035 – 4045
🎯 Targets: 4021 and 4012
🛑 Invalidation: View remains valid below 4051.5 — a sustained break above this level would negate the short setup and could open the door for further upside momentum.
📊 Bias: Bearish near resistance until confirmed breakout above 4051.5
💬 Watch for rejection signals or bearish candles in this zone before entering.
⚠️ Disclaimer
This is for educational purposes only — not financial advice. Always manage your risk and use proper position sizing.
Your feedback drives our content and keeps everyone trading smarter. Let’s make those pips together! 🚀
Happy Trading,
– The InvestPro Team

LiamTrading - $XAUUSD$: Second Scenario – BUY UP Priority ...LiamTrading - OANDA:XAUUSD $: Second Scenario – BUY UP Priority After BREAKING RESISTANCE $4002$
With the Support of the US Treasury Secretary
Hello traders community, LiamTrading is back with detailed OANDA:XAUUSD $ analysis for the start of the week!
The Gold market is receiving strong support from policy: US Treasury Secretary Scott Bessent calls on the Fed to continue cutting interest rates as the PCE inflation is currently at $2.7\%$.
This call, aimed at reducing mortgage rates and supporting the housing market, strengthens the long-term outlook for Gold.
Technical Analysis: We prioritize continuing to buy up following the main trend. The best strategy is to enter orders at strong resistance/support zones to ensure the lowest risk.
📰 MACRO FUNDAMENTALS: CALL FOR RATE CUT
Impact: The Treasury Secretary's statement on cutting interest rates to support the "transitioning" economy increases expectations of policy easing, which is a strong support factor for Gold (although not yet an official decision).
Suitable Strategy: Market sentiment is being driven by expectations of easing policy, reinforcing the priority for a BUY (Long) position.
📊 TECHNICAL ANALYSIS: IMPORTANT PIVOT POINT
Resistance Zone $4002$: This area acts as an important pivot point.
Buy Entry will be triggered after the price breaks resistance $4002$ and retests.
Sell Entry: Look for short-term scalping at the resistance zone $4030$ to secure profits. Highlighted Zone: Prioritize entering orders at confirmed Trendline zones.
🎯 DETAILED TRADING PLAN (ACTION PLAN)
We will wait for Gold to break structure and create a BUY setup.
🟢 Main BUY Scenario (BUY Break & Retest)
Logic: Buy at $4002$ after breaking resistance and retesting, leveraging new upward momentum.
Entry (BUY): $4002$
SL: $3995$ (tight SL)
TP1/TP2: $4020$ | $4035$
TP3: $4070$
🔴 SELL Scalping Scenario
Logic: Short-term scalping at the strong resistance zone $4030$ (near Sell Liquidity zone).
Entry (SELL): $4030$
SL: $4038$
TP1/TP2: $4015$ | $4004$
TP3: $3990$
📌 SUMMARY & DISCIPLINE (Liam's Note)
Our BUY strategy is reinforced by policy outlook and technical break at $4002$. Strictly adhere to SL $3995$ to manage risk before the upward structure is confirmed.
Are you ready for Gold's movement at $4002$? Please LIKE and COMMENT!

Elliott Wave Analysis – XAUUSD | November 3, 2025
🔹 Momentum
D1 Timeframe:
Daily momentum is currently rising and approaching the overbought zone.
At the current pace, it is expected that within 2–3 more D1 candles, momentum will reach the overbought area — increasing the risk of a potential reversal.
However, in the short term, the bullish trend still dominates.
H4 Timeframe:
H4 momentum is reversing upward, and if a strong bullish candle breaks above the 4028 resistance level, it will confirm a bullish reversal, potentially leading to a 5-candle H4 uptrend within today’s session.
H1 Timeframe:
H1 momentum is preparing to turn downward, suggesting a short-term pullback may occur before the next upside continuation aligned with the broader H4 trend.
________________________________________
🔹 Wave Structure
D1 Timeframe:
Current data still supports the scenario that the market is forming Wave (4) in yellow.
However, more time is needed for a clear confirmation.
If D1 momentum enters the overbought zone without price creating a new high, that would give us additional confirmation of this wave count.
In the short term, price may continue rising for another 2 days.
H4 Timeframe:
The scenario of Wave (4) in purple within Wave (3) in yellow remains valid and has not been invalidated.
If price breaks above the 4379 high, it would confirm the formation of Wave (5) in purple, signaling the start of a strong bullish move.
At present, price movement remains choppy and overlapping, showing no clear trend direction — hence, we need to monitor price action closely.
With H4 momentum turning upward and resistance around 4028 forming a symmetrical triangle pattern, I expect a bullish move of 4–5 H4 candles today.
A decisive breakout above 4028 would further reinforce this bullish scenario.
H1 Timeframe:
The current H1 structure may be forming either:
• Wave X within the larger D1 structure, or
• Wave (5) in purple within the H4 structure.
In either case, we can expect a short-term upward move in line with H4 momentum.
Currently, price is hovering around the 4017 resistance zone, while H1 momentum is preparing to turn downward — therefore, a short-term correction toward the 3953 liquidity zone is expected.
This area will serve as a potential buy zone.
________________________________________
🎯 Trading Plan
• Buy Zone: 3954 – 3952
• Stop Loss: 3944
• Take Profit 1: 4050

Gold expected to Crash to levels on 3200$ from 4000$evaluating Monthly gold chart, my calculation says atleast a 1000$ drop from current levels of 4000$. This is purely based on Technical indicator hence dont just take your buying or selling decision basis this post... do your research yourself ..

XAUUSDGold is approaching supply zone. If we see a rejection from top. It can fall down to the below liquidity as shown.

LiamTrading - $XAUUSD$: NEW WEEK TRADING SCENARIO...LiamTrading - OANDA:XAUUSD $: NEW WEEK TRADING SCENARIO – PRIORITISE SELLING After BREAKING THE TRENDLINE
Hello traders community,
The new week opens with a clear strategy: Prioritise SELLING after Gold has broken the previous upward trendline.
Although fundamental economic news (like interest rate policies and politics) supports Gold potentially reaching the $5,000$ USD mark, we must trade according to the current Price Action. The technical selling pressure is strong. We will SELL at key resistance zones and continue SELLING as the price breaks the downward structure.
📰 FUNDAMENTALS & LONG-TERM OUTLOOK
$5,000$ Prospect: Fundamental and political factors continue to support the scenario of Gold reaching $5,000$ USD in the long term (due to geopolitical risks and potential loss of Fed independence).
Short Term 🔴: Gold is under technical selling pressure after breaking through the $4,000$ USD mark.
📊 TECHNICAL ANALYSIS: TRENDLINE BREAK
Structure: Gold has exited the upward price channel and is retesting the broken trendline.
Priority: SELL at the retest resistance zone $4024$.
🎯 DETAILED TRADING PLAN (ACTION PLAN)
🔴 SELL Scenario (SELL Primary) - Preemptive Resistance
Entry 1: $4024$ (Sell retest trendline zone)
SL: $4032$
TP1/TP2: $4012$ | $4000$
TP3: $3989$
Entry 2 (Continuation SELL): When price breaks the next trendline at $3992$
SL: $4000$
TP: $3940$
🟢 BUY Scenario (BUY Reversal) - Buy at Strong Support
Logic: Only buy when price hits strong liquidity support, potential for a short-term rebound.
Entry (BUY): Around $3960$ (Buy Scalping Zone)
SL: $3954$
TP1/TP2: $3972$ | $3988 FWB:TP3 : $4000$
📌 SUMMARY & DISCIPLINE (Liam's Note) Don't let the $5,000$ USD prospect affect short-term risk management. Trade according to Price Action. Adhere to SL and prioritise SELL positions at resistance zones.
Are you ready for the SELL strategy at the start of this week?

Gold Trading Strategy for 03rd November 2025🏆 GOLD INTRADAY TRADE PLAN 💰 (03 NOV 2025)
📊 Market Overview:
Gold is currently trading within a crucial intraday range. A strong breakout on either side of this zone may provide directional opportunities. Traders should observe the price action and candle closes before entering trades. Always confirm momentum with volume and candle strength.
📈 🟢 BUY SETUP:
📍 Entry Trigger:
→ Buy only if the 30-Min candle closes above $4023 — this confirms bullish strength and potential breakout continuation.
🎯 Upside Targets:
🎯 Target 1: $4035 – First resistance zone; partial booking recommended.
🎯 Target 2: $4050 – Momentum continuation level.
🎯 Target 3: $4065 – Extended intraday target.
🛡️ Stop Loss: Below $4010 (Keep risk-to-reward ratio around 1:2 minimum).
💡 Tip: Wait for a clear bullish candle with volume confirmation before entering. Avoid early entries on spikes.
📉 🔴 SELL SETUP:
📍 Entry Trigger:
→ Sell only if the 15-Min candle closes below $3967 — this indicates weakness and potential bearish breakdown.
🎯 Downside Targets:
🎯 Target 1: $3950 – Immediate support zone.
🎯 Target 2: $3938 – Continuation support.
🎯 Target 3: $3921 – Extended downside target.
🛡️ Stop Loss: Above $3980 (Maintain strict discipline).
💡 Tip: Ensure there’s a confirmed breakdown candle and not a false wick rejection. Avoid trading in a sideways range.
⚠️ DISCLAIMER:
📢 This content is for educational and informational purposes only and should not be considered financial advice. Trading involves substantial risk and is not suitable for all investors. Always use stop loss, manage your capital wisely, and consult with a certified financial advisor before making investment decisions.
✨ Summary:
✅ Wait for candle close confirmations before entry.
✅ Avoid over-leveraging and trade with discipline.
✅ Follow trend strength and volume confirmation.
✅ Keep emotions out — follow your trading plan strictly.
💵 Trade Smart | Manage Risk | Stay Consistent 💵

GOLD SHORT SWING IDEA📊 Weekly Gold Trade Plan (XAUUSD)
Gold is currently in a liquidity-seeking phase after last week’s correction.
Here’s the plan for the coming week 👇
🧠 Institutional Outlook:
If gold opens with a gap-up and shows rejection from our marked supply zone (4050–4070) — that will confirm the presence of institutional selling pressure.
🎯 Swing Trade Setup:
Entry:4040
Stop Loss: 4060
Targets: 4000 / 3980 / 3950 / 3920
Bias:Short (Distribution phase / Liquidity grab scenario)
Trade Type:Swing
⚡ Scalping Plan:
We’ll observe live price behavior at market open.
If gold reacts with volatility or sweeps key liquidity near our zone, we’ll plan short-term scalp setups accordingly.
🧩 Key Note:
No early entries — we’ll wait for confirmation of rejection or displacement before executing.
Our focus this week is discipline + precision not prediction.
Stay sharp. Institutions are hunting liquidity — let’s trade with them, not against them. 💼

Gold Trading Strategy Reference for Next Week✅ Last Friday’s gold price movement once again validated the previous analysis. Gold faced strong resistance around 4047–4055 and found support at 3965–3970, remaining range-bound throughout the session and closing near 4003. If no significant news impacts the market at next week’s opening, the price is likely to continue consolidating within this range.
✅ On the weekly timeframe, gold has closed bearish for two consecutive weeks and is currently trading below the 5-week moving average. The 5-week MA has started to turn downward, indicating short-term bearish pressure. However, from a broader perspective, the price remains within a long-term ascending channel. The key structural support lies around 3900; as long as this level holds, the long-term bullish outlook is still intact.
✅ On the daily timeframe, gold is trading below multiple moving averages, forming a clear bearish alignment. The 5-day and 10-day moving averages continue to press downward, limiting short-term rebounds. The Bollinger Bands are opening to the downside, with price trading between the mid and lower bands and approaching lower-band support, reflecting short-term weakness. October’s daily candle closed as a shooting star with a long upper wick, which is unfavorable to the bulls. Based on price structure and candlestick formation, the probability of further downside in November is relatively high.
The 4010–4020 zone has shifted from support to key resistance; if gold fails to break above this region on Monday, further downside pressure is expected. Conversely, a successful breakout would invalidate the 4030–4040 resistance zone and may trigger a short-term bullish extension.
🔴 Resistance Levels: 4010–4023 / 4030–4040
🟢 Support Levels: 3965–3970 / 3915–3885
✅ Trading Strategy Reference:
🔰 If gold rebounds to the 4010–4020 zone and shows rejection, consider short positions targeting 3965–3970.
🔰 If gold pulls back to the 3950-3955 zone and stabilizes, consider long positions targeting 3980-4000.
✅ Overall, gold remains bearish on short-term cycles while the long-term structure is still intact. Technical signals, moving averages, and fundamental sentiment all point toward further downside. Throughout November, the primary focus should be on selling the rallies. As long as the key long-term support remains unbroken, the broader bullish trend still has the potential to continue.
gold bullish setup and ath recoveryhaving found support and also bouncing off of golden zone and 200 sma on 4 hour time frame, gold is set to test for ath again.

GOLD: US Fed is Not Giving Up! Big Selling Zone is Activated.Hello, Traders! It's a crucial time, yaar! Gold is at a major crossroads. The pressure from the US Fed is real, and it’s lining up perfectly with our key price levels. Let’s do a quick scan of the market.
I. FUNDAMENTALS: The Big Boss (The Fed) is Hawkish 📰
Main Reason for Bears: The US Fed officials are not interested in rate cuts for now. They are very much "hawkish" due to inflation concerns. This has crushed market optimism.
The Direct Impact: Higher US interest rates mean the Dollar is strong and mighty. For a non-yielding asset like Gold, this is a major negative signal.
Long-Term View (The Hope): Don't lose heart completely! Big institutions still see Gold climbing (like Morgan Stanley projecting $4,300/oz by 2026). So, current dips are good for long-term accumulation.
II. TECHNICAL ANALYSIS: The Supply-Demand Game 🎯
The H4 chart is showing a confirmed DOWNTREND. The recent small rally is just a necessary pullback to test the sellers' power before the next big drop.
1. Primary Strategy: GO SHORT (Following the Main Trend)
The Hot Selling Zone: $4,059 to $4,085. This is our Supply Area where the institutional players are likely waiting. This level is key.
Action Plan: Wait for Gold to enter $4,059 - $4,085. Look for a solid rejection (a strong reversal candle) to confirm your SHORT entry.
Final Target (TP): Our main target is the Strong Demand Zone at $3,939 - $3,952.
2. Counter-Trend Strategy: The Bounce Level
Crucial Buying Zone: $3,939 - $3,952. This is a major support level.
Action Plan: If the price really drops here, you can watch for a quick long entry for a bounce, but maintain tight stop-loss.
🔑 Final Verdict
Best Bet: We must look for a SELL near the $4,059 - $4,085 Supply Zone. Everything is lining up for a continued downside move. Risk management is paramount, okay?
What's your plan for Gold? Will the market respect the $4,085 level? Tell me in the comments! 👇
#XAUUSD #GOLD #FED #TechnicalAnalysis #ForexTrading #SupplyAndDemand #Bearish #TradingStrategy #IndianTrader #MarketAnalysis

technical analysis for your chart on Gold (XAU/USDCurrent Price: $4,002
Trend Structure: The pair is showing a potential reversal setup after a completed downward channel.
Recent Pattern: Price has broken slightly above the descending channel and is now retesting the breakout zone around the support level ($3,950–$3,980).
🔹 Key Technical Levels
Support Zone: $3,940 – $3,980
→ Strong accumulation area shown by multiple rejections and previous demand.
Immediate Resistance: $4,080 – $4,120
→ Minor resistance expected as the first hurdle after breakout.
Major Resistance (Target): $4,385
→ Marked as the final bullish target on the chart.
📈 Bullish Scenario
If price sustains above $4,000, we can expect:
A short-term retest of $4,080–$4,120.
Once momentum confirms above $4,120, bullish continuation toward $4,200 → $4,385 (main target).
✅ Buy Confirmation:
Break and close above $4,050 with volume.
Retest of $4,000 zone followed by bullish rejection candle.
🎯 Bullish Targets:
TP1: $4,080
TP2: $4,200
TP3: $4,385
📉 Bearish Scenario
If price rejects $4,000 and closes below the support zone ($3,950):
Downside may resume toward $3,880 – $3,820 range.
That would invalidate the bullish breakout and confirm channel continuation.
🚫 Sell Trigger:
3H close below $3,940.
🎯 Bearish Targets:
TP1: $3,880
TP2: $3,820
📊 Conclusion
Structure is shifting from bearish to bullish after a channel breakout.
The $3,950–$4,000 area is key — a stronghold for bulls.
Expect a bullish rally if support holds, targeting $4,385 in the medium term. NSE:NIFTY1! NSEIX:NIFTY1! MCX:GOLD1! MCX:CRUDEOIL1! MCX:NATURALGAS1! MCX:SILVER1! NSE:BANKNIFTY1! CME_MINI:NQ1! MCX:GOLDM1! COMEX:GC1! MCX:SILVERM1! MCX:GOLDPETAL1!

XAUUSD/GOLD 4H WEEKLY BUY PROJECTION 02.11.25XAUUSD (Gold) 4H Weekly Buy Projection for 02.11.25.
Here’s a breakdown of what your chart indicates:
🧭 Technical Overview:
Pattern Forming: Symmetrical Triangle inside a larger Parallel Downtrend Channel.
Key Confirmation: “W” pattern confirmation with 0.618 Fibonacci retracement zone, indicating strong potential reversal.
Current Price Zone: Around 4002, consolidating near triangle resistance.
🔍 Key Levels:
Support S1: ~3960
Support S2: ~3920
Resistance R1: ~4040
Resistance R2: ~4080
Resistance R3: ~4160
📈 Projection Summary:
If Price Breaks Triangle Upward:
→ Strong bullish momentum expected toward R1–R3 zones.
→ “Huge buy expected” once breakout candle closes above the upper trendline with volume.
Invalidation:
→ If price breaks below 3960, the bullish setup weakens.
→ Below 3920, trend may retest the lower parallel channel zone.
💡 Trading Plan (Based on Chart Logic):
Buy Entry: Above 4040 confirmation breakout
Target 1: 4080
Target 2: 4160

Global Cues & GIFT Nifty TradingIntroduction
In today’s interconnected financial ecosystem, no market operates in isolation. Global economic events, central bank policies, geopolitical tensions, and market trends from the U.S., Europe, and Asia all influence trading sentiment in India. This interconnectedness is what we call “global cues.” Traders closely watch these cues to anticipate how the GIFT Nifty (formerly SGX Nifty) and the Indian stock markets might open or behave during the trading day.
GIFT Nifty serves as a key pre-market indicator for the Indian equity market, offering traders a glimpse into potential market direction even before the domestic markets open. Let’s explore how global cues interact with GIFT Nifty trading and shape the overall sentiment in India’s financial markets.
What Are Global Cues?
Global cues refer to signals or influences originating from international markets that impact domestic trading behavior. These cues include movements in:
Major Global Indices like the Dow Jones, S&P 500, NASDAQ, FTSE 100, Nikkei 225, Hang Seng, and DAX.
Commodity Prices, such as crude oil, gold, and base metals.
Currency Movements, particularly USD/INR, EUR/USD, and other major pairs.
Bond Yields and global interest rates.
Macroeconomic Data, including inflation, GDP growth, and employment figures from key economies.
Geopolitical Events, such as wars, sanctions, trade agreements, or political instability.
These global indicators collectively affect investor confidence, risk appetite, and capital flows — which ultimately influence Indian markets and the GIFT Nifty.
Understanding GIFT Nifty
GIFT Nifty, officially known as GIFT Nifty 50 Futures, is traded on the NSE International Exchange (NSE IX), located in the GIFT City (Gujarat International Finance Tec-City) in India. It replaced the SGX Nifty (Singapore Exchange Nifty), which was previously traded in Singapore until 2023.
The transition to GIFT Nifty marked India’s effort to bring offshore Nifty trading back within its borders, giving Indian regulators more control and transparency over derivatives linked to Indian markets.
Key features of GIFT Nifty:
Traded almost 21 hours a day, bridging Asian, European, and U.S. time zones.
Denominated in U.S. dollars, attracting foreign institutional participation.
Tracks the performance of the Nifty 50 index, India’s leading stock market benchmark.
Serves as a pre-market indicator for the direction of the Indian equity market.
Because GIFT Nifty trades while Indian markets are closed, its price movement gives traders an idea of how the Indian stock market may open the next morning.
The Role of Global Cues in GIFT Nifty Movements
GIFT Nifty is highly sensitive to global cues due to its extended trading hours overlapping with international markets. Here’s how global factors typically influence its performance:
1. U.S. Market Performance
The U.S. markets, especially indices like Dow Jones, S&P 500, and NASDAQ, play a dominant role in setting global risk sentiment. A strong rally on Wall Street often leads to bullish sentiment in Asian markets and GIFT Nifty, whereas a sharp decline usually results in bearish trends.
For instance, if the NASDAQ closes higher due to strong tech earnings, GIFT Nifty futures may rise overnight, hinting at a positive start for Indian markets.
2. Asian Market Trends
Since GIFT Nifty overlaps with Asian trading hours, performance in indices like Nikkei 225 (Japan), Hang Seng (Hong Kong), and Shanghai Composite (China) can significantly impact it. Weak Chinese data or yen fluctuations can trigger risk aversion across Asian equities, pulling down GIFT Nifty as well.
3. Crude Oil Prices
India is a major importer of crude oil. Rising oil prices increase India’s import bill, widen the current account deficit, and can fuel inflation—all negatives for the Indian economy. As a result, higher oil prices often pressure GIFT Nifty and the Indian rupee. Conversely, a sharp fall in oil prices tends to boost GIFT Nifty sentiment.
4. Currency Movements (USD/INR)
A weakening Indian rupee against the U.S. dollar usually signals foreign outflows and inflationary pressure, which dampen investor sentiment. GIFT Nifty tends to fall in such scenarios. On the other hand, a strengthening rupee supports positive sentiment and may lift GIFT Nifty.
5. U.S. Federal Reserve and Global Interest Rates
The Federal Reserve’s monetary policy decisions are closely tracked worldwide. Any hint of rate hikes or hawkish tone increases global risk aversion, leading to sell-offs in equities and a drop in GIFT Nifty. Conversely, dovish policies (rate cuts or liquidity support) boost risk-taking and lift markets globally.
6. Geopolitical Developments
Geopolitical events such as wars, trade conflicts, or sanctions can cause market volatility. For example, the Russia-Ukraine war initially led to a spike in oil prices and a global risk-off sentiment, dragging GIFT Nifty lower. Similarly, easing geopolitical tensions can trigger recovery rallies.
How Traders Use Global Cues in GIFT Nifty Trading
GIFT Nifty traders often analyze global cues to predict short-term price action and hedge positions in Indian equities. Some common strategies include:
Pre-Market Direction Prediction:
Traders track U.S. and European market closings to gauge where GIFT Nifty may open. This helps in planning trades for the Indian session.
Arbitrage Opportunities:
Since GIFT Nifty trades almost round-the-clock, traders exploit price differences between GIFT Nifty and NSE Nifty futures when domestic markets open.
Hedging FII Exposure:
Foreign institutional investors (FIIs) use GIFT Nifty to hedge their positions in Indian equities based on global risk factors.
Event-Based Trading:
Key global events like U.S. CPI data, Federal Reserve meetings, or OPEC announcements can trigger quick GIFT Nifty reactions. Traders position themselves accordingly before these announcements.
Example: How Global Cues Drive GIFT Nifty
Imagine this scenario:
The Dow Jones surges by 2% overnight on strong U.S. GDP data.
Brent crude drops below $80/barrel, easing inflation fears.
Asian markets open positive.
Result: GIFT Nifty futures jump 100–150 points, signaling a bullish opening for Indian markets the next morning.
In contrast, if:
U.S. bond yields rise sharply,
Crude oil climbs to $95/barrel, and
China reports weak factory data,
GIFT Nifty might fall 150–200 points, reflecting bearish sentiment before the Indian market opens.
Impact of Global Cues on Domestic Market Opening
Because GIFT Nifty trades overnight, it directly influences pre-market sentiment in India. News anchors and analysts frequently refer to “GIFT Nifty indicates a positive/negative start for the Indian markets.”
For example:
If GIFT Nifty is trading 100 points higher, it indicates a likely gap-up opening for Nifty 50.
If it’s 150 points lower, a gap-down opening can be expected.
This helps traders, especially intraday and short-term players, plan their strategies before the NSE opens.
The Future of GIFT Nifty and Global Integration
GIFT Nifty has strengthened India’s position in the global financial ecosystem. With extended trading hours and growing foreign participation, it acts as a bridge between Indian and international investors. As more global funds use GIFT Nifty for exposure to Indian markets, liquidity and volume are expected to rise.
Additionally, the establishment of GIFT City as a global financial hub aligns with India’s vision of becoming a major player in international finance. Over time, more derivative products linked to Indian indices and sectors may be introduced in GIFT City, further deepening market integration.
Conclusion
Global cues and GIFT Nifty trading are tightly interlinked, forming a vital part of India’s financial market ecosystem. Global economic data, geopolitical developments, commodity prices, and central bank policies directly impact GIFT Nifty’s movement — which, in turn, serves as a real-time barometer for the next day’s market sentiment in India.
For traders, understanding these relationships is essential. Those who effectively analyze global cues can make informed trading decisions, manage risk better, and anticipate market direction with greater accuracy. In essence, GIFT Nifty is not just a derivative product — it is India’s window to the world of global finance.

Fundamental Analysis and Technical Analysis for Traders1. Introduction to Market Analysis
Market analysis helps traders evaluate the future price movements of assets like stocks, commodities, or currencies. The goal is to determine whether to buy, sell, or hold a security.
Fundamental Analysis focuses on intrinsic value — the “true worth” of a company or asset based on its financial and economic data.
Technical Analysis focuses on market behavior — analyzing charts, price movements, and patterns to predict future trends.
Both methods are valuable, and many professional traders use a blend of the two to confirm their strategies.
2. Understanding Fundamental Analysis
Fundamental Analysis is based on the belief that every asset has an intrinsic value determined by underlying financial and economic factors. If the market price is below this value, the asset is considered undervalued (a buy signal). If it’s above, it’s overvalued (a sell signal).
a. Purpose of Fundamental Analysis
The main goal is to determine whether a security is trading at a fair price. It answers the question: “Is this asset worth investing in for the long term?”
b. Key Components of Fundamental Analysis
Economic Analysis
Traders study macroeconomic indicators such as GDP growth, inflation, interest rates, employment levels, and fiscal policies. For example, lower interest rates often encourage borrowing and investment, boosting corporate earnings and stock prices.
Industry Analysis
Each company operates within an industry that affects its performance. Analysts evaluate industry trends, competition, growth potential, and regulatory environment. For example, the renewable energy sector may have strong prospects due to global sustainability trends.
Company Analysis
This involves studying a company’s financial health, management efficiency, and competitive position. Key financial statements used include:
Income Statement – reveals profitability.
Balance Sheet – shows assets, liabilities, and equity.
Cash Flow Statement – measures cash generation and spending.
c. Key Ratios Used in Fundamental Analysis
Price-to-Earnings (P/E) Ratio: Compares a company’s current price to its earnings per share.
Earnings Per Share (EPS): Measures profit allocated to each share.
Price-to-Book (P/B) Ratio: Compares market value to book value.
Debt-to-Equity Ratio: Indicates financial leverage and risk.
Return on Equity (ROE): Measures profitability relative to shareholder equity.
By combining these indicators, traders estimate whether the stock’s current price reflects its actual performance and growth potential.
3. Understanding Technical Analysis
Technical Analysis focuses on studying price action and market psychology through charts and indicators. The key belief is that “price discounts everything” — meaning all fundamental factors are already reflected in the market price.
a. Purpose of Technical Analysis
TA helps traders identify trends, entry and exit points, and potential reversals. It answers the question: “When should I buy or sell?”
b. Core Principles of Technical Analysis
Price Discounts Everything:
All news, earnings, and expectations are already factored into the price.
Prices Move in Trends:
Markets tend to move in identifiable trends — upward (bullish), downward (bearish), or sideways (consolidation).
History Repeats Itself:
Market behavior is influenced by human psychology, and price patterns often repeat over time.
c. Tools and Techniques in Technical Analysis
Charts and Patterns
Line Charts: Simplest form, showing closing prices.
Bar Charts: Show open, high, low, and close (OHLC).
Candlestick Charts: Visual representation of price action using candles.
Common patterns include:
Head and Shoulders: Indicates a reversal trend.
Triangles: Signal continuation or breakout.
Double Top/Bottom: Suggest trend reversal.
Indicators and Oscillators
Moving Averages (MA): Smooth out price data to identify trends.
Relative Strength Index (RSI): Measures overbought or oversold conditions.
MACD (Moving Average Convergence Divergence): Detects momentum and trend reversals.
Bollinger Bands: Measure market volatility.
Volume Profile: Shows traded volumes at different price levels, identifying strong support and resistance zones.
Support and Resistance Levels
Support is where the price tends to stop falling; resistance is where it tends to stop rising. These levels guide traders in planning entries and exits.
4. Comparison Between Fundamental and Technical Analysis
Aspect Fundamental Analysis Technical Analysis
Objective Determines intrinsic value Identifies price trends
Approach Based on financial & economic data Based on charts & indicators
Time Horizon Long-term Short-term to medium-term
Data Used Earnings, assets, economic growth Price, volume, patterns
Focus “Why” the price moves “When” the price moves
Best for Investors Traders
Drawback Slow to react to market moves Can ignore fundamentals
Both methods complement each other. For example, a trader might use fundamental analysis to choose a strong stock and technical analysis to time the entry and exit.
5. How Traders Combine Both Approaches
Many professional traders use a hybrid approach, combining the best of both worlds:
Step 1: Use Fundamental Analysis to select fundamentally strong stocks or currencies with good long-term prospects.
Step 2: Apply Technical Analysis to find the right time to enter or exit trades.
For example, if a company reports rising profits and strong guidance (fundamental strength), but the stock price is currently in a consolidation phase, a trader may wait for a breakout above resistance (technical signal) before buying.
6. Advantages and Limitations
a. Fundamental Analysis
Advantages:
Ideal for long-term investors.
Helps identify undervalued or overvalued assets.
Focuses on financial strength and future potential.
Limitations:
Not effective for short-term trading.
Market prices can remain irrational despite strong fundamentals.
Time-consuming data collection.
b. Technical Analysis
Advantages:
Useful for short-term trading decisions.
Provides clear entry and exit signals.
Reflects real-time market sentiment.
Limitations:
Can give false signals in volatile markets.
Ignores fundamental value.
Requires discipline and experience to interpret correctly.
7. Practical Example
Imagine two traders analyzing Infosys Ltd.
Trader A (Fundamental Analyst): Examines the company’s quarterly earnings, strong IT sector growth, and healthy balance sheet. He believes the stock is undervalued and buys it for the long term.
Trader B (Technical Analyst): Studies price charts, notes a bullish crossover in the MACD, and buys for a short-term rally.
Both traders are profitable but have different objectives and strategies. This shows how FA and TA can coexist effectively.
8. Conclusion
Fundamental and Technical Analysis are two powerful yet distinct methods for understanding market movements.
Fundamental Analysis helps you understand what to buy by identifying assets with strong financial potential.
Technical Analysis helps you decide when to buy or sell by tracking market behavior and sentiment.
In essence, fundamentals tell the story, and technicals tell the timing. Successful traders often combine both — using fundamentals to choose quality assets and technicals to manage entry, exit, and risk. In today’s fast-moving markets, mastering both approaches gives traders a strategic edge and helps them make well-informed, confident trading decisions.
Emotional Discipline and Risk Control in Trading🧠 1. Why Emotional Discipline Matters
Emotional discipline means sticking to your plan regardless of fear or greed.
Markets are designed to test your patience, confidence, and decision-making. Every losing trade tempts you to change your system — but consistency wins.
✅ Key habits of emotionally disciplined traders:
They accept losses without revenge trading.
They follow rules, not impulses.
They manage expectations — no trade will make them rich overnight.
💰 2. Risk Control — Protect Before You Profit
Your risk management defines your survival. Successful traders think in probabilities, not certainties. They never risk too much on one idea.
📏 Golden Rules of Risk Control:
Risk 1–2% of your capital per trade.
Always use a stop-loss, never a “mental” one.
Define your R:R ratio (minimum 1:2 or better).
Never add to a losing position — only to confirmed winners.
Risk control is not about avoiding losses — it’s about limiting damage and staying consistent over time.
🧩 3. How to Strengthen Emotional Discipline
Like a muscle, discipline grows with routine. Try this daily:
Pre-trade routine – review your plan before every session.
Post-trade journal – log your emotions, not just results.
Take breaks – emotional fatigue leads to poor judgment.
Detach from outcomes – focus on process, not profit.
💡 Tip: When you reduce emotional pressure, your clarity and accuracy both improve.
⚙️ 4. Professional Mindset Shift
Amateurs chase profit; professionals protect capital.
Each trade is just one data point — not a reflection of your worth. Once you start thinking like a risk manager first, your results change naturally.
🗣️ “Discipline is choosing what you want most over what you want now.”
📊 Conclusion
To grow as a trader, focus on controlling yourself before controlling the market.
Emotional stability + strict risk control = long-term success.
Be the trader who executes with logic, not emotion. 🧘♂️
XAUUSD MULTI TIME FRAME ANALYSISHello traders , here is the full multi time frame analysis for this pair, let me know in the comment section below if you have any questions , the entry will be taken only if all rules of the strategies will be satisfied. wait for more price action to develop before taking any position. I suggest you keep this pair on your watchlist and see if the rules of your strategy are satisfied.
🧠💡 Share your unique analysis, thoughts, and ideas in the comments section below. I'm excited to hear your perspective on this pair .
💭🔍 Don't hesitate to comment if you have any questions or queries regarding this analysis.

LUCY’S VIEW ON GOLD FOR THE WEEKLUCY’S VIEW ON GOLD FOR THE WEEK 💎
Hey everyone 💕
A fresh week begins, and Gold (XAUUSD) is already showing some interesting setups. It looks like wave 5 is starting to form — which could lead to a stronger directional move soon.
Let’s take a closer look at the technical picture together 🌿
🔍 Technical Outlook
On the 4H chart, Gold is hovering around the 4000 zone after completing its wave (4) correction.
The current structure suggests that wave 5 down may be unfolding.
However, we’ll need a clear break below 3900 to confirm further downside pressure 📉
From the ICT perspective, the Fair Value Gaps (FVG) above are acting as liquidity traps — areas where sellers might step back in if price sweeps higher.
According to Fibonacci levels, the 0.382 zone near 4000 remains a key balance point, while the 1.618 extension around 3550 could become a longer-term target if the bearish wave extends 🔻
⚙️ Key Price Zones to Watch
The area near 4060 is a strong resistance, aligning with an FVG zone — if Gold breaks above, the short-term bias could shift toward 4100–4150, and even 4250 🌸
On the downside, 3995 is the first support, followed by 3920, and deeper near 3850–3900.
A decisive break below these levels could open the way for a stronger wave 5 move toward the 3550 zone.
🎯 Trade Setup
💼 Sell Entry: 4050
⛔ Stop Loss: 4060
🎯 Targets: 4023 – 4000 – 3988 – 3965
I’ll stay focused on selling around the upper FVG zone, but will adjust quickly if price shows a clean breakout above 4060.
⚠️ Note & Closing
This analysis reflects Lucy’s personal view based on Trendline, Fibonacci, and ICT concepts 📊
It’s not financial advice.
Share your thoughts on Gold’s next move in the comments 💬
And don’t forget to follow Lucy for daily insights — where technical precision meets trading emotion 💫🌙

Gold Next Move below or above Gold Next Move below or Above $4000-$4010 only
Gold dropped well with Fed resume the rates

Gold for next week -> 3 Nov 2025I'm expecting a drop into the demand zone and from there expecting a rally into the next supply zone which I marked above.
