Gold Stuck Between 4050-4100. Now What?Gold price is currently trading in classic range-bound behavior on the daily timeframe, with price action consolidating between the 4050-4100 area (On closing basis ) as marked by the rectangle on the chart.
Based on the current technical setup, I'm anticipating continued consolidation for approximately 6-7 weeks from this point. However, this isn't likely to be a simple sideways move the consolidation is expected to carry a bearish undertone, meaning we may see more pressure toward the lower end of the range during this period.
after mid-January, conditions appear favorable for a fresh buying rally to develop. This consolidation phase may simply be the market gathering momentum for the next leg higher, allowing for profit-taking and position adjustments before the next bullish impulse.
While range trading can be tempting during consolidation phases,., buying on dips remains the more favorable approach.
Trade ideas

Strong news chain could push gold to retest 4300🟡 XAU/USD – Weekly Trading Plan (Nov 23–29)
SMC – FVG – Supply/Demand – High-Impact News Week
1. Market Context
Gold is sideways in the H4 accumulation structure, forming higher lows along the trendline.
Above are 3 important supply layers:
OLD FVG 1
OLD FVG 2
Large FVG 4220–4300
the price needs to sweep liquidity & hit the supply zone before creating a new direction.
2. Strong News Schedule for the Week
This week has a lot of USD news directly affecting gold:
Tuesday (Nov 25)
Core PPI – Retail Sales – PPI (4 consecutive red news) → strong volatility.
Wednesday (Nov 26)
Unemployment Claims
Durable Goods → Core Durable Goods
GDP q/q – GDP Price Index
Core PCE (most important inflation news of the week)
➡️ This is the decisive day for the trend for the rest of the week.
Friday (Nov 28)
German CPI (affects EUR → USD indirectly)
🎯 News Conclusion:
→ Gold likely to fake move – sweep liquidity before running correctly.
→ Thin SL zones will be continuously hunted.
3. Key Levels (from the chart you sent)
🔻 SELL Zone (Supply – FVG)
4189 – 4191 (Main Sell)
SL: 4195
This is a strong reaction zone for the week.
4132 – 4134 (Sell scalp)
SL: 4138
🔵 BUY Zone (Demand – Trendline – SMC)
4906 – 4904 (main BUY scalp zone in the chart)
SL: 3999
→ This is the only zone clearly marked as BUY in the chart.
Psychological level: 4000 – 3985
If the price falls → strong reaction to form the weekly low.
4. Weekly Trading Scenarios
🅰️ Scenario 1 – Price retraces to supply zone before dropping (most likely)
Price is forecasted to retest 4132–4134 → 4189–4191
After hitting 4190 ± → potential appearance of:
Bearish BOS H1/H4
Strong reversal to 4050 – 4000
🔻 SELL Plan
Sell 4132–4134 (scalp) SL 4138
Main Sell 4189–4191 SL 4195
TP targets:
TP1: 4090
TP2: 4050
TP3: 4000
🅱️ Scenario 2 – Price dips before news then surges (kill liquidity)
If gold is pushed down before PPI/GDP news:
Best BUY zone: 4000 – 3985
Form a low → surge back up to test supply.
🔵 BUY Plan
BUY 4000–3985
SL: 3975
TP:
4050
4100
4130
🅾️ Scenario 3 – If 4200 breaks
If 4200 is broken by a large-bodied H4 candle:
➡️ High probability gold will move up to test large FVG 4250–4300
→ At that point, only look for BUY pullbacks, no more SELL.

XAUUSD Bullish Retracement Setup from Support Zone Toward Key Re1. Market Structure
Price is currently trading near a major support zone (~4055–4060 area), highlighted in blue.
Multiple rejections from this zone in the past indicate strong buying interest.
The structure shows higher lows forming intraday, suggesting bullish pressure building.
2. Key Zones
🔵 Support Zone (Entry Region)
Marked around 4055–4060.
Price dipped into this zone and bounced, showing a potential demand area for long positions.
🔵 Resistance Level (First Target Region)
Around 4081–4098.
This is the first major resistance the price is likely to test after bouncing.
🔵 Final Target Zone
4120 area, the upper major resistance.
Previous highs around this level show strong selling interest historically.
3. Expected Price Movement
The chart suggests a potential bullish move:
Price bounces from the support (entry) area.
Climbs toward 4081 (minor resistance).
Retraces slightly.
Continues upward toward 4097–4100.
Final push toward 4120 target zone.
This is a classic retracement + continuation bullish structure.
4. Trade Idea
Bias: Bullish
Entry: 4055–4060 (support zone)
First TP: 4081
Second TP: 4097–4100
Final Target: 4120
Stop Loss: Below 4050 (beneath support zone)

XAUUSD – Waiting for Trend Confirmation Around the 4,160–4,170..XAUUSD – Waiting for Trend Confirmation Around the 4,160–4,170 Zone
At the moment, gold has not shown a clearly defined medium-term trend. Price is moving around an important resistance zone, so instead of predicting direction early, I prefer waiting for price reaction at key levels before taking action.
The main focus today is the 4,160–4,170 area – where the market will decide whether to continue the uptrend or start a deeper correction.
🎯 Scenario 1 – SELL at 4,162–4,165 (Priority if No Clear Breakout)
Sell: 4.162 – 4.165
SL: 4.173
TP: 4.140 – 4.122 – 4.110 – 4.100
The 4.162–4.165 zone on H1 is a strong resistance area combining Fibonacci confluence, previous supply, and proximity to the short-term rising trendline.
If price taps this zone and shows weakness (upper-wick rejection, reversal candle, low volume confirmation), I prefer taking a short-term sell toward 4.140, with deeper targets at the liquidity cluster around 4.110–4.100.
Risk for this scenario is capped at 1–2% per trade. Do NOT hold the position if price closes above 4.173.
⭐ Scenario 2 – BUY on Break Above 4,170 (Trend Continuation Confirmation)
Buy: 4.171 – 4.173 (only after a clean breakout)
SL: 4.163
TP: 4.188 – 4.200 – 4.215
If price breaks decisively above 4.170 and sustains above it, that confirms buyers are still in control.
In this case, I switch my bias to buying the breakout, targeting the next resistance zones around 4.200–4.215, and possibly higher if momentum remains strong.
Note: Only buy if the breakout is genuine — strong candle body closing above 4.170, not a stop-hunt wick that pulls back immediately.
1. Fundamental Outlook
The DXY continues slipping below 99.50, now near 99.45, showing sustained weakness as markets increase expectations for a December Fed rate cut.
Easier monetary conditions generally support gold because the opportunity cost of holding gold is reduced.
However, U.S. initial jobless claims have dropped to the lowest level since April, showing the labour market is still resilient.
This creates a mixed environment: rate-cut expectations support gold, but strong economic data may cause sudden volatility around news releases.
Overall, fundamentals lean slightly bullish for gold, but not strongly enough to ignore potential technical pullbacks.
2. Technical Structure
On the H1 chart, after a strong rally, gold is now consolidating right below the 4.160–4.170 resistance.
The 4.162–4.165 region is a confluence zone:
• horizontal resistance
• previous supply
• area where strong selling pressure appeared earlier
The 4.140 level is the “correction confirmation level” — if price breaks and closes below it, the market will likely aim for the major liquidity area around 4.110–4.100, where many Buy-side stop losses are clustered.
The current structure allows for both long and short setups, but each scenario requires clear price confirmation at the 4.160–4.170 zone.
3. Market Sentiment & Action Plan
Both buyers and sellers are watching the same price zone — 4.160–4.170.
This makes it a high-liquidity area where stops for both sides may get swept before the market shows its real direction.
If price rejects strongly from this zone, it could be a sign of late buyers being flushed out.
If buyers hold price above 4.170, trapped short positions may fuel a short squeeze toward higher resistance zones.
My plan: I do not enter mid-range. I wait for clear signals:
• Sell at 4.162–4.165 if reversal confirmation appears.
• Buy at 4.171–4.173 after a confirmed breakout and hold above the zone.
• Always use a hard stop-loss. No widening stops if price goes against the trade.
If price breaks both zones without giving clear signals, I stay out and wait for a new structure instead of forcing a prediction.
I always read feedback to improve how I share these analyses in future posts.

XAU/USD – Gold Holds Above Key Support as Pullback Stays LimitedGold remains capped below its two-week high during the Asian session, but the downside is clearly limited.
Market sentiment is shaped by:
A weaker USD as dovish Fed expectations gain traction
Rising probability of rate cuts in upcoming meetings
Improving global risk sentiment amid hopes of progress in Russia–Ukraine negotiations
Even though Gold is retracing, the bigger picture remains bullish as long as price holds above key support zones.
📊 Technical Outlook – MMF Trading Style (M30/H1)
Price is currently consolidating below the resistance cluster 4,156 – 4,170, retracing into multiple demand zones.
Key Levels to Watch
Support 1: 4,131 – 4,137
Support 2: 4,115 – 4,118
Support 3 (major liquidity): 4,083 – 4,090
Main Resistance: 4,170 – 4,193
Market structure shows a clean zigzag pullback, suggesting a potential bullish continuation once liquidity is collected below.
🎯 MMF Intraday Trading Plan
Scenario 1 – Buy the Dip (Primary Bias)
Best trade today: Buying retracements into demand.
BUY: 4,115 – 4,118
SL: 4,103
TP: 4,131 → 4,156 → 4,170
BUY (extended liquidity sweep): 4,083 – 4,090
SL: 4,070
TP: 4,118 → 4,145 → 4,170 – 4,193
Reason: Fibo confluence + strong demand + liquidity zone = high-probability reversal area.
Scenario 2 – Short-Term SELL (Scalp Only)
Only valid if price rejects strongly at resistance.
SELL: 4,156 – 4,170
SL: 4,177
TP: 4,145 → 4,131
This is not the main bias today.
⚜️ MMF Trading View
Gold is forming a healthy pullback—not, at this stage, a bearish reversal.
As long as price stays above 4,08x, the bullish structure remains intact.
“In Gold, the goal isn’t chasing the breakout — it’s waiting for price to return to value.”
Today’s focus: Prefer BUY setups on retracement – SELL only for quick scalps.

LiamTrading – XAUUSD H1 | Gold forming Head–Shoulders Pattern...LiamTrading – XAUUSD H1 | Gold forming Head–Shoulders Pattern, waiting for pullback to POC for entry
Gold is completing the final bullish leg of the Head–Shoulders structure on the H1 timeframe.
Price has now reached the Fibonacci zone (both retracement + extension), which also aligns with a resistance cluster and the POC of the Volume Profile — so the current choppy reaction is completely normal.
My plan is to use this pullback:
→ prioritize short-term Buy entries following the current bullish leg,
→ then look for Sell setups at the strong resistance above.
Macro Background
Russia continues missile strikes on Kyiv right after the US–Ukraine reached a “19-point framework”, causing peace prospects to stall again.
However, secret negotiations among the US, Russia, and Ukraine in Abu Dhabi are still ongoing, though no major terms have been finalized.
With “war not stopping – negotiations not settled”, global risk sentiment remains tense.
This keeps medium–long-term demand for Gold strong.
But in the short term, price may still show wide swings around key technical zones before choosing a clearer direction.
H1 Technical Analysis – Head & Shoulders, Fibonacci, Volume Profile
The Head–Shoulders pattern is now clearly visible.
Price is currently in the right-shoulder completion phase, approaching upper resistance.
Gold at the moment is:
Hitting the Fibonacci retracement of the previous decline.
Also overlapping with the Fibonacci extension of the short-term bullish wave → high chance of reaction and volatility.
Below price, the 4090–4093 zone is a support/mini-POC area where Volume Profile thickens — ideal for a short-term Buy following the current bullish structure.
Above price, the 4185–4187 zone is a strong resistance cluster:
Confluence of potential right-shoulder top + old supply + Fibonacci extension.
This is the area I will prioritize for Sell setups once the pattern completes.
Notable Support/FVG zones:
4122–4116 (near support)
4169–4210 (mid-term FVG/resistance)
Reference Trading Scenarios
1. Buy with the current bullish wave (short-term)
Buy: 4091–4093
SL: 4085
TP: 4120 → 4145 → 4170 → 4190 → 4220
Logic:
Buy at the confluence support + small POC, taking advantage of the upward push completing the right shoulder.
Once the trade reaches +1R, shift SL to breakeven to protect capital.
2. Sell at the Head–Shoulders resistance zone (medium-term priority)
Sell: 4185–4187
SL: 4193
TP: 4170 → 4155 → 4130 → 4110
Logic:
This is a strong resistance zone overlapping the supply region and Fibonacci extension.
Only activate the Sell if H1/M15 shows clear rejection signals (pin bar, bearish engulfing, weak volume) around 4185–4187.
Additional Levels to Watch
Support – FVG: 4122–4116
Resistance – FVG: 4169–4210
Can be used for quick scalp opportunities, but the main scenarios remain:
Buy near 409x as long as major resistance hasn’t been touched.
Sell near 418x when the Head–Shoulders structure shows completion signs.

HOW FAR WILL GOLD RISE?
1. MARKET CONTEXT
Yesterday, during the Asian and European sessions, gold prices mainly moved sideways – accumulating within a narrow range.
In the U.S. session, gold prices broke strongly through the 413X region and formed:
Inverse Head and Shoulders pattern (iH&S)
The upward structure returns → buyers dominate
This indicates that the upward momentum has returned, and the market leans towards continuing to rise if it does not break the important support area.
Fundamental factors supporting buyers
The market is expecting the Fed to cut interest rates in December.
Tonight there is PPI news — an important indicator directly affecting inflation expectations and Fed expectations.
→ This could be a catalyst for strong volatility in the U.S. session.
2. MAIN TRADING DIRECTION FOR THE DAY
➡️ Prioritize BUY (look to buy) according to the main trend.
➡️ SELL is only reactive – for retracement, not the main trend.
3. POTENTIAL BUY ZONES
Beautiful support areas to look for buying opportunities today:
📍 BUY zone 1 – Nearest
413X (early day resistance and yesterday's breakout area)
→ Beautiful entry area for scalping or buy follow trend.
📍 BUY zone 2
4100 – 4103
→ Psychological support & structural confluence area.
📍 BUY zone 3
4088 – 4090
📍 BUY zone 4
4060 – 4065
→ Strong support area, look to catch the bottom in case of deep price correction.
4. REACTIVE SELL ZONES (ONLY SELL FOR RETRACEMENT)
Only sell when price hits the area — clear rejection signals appear:
📍 SELL zone 1 (nearest)
4180 – 4186
📍 SELL zone 2
4190 – 4195
📍 SELL zone 3
4202 – 4205
Safe SELL conditions:
Only sell counter-trend, prioritize scalping.
If these areas are strongly broken + H1/H4 candle closes, consider buyers winning, then do not sell anymore.
5. CAPITAL MANAGEMENT – RISK MANAGEMENT
SL = 10 points
TP = 10 points
RR ratio = 1:1.2
Do not hold positions through PPI news if not really sure about the pattern.
6. NOTES ON METHOD
Buy orders will dominate the day.
Sell only when there is a strong reaction at resistance.
Scalping: open orders on smaller timeframes (M1–M5–M15) to optimize Entry.
Always wait for price action confirmation (pinbar, engulfing, retest…) before entering orders.
7. SUMMARY
Today's tendency is mainly BUY, based on:
The return of the upward trend
Inverse Head and Shoulders pattern
Expectations of a dovish Fed
PPI news triggering volatility
Wishing everyone an effective trading day — total victory! 🔥💹

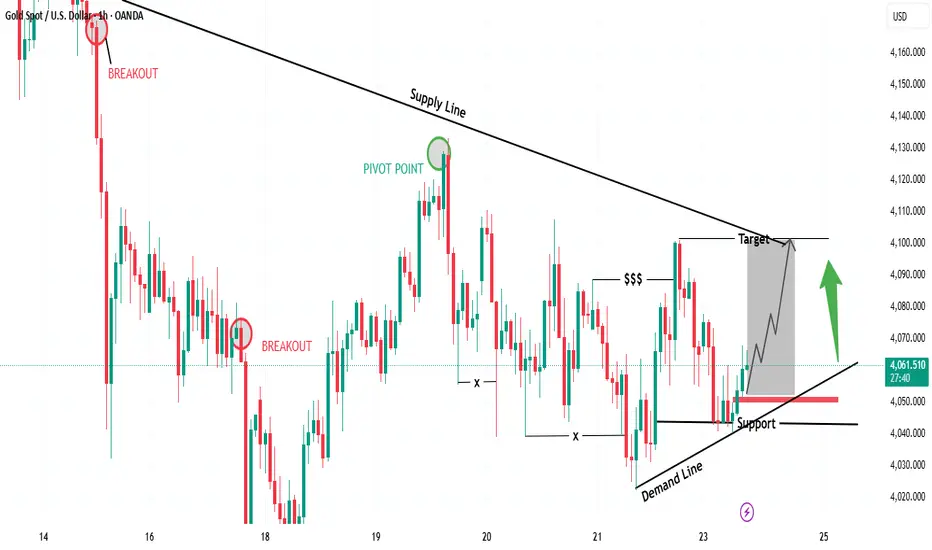
“Gold Rebounding from Demand – Targeting Supply Line Retest🔍 Key Observations
📉 Supply Line (Downtrend Resistance)
Each rally is being capped by the descending supply line
📈 Demand Line (Ascending Support)
Buyers defending higher lows
Strong bullish reaction off support
💰 Liquidity Grab ($$$)
Liquidity was taken below swing lows — bullish signal
Smart money likely securing positions before pushing up
🟢 Bullish Confirmation
If price holds above demand line + support zone
Expect bullish continuation toward supply line retest
🎯 Suitable Target Levels
Target Level (Approx) Status
🥇 First Target 4,095 – 4,105 At supply line retest
🥈 Extended Target 4,120 – 4,130 Breakout continuation
📌 Trade Idea (Bullish Scenario)
Entry Zone: 4,055 – 4,065 🟩
Stop Loss: Below 4,025 ❌
Take Profit 1: 4,100 🎯
Take Profit 2: 4,125 🚀
RR Ratio: 1:2.5 – 1:3 📈
🧭 Market Sentiment
📍 Bias → Short-term Bullish
🛑 But… sellers may reappear at supply line
⚠️ Watch for fakeouts near the target
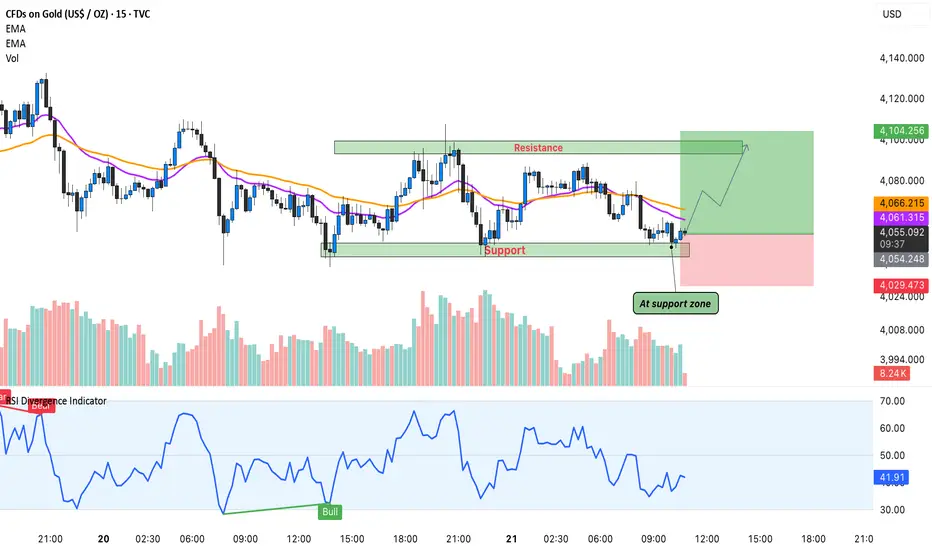
Gold’s Intraday Reversal – Buyers Stepping In!Hello Guy's Let's analyse Gold and it is once again respected the intraday support zone highlighted on the chart. This level has acted as a strong demand area multiple times, and today price reacted from the same zone with clear bullish intent.
Price is also sitting above EMA 20 & EMA 50, and the RSI bullish divergence confirms that momentum could be shifting back toward the upside.
If buyers hold this support, we can see a short-term push toward the 4,090–4,105 resistance region. A clean breakout above that may open more upside, but for now the focus remains on this bounce setup.
This is not breakout trading, this is simply reacting to a level where buyers have shown strength many times.
As long as this support holds, the risk-reward favors the bullish side.
Analysis By @TraderRahulPal | More analysis & educational content on my profile.
Advanced / Premium-Level PatternsWhy Chart Patterns Work Universally
Human psychology doesn’t change.
Market cycles repeat.
Patterns reflect economic behaviour.
Institutional buying/selling creates recognizable structures.
Liquidity zones attract predictable reactions.

XAUUSD – H1 uptrend channel, short-term downside risk increasingXAUUSD – H1 uptrend channel, short-term downside risk increasing Brian – Prioritize short selling at the channel peak, wait to buy back at lower support
I. Strategy Summary Gold is trading in an uptrend channel on H1, but the rise around 4.160 shows signs of weakening, increasing short-term correction risk.
Preferred Scenario: Short sell at the channel peak 4.162–4.164, targeting support areas 4.145 – 4.130 – 4.115 – 4.100.
After the correction, the 4.100–4.080 area may become the foundation for the next rise in the larger trend.
Important price areas to watch: 4.139 – 4.127 – 4.110 – 4.088.
II. Macro Context & News 27/11
02:00 – Fed releases Beige Book This document updates the Fed branches' assessment of the US economic situation.
Describing slower growth, cooling price pressures will further reinforce expectations that the Fed will soon cut interest rates → supporting gold.
Conversely, if the Beige Book describes the economy as still “resilient,” the market may temporarily slow down pricing in rate cuts → causing a short-term adjustment for gold.
19:30 – ECB releases October meeting minutes
If the minutes lean towards the scenario of keeping high interest rates longer, the EUR may be supported, indirectly affecting the USD and gold inflows.
However, the impact is usually not as strong as US data, mainly affecting the overall risk-on/risk-off sentiment.
General Context: Gold has surpassed 4.160 USD/oz as the market increasingly expects the Fed to cut interest rates as early as December, reducing the appeal of interest-bearing assets and increasing the allure of gold – a non-yielding asset. This creates a support foundation for the medium-term uptrend, but after a hot rise, technical adjustments on H1 are normal.
III. Technical Structure – H1 uptrend channel
The price is within the H1 uptrend channel, with rising peaks and troughs, but the upper area near 4.160 coincides with:
The upper boundary of the price channel. The “Sell POC” area on the chart – where liquidity and sell orders are concentrated.
Preferred scenario on the chart: The price may slightly rebound to the POC area 4.162–4.164, then be rejected and slide to the important support area around 4.110 before extending the adjustment down to 4.100–4.080.
The lower trendline of the uptrend channel also acts as a short-term buy area if a clear candle reaction appears.
Notable price areas on H1: Resistance: 4.162–4.164 (channel peak + POC). Intermediate support: 4.139 – 4.127 – 4.110. Deep support: 4.088 – 4.080 – 4.100 (area that may form the bottom for the next rise).
IV. Trading Plan 1. Preferred Scenario – Short sell at the channel peak Idea: Short sell when the price rebounds to the upper boundary of the H1 uptrend channel and POC 4.162–4.164, expecting a correction to support.
Sell: 4.162–4.164 SL: 4.168 TP targets: TP1: 4.145 TP2: 4.130 TP3: 4.115 TP4: 4.100
This is a counter-move order in the uptrend channel, only targeting a short-term correction, not a major trend reversal scenario.
2. Supplementary Scenario – Short buy at support trendline Idea: When the price hits the lower trendline of the H1 uptrend channel and a nice candle reaction appears, consider a short-term buy according to the channel, prioritizing areas:
4.139 – 4.127 – 4.110 – 4.088
Specific Entry/SL levels will depend on the actual price reaction at the trendline, but the general principle:
Buy close to the trendline,
SL placed below the immediate support area,
TP aimed at the middle of the channel or the nearest resistance.
V. Risk Management & Notes
Do not open new positions right before or at the time of the Beige Book and ECB minutes release, as volatility may suddenly increase, widening spreads.
The sell order at 4.162–4.164 is a short-term counter-trend order in the uptrend channel, requiring moderate volume and strict adherence to SL 4.168.
If the price clearly breaks and holds above the 4.170 area, the H1 correction scenario weakens – in that case, stay out, wait for a new structure instead of trying to maintain a sell view.

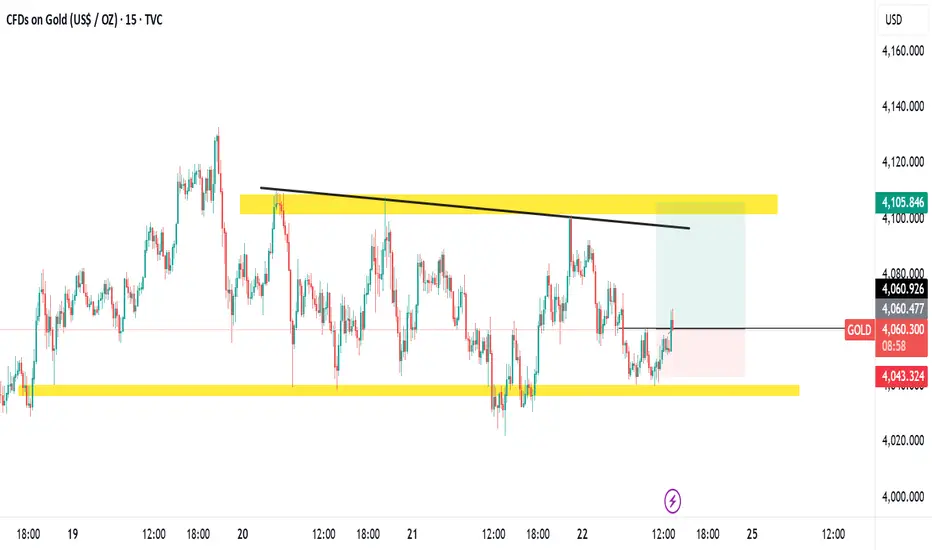
Gold Analysis for upside movement. Gold trading in a sideways zone. buyer's liquidity has already been grabbed. targeting for
sell side pending liquidity.
Trade Journal Missed trade XAUUSD SellNamaste 🙏 everyone
What hurts more than missing an A+ setup?
Many other things, life is beyond trading lol
Ok so this was a clean setup,
We were in a daily bearish FVG on gold and we had smt betweengold and silver at London highs.
Easy setup, enter at change in State and target 1 to 2 RR, I mean it doesn't get easier than this.

Brian here with the gold outlook for November 20thGood morning everyone, Brian here with the gold outlook for November 20th. The ABC correction phase of gold is nearly complete, and the market is preparing to enter a new wave phase amidst a flurry of USD data today.
Fundamental Analysis
Today's focus remains on the US labor data: NFP (or revisions), Unemployment Rate, and Initial Jobless Claims.
If the data shows a cooling labor market, expectations for the Fed to soon pivot to a rate-cutting cycle will rise, weakening real yields, putting pressure on the USD, and supporting gold prices.
Conversely, "too good" data will strengthen the dollar, allowing for a short-term repricing move, potentially dragging gold down to lower liquidity zones before recovering.
US session liquidity may be thin before the news release, making it prone to spikes due to algorithms and large flows simultaneously adjusting positions.
Overall, the macro backdrop still favors "buying the dip" for gold, but you must accept strong volatility around news time.
Technical Analysis
On the chart, gold has completed an ABC corrective wave within a descending channel, part of a larger uptrend.
The current descending channel only serves as a corrective leg after the previous upward wave; prices are trading above the "mean" area of the bullish structure, indicating the larger market structure remains bullish.
Below is the liquidity zone / demand zone 4013–4015, coinciding with the previous low and the lower channel boundary – if there's another stop-hunt to this area, it is still considered an opportunity to join the upward move, as long as 4008 is not breached.
Above, the 4086–4100 cluster is the decision zone: breaking and holding above here will confirm exiting the corrective channel, triggering an impulsive leg towards resistances 4132–4146 and further to 4187.
In summary, the main bias remains bullish, prioritizing buy strategies at support zones or after breakout confirmation.
Key Price Levels
Resistance: 4086 – 4100 – 4110 – 4132 – 4146
Support: 4040 – 4030 – 4015
Trading Scenarios
Buy Scenario 1 – Continuation Breakout
Entry: 4086
SL: 4078
TP: 4100 – 4120 – 4140
Prioritize when price breaks up and retests 4086–4100 as a new support zone, confirming exit from the descending channel.
Buy Scenario 2 – Deep Liquidity Sweep
Entry: 4015–4013
SL: 4008
TP: 4030 – 4045 – 4070
Watch for strong price reactions at the demand zone, with pin bars or engulfing candles signaling order flow returning to buyers.
Sell Scenario – Sell Reaction at Strong Resistance
Entry: 4144–4146
SL: 4151
TP: 4132 – 4120 – 4100
Short-term sell strategy, leveraging the high supply zone if price rises straight up without sufficient accumulation.
The medium-term upside target if the bullish wave develops as expected remains the 4187 area.
What do you think of this scenario? Remember to follow Brian for daily gold insights and comment your views below to join the discussion.

OVERVIEW FOR TODAY - CHART H1 OVERVIEW
Price is currently sitting inside the POC zone – the area with the highest traded volume → the market usually consolidates here before choosing a direction.
Prior trend: Strong uptrend → distribution → correction.
The ascending trendline has been broken → short-term trend is bearish (downtrend).
Volume Profile shows the VAH above as strong resistance, and VAL below as strong support.
1: Price bounces from POC → moves up toward VAH (medium probability)
Conditions:
Price holds above the POC zone (~4000–4010).
Bullish price action appears (pin bar, engulfing, break of structure on H4).
Targets:
4120–4160 (VAH zone) → this is major resistance.
If VAH breaks → trend may resume upward with a larger target around 4300+.
Assessment:
Possible, but not the highest probability, because recent bearish momentum is still strong.
2: Price breaks below POC → retest → drops to VAL (HIGHEST PROBABILITY)
Current candles show strong rejection from VAH → falling directly into POC → bearish confirmation.
If D1 closes below the POC:
Bearish continuation becomes likely.
Targets:
3920–3950 (VAL zone) → very strong support.
Volume Profile thins out here → price tends to move quickly through this area.
Assessment:
This is the most likely scenario because:
✔ Trendline is broken.
✔ Weak bullish reaction at VAH.
✔ Volume Profile structure favors a move downward into VAL.
3: Price breaks below VAL → deeper drop toward Demand zone (low probability but dangerous)
Conditions:
D1 closes below 3920 (VAL)
Breaks the horizontal support.
Deep Targets:
3550–3600 (major Demand zone).
This is where the longer-term uptrend may recover.
Assessment:
Low probability, but if triggered → gold will make a sharp correction.
FINAL CONCLUSION
Highest probability: BEARISH continuation → drop toward VAL zone (3920–3950)
Because:
Strong rejection from VAH
Price sitting weakly on POC
Short-term structure turning bearish
[bTrading Suggestions
For short setups:
Look to sell on a retest of POC (4000–4010).
SL above VAH (4060–4080).
TP at VAL.
For long setups:
Only buy at VAL zone when clear reversals appear (pin bar, engulfing).
Avoid buying between POC → VAL.
⚠️ Disclaimer
All analyses and insights provided in this content are for informational purposes only and should not be considered financial advice. The financial market carries inherent risks, and every trader is fully responsible for their own decisions. Trade with a plan, discipline, and proper risk management.

Gold Analysis & Trading Strategy | November 20-21✅ From the 4-hour chart, gold remains in a weak, downward-biased consolidation structure after yesterday’s failed rally.
1️⃣ Moving averages show a bearish setup
MA5 and MA10 have formed a bearish crossover and continue to slope downward, indicating that short-term bearish momentum still dominates.
MA20 (around 4082–4088) acts as strong resistance; price has repeatedly failed to break above it, showing weak rebound strength.
2️⃣ Bollinger Bands indicate weakness
The Bollinger middle band (around 4069) continues to suppress the price; the latest candles remain below it — a classic weak consolidation pattern.
The lower band (around 4014) remains the next downward target.
3️⃣ Rebound attempts fail
Multiple attempts to break above 4088–4090 failed, creating a short-term top structure.
The recent rebound also failed to break above the moving averages, showing continued lack of bullish momentum.
➡️ H4 Conclusion: The structure remains bearish. As long as price stays below 4090, the market bias remains to the downside.
✅The 1-hour chart confirms the same bearish structure:
1️⃣ Clear downward channel
After topping at 4132, gold dropped sharply to 4038, then rebounded to 4068–4070 and faced renewed selling pressure.
MA5 / MA10 / MA20 / MA60 are again aligned in a bearish formation.
2️⃣ Rebound momentum is weak
The latest rebound only reached MA10–MA20 before turning down again, showing strong selling pressure.
Key resistance remains at 4070–4085; breaking above this area is unlikely.
3️⃣ Key support at 4044–4038
This zone has shown short-term buying interest but lacks strength.
A break below this region will open the path toward 4015–4008.
➡️ H1 Conclusion: Weak short-term structure with limited rebound strength. More downside tests toward 4044–4038 remain likely.
🔴 Resistance Levels
4070–4085
4100–4110
4132
🟢 Support Levels
4044–4038
4015–4008
3997
✅ Trading Strategy Suggestions
🔰 Strategy 1: Sell the Rebound (Main Plan)
If gold rebounds to 4070–4085 and faces rejection:
➡️ Enter light short positions
SL: 4090
Targets: 4055 / 4044 / 4035
👉 This is the highest-probability strategy under current conditions.
🔰 Strategy 2: Strong Resistance Short (Aggressive)
If gold reaches 4100–4110:
➡️ Use medium position shorts
SL: 4120
Targets: 4065 / 4045
👉 Strong resistance zone; breakout probability is low.
🔰 Strategy 3: Breakout Short Below Support
If gold breaks 4044–4038:
➡️ Follow the trend with breakout shorts
Targets: 4015 / 4000
👉 Loss of this zone will open further downside.
📌 Summary
Both H4 and H1 remain in a weak bearish structure.
Rebounds lack momentum and are consistently pressured by moving averages.
4044–4038 is the key support; if broken, the downtrend will accelerate.
Recommended approach today:
Sell rebounds as the primary strategy
Buy dips only at strong support levels (around 4038)

Gold (XAU/USD) 2H Chart Analysis – Sell Setup from High ProbabilBased on the chart you provided, Gold is currently reacting near a High Probability POI (supply zone) after a corrective bullish move. The structure still shows:
Lower highs and lower lows → Bearish market structure
Price is approaching a supply zone where sellers previously dominated
Liquidity has been taken above internal highs (marked as "$$$"), indicating a liquidity grab
This supports a short position idea from the supply zone.
🔍 Key Technical Levels
Zone / Level Meaning
4,125 – 4,150 USD High Probability POI / Supply (Sell area)
4,080 – 4,100 USD Entry region (price is currently here)
4,040 – 4,025 USD First reaction / partial take zone (50% area)
3,990 – 4,000 USD Main Target (previous demand + equal lows)
🎯 Suggested Target
Primary Target: $4,000
(Exactly aligning with your chart’s marked “TARGET” zone where liquidity sits)
If momentum continues and structure breaks more aggressively:
Extended Target: $3,975 – $3,960
(deeper sweep into demand)
🛑 Risk Management
Detail Level
Stop Loss Above 4,155 USD (beyond POI + liquidity)
R:R Potential Approx. 1:3 to 1:4
📌 Summary
Price has retraced into a key supply zone
Liquidity was taken → seller confirmation likely
Expectation is continuation downward towards the liquidity pool below
📊 Title Recommendation:
“Gold Retests Supply Zone – Bearish Continuation Toward $4,000 Expected”

GOLD REVERSAL AREA GOLD will reverse from this area for sure if you see any CHoCH in these level in 5MIn hold it till bottom

XAUUSD Positional Long with SL#Gold Positional Trade Outlook
Gold is currently pulling back after a sharp rally, offering #positional traders an opportunity to build entries gradually with the target upto prev ATH or rejection. Price is approaching key demand zones, so follow a scaled stop-loss (SL) structure to manage risk effectively. Consider building positions in phases as price reacts to each support level:
SL1: 4,008 – Early protective stop for light entries
SL2: 3,930 – Medium-risk level for second build-up
SL3: 3,886 – Deep stop for long-term positional holds
Stick to disciplined risk management, add positions only on confirmations, and allow the trend structure to guide your exposure.

The Gold Bullish Setup You Can't Miss!OANDA:XAUUSD The price is clearly approaching a critical support zone, one that has previously triggered positive reactions in the market. This zone also aligns closely with the psychological level of $4,000, which tends to capture the market’s full attention.
Given the current momentum, there’s a strong possibility that buyers will step in and push prices higher. A confirmation, such as a solid rejection pattern, a bullish engulfing candle, or a long lower shadow, would significantly increase the likelihood of a rebound. If my analysis proves accurate, and buyers regain control, we could see the price rise to around $4,070.
However, if the price breaks below this key support, it would negate the bullish outlook and could lead to further declines.
Please note, this is not financial advice!

Gold H1 – Sideway or Preparing for a Bigger Break?🟡 XAUUSD – Intraday Smart Money Plan | by Ryan_TitanTrader (20/11)
📈 Market Context
Gold continues to move inside a tight consolidation as markets digest fresh headlines:
Treasury markets just erased hopes for a December rate cut and now even a January cut is doubtful, following hawkish tones revealed in the latest Fed minutes.
This shift reinforces USD strength in the short term and pressures gold’s bullish momentum, keeping price trapped between well-defined liquidity zones.
Key implications from the news:
• The 6-month Treasury yield jumped back to 3.83%, aligning with hawkish expectations.
• Rate-cut bets evaporating → USD stays firm, limiting gold’s upside.
• Institutions are engineering both-side liquidity sweeps ahead of upcoming Fed speakers.
• Gold is currently hovering around ~$4,070 inside a neutral zone where no clean premium/discount imbalance exists.
Until the market receives fresh macro catalysts, price is likely to sweep liquidity at the edges of the range before choosing direction.
🔎 Technical Analysis (1H / SMC Structure)
• Structure: Price remains inside a short-term sideways distribution after the recent CHoCH + BOS sequence.
• Premium Sell Zone: 4145–4147, aligning with unmitigated supply + buy-side liquidity resting above recent highs.
• Discount Buy Zone: 4004–4002, sitting inside last clean demand with previous sell-side sweep.
• Liquidity Map:
→ Buy-side liquidity: above 4145–4150 (equal-high cluster).
→ Sell-side liquidity: below 4004–3997, where earlier long positions were cleared.
🔴 Sell Setup (Premium Reaction Zone)
• Entry: 4145 – 4147
• Stop-Loss: 4155
• Take-Profit:
→ 4085 (minor imbalance)
→ 4045 (range midpoint)
→ 4004 – 4002 (discount demand)
📌 Execution rule: Wait for liquidity sweep into zone + bearish CHoCH M5–M15 before entering.
🟢 Buy Setup (Discount Reaction Zone)
• Entry: 4004 – 4002
• Stop-Loss: 3997
• Take-Profit:
→ 4040 (short-term range high)
→ 4075 (inefficiency fill)
→ 4140 (premium retest)
📌 Valid only if price sweeps the 4000–3997 liquidity pocket and shows strong bullish displacement.
⚠️ Risk Management Notes
• Expect increased volatility as markets reposition after the sharp decline in rate-cut expectations.
• Avoid trading inside the 4030–4080 chop zone unless a clear structure break occurs.
• Reduce risk size during sudden USD spikes caused by Treasury-yield moves.
• Trail stops progressively as each liquidity level is taken.
📝 Summary
Gold is currently stuck in a clean intraday range as hawkish Fed minutes remove hopes for early rate cuts, pushing USD up and holding gold below premium supply.
SMC structure favors liquidity-sweep setups at both edges:
• Sell Zone: 4145–4147 (premium supply)
• Buy Zone: 4004–4002 (discount accumulation)
Expect classic manipulation → reaction → continuation patterns until the market resolves the new macro pressure.
📍 Follow @Ryan_TitanTrader for more Smart Money updates.

GOLD 4H | Bearish Retracement Into FVG • MSS → BOS 📌 Pair: XAUUSD (Gold)
⏱ Timeframe: 4H
📉 Bias: Bearish until premium FVG mitigation
The market created a clear MSS (Market Structure Shift) on the higher time frame.
Followed by multiple BOS confirming bearish continuation.
Price is currently trading below the major swing high → showing bearish orderflow.
Gold is showing a perfect ICT SMC bearish retracement after BOS + MSS.
Price is expected to continue lower as long as it stays below the FVG premium zone.
This idea is based on pure SMC + ICT concepts (BOS, MSS, FVG, BB, Premium/Discount zones).👉 Sky Eagle Trader
Get:
✔ Live XAUUSD analysis
✔ ICT + SMC concepts
✔ Entry, SL, TP updates
✔ Daily market outlook
✔ Professional charts & explanations

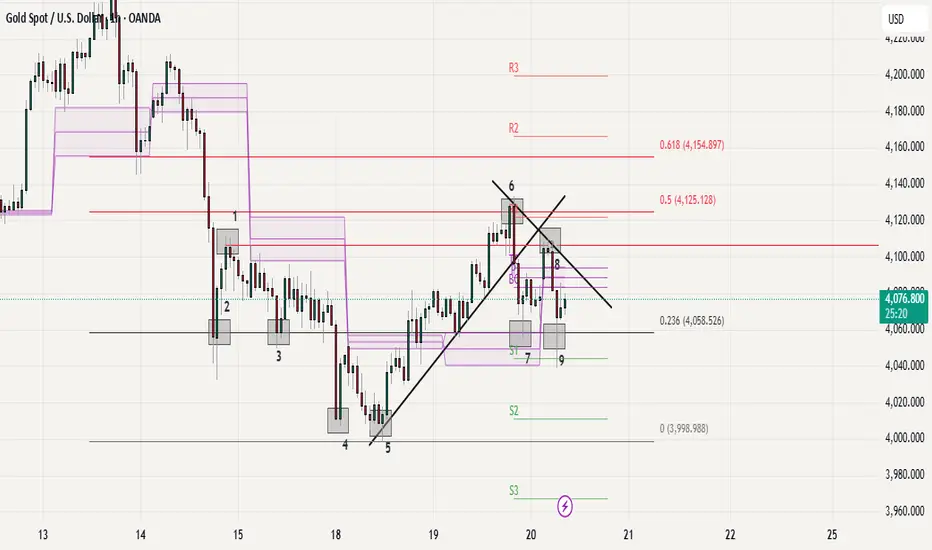
Gold Current Price Action Structure Looking weak under 6 and 8||
Support at 7 and 9, more correction under these POI.//
to go bullish need to claim /breakout on 6//
major support / Demand at 4 and 5//
Overall sentiments as per structure is correction /bearish for short term .