gold silver momentum updategold silver momentum update---- silver sustain abv 148300 than looks sharp spike 150k near expect or if blw 147300 looks sharp dwn side 146500-145300+++--- gold abv 122700 sustain looks 124800--- already 123 told ---
spot gold sustain abv 4040 looks up side 4060--85-4100 expect in sudden spike 4010 strong support now for dwn correction
Trade ideas

$4000: New Record! Correction Warning & FVG Strategy. Hello, traders!
Gold has officially set a New Record by breaching the $4,000/oz mark, hitting a peak of $4,014.60/oz. Kya baat hai! Although there was an immediate pullback after hitting this big psychological level, the rally is still getting solid support from:
Fundamentals & Market Conflict
Main Drivers: The market is pakka (sure) about two more Fed rate cuts this year (FOMC Minutes tonight are a big deal), coupled with central bank diversification and record ETF inflows ($64B) due to global gadbadi (instability) and inflation.
Reversal Warning: Bank of America (BoA), a big institution boss, is warning that Gold is facing "trend exhaustion," which could lead to a correction in Q4. Dhyan rakhna!
Technical Analysis & Clear Strategy Direction
The price got rejected straight at $4000, causing a small pullback. However, the overall trend is super strong. The safest strategy is to wait patiently for a BUY at specific support zones.
Priority Bias: BUY (Long) on Dips towards FVG (Fair Value Gap) zones to ride the main trend's momentum. Avoid unnecessary SELL attempts; if you must, use tight SL.
Key Price Levels:
Resistance: $4044, $4054, $4064
Support: $4018, $3999, $3986
Trading Strategy (Prioritize BUY on Dips)
BUY ZONE (FVG): $3994 - $3992
SL: $3984
TPs: $4002, $4012, $4022, $4032, $4042
SELL ZONE (High Risk): $4065 - $4067
SL: $4075
TPs: $4057, $4047, $4037, $4027, $4017
Do you trust BoA's warning, or do you think the FOMC Minutes will push us past $4050? Tell me your plan! 👇
#Gold #XAUUSD #4000USD #ATH #Fed #FOMC #TradingView #BUYDIPS #GoldFever

Gold 1H – Bulls Seek Re-Entry Before Fed Minutes💎 XAUUSD – Intraday Trading Plan | Ryan_TitanTrader
📈 Market Context
Gold extends its advance above $4,030 as traders position ahead of this week’s FOMC minutes and key U.S. inflation expectations data. The metal remains supported by persistent geopolitical risk and renewed central-bank demand, while Treasury yields hover near monthly lows.
However, sentiment is mixed after the IMF warned of slower global growth, keeping the dollar steady and prompting potential short-term corrections before continuation.
🔎 Technical Analysis (H1/H4)
Price structure shows a clean Break of Structure (BOS) to the upside following a higher-low formation. The market is currently reacting near premium liquidity at 4068–4066, where a rejection could trigger a retracement toward the discount buy zone at 3969–3971 before resuming the bullish leg.
🟢 Buy Zone: 3969–3971 (Discount Demand / FVG) – potential re-entry area for continuation buyers.
🔴 Sell Zone: 4068–4066 (Premium Liquidity) – possible engineered sweep zone for short-term sellers.
🔑 Key Levels
• BUY Zone: 3969–3971 (main support 3960)
• SELL Zone: 4068–4066 (liquidity pool)
• Psychological Resistance: 4070
• Intraday Pivot: 4035
💡 Trading Scenarios & Plan
🟢 BUY ZONE: 3969–3971
SL: 3960
TP: 3980 – 3990 – 4005 – 4020 – 4035+
🔴 SELL ZONE: 4068–4066
SL: 4075
TP: 4050 – 4035 – 4020 – 4000
⚠️ Risk Management Notes
Expect liquidity sweeps near 4068 before the U.S. session. Wait for lower-timeframe confirmation (ChoCH / BOS) before entry.
Volatility may spike around the Fed minutes, so partial profits and tight stop management are advised.
✅ Summary
Gold remains structurally bullish above 3960, with intraday retracements likely before continuation.
Ryan_TitanTrader anticipates buy reactions around 3970 and short-term rejections at 4068, aligning with the current SMC structure and macro catalysts ahead of FOMC updates.
🔔 Follow Ryan_TitanTrader for live setups, liquidity plays, and real-time gold structure updates!

XAUUSD- FUll Bullish momentDaily Full Bullish
4H- Structure full bulish
15M-15M FVG retracement
Entry-15M OB retracement

"Gold 'Buy the Dip' Opportunity Targeting the $4,000 Level"Technical Analysis
This is a classic bullish continuation setup. Here's a breakdown of the key elements:
Prevailing Trend: The chart shows a strong bullish impulse wave, indicated by the series of large green candles. This establishes the short-term trend as upward.
Corrective Pullback: After reaching a local high (around $3,980), the price is currently in a corrective phase, pulling back towards a potential support level. This is normal and healthy price action in an uptrend.
Support Zone: The red rectangle you've highlighted from approximately $3,950.00 to $3,956.00 is a well-defined area of potential support. This zone represents a previous level of consolidation and the base of the last major push upwards, making it a likely area for buyers to step back in.
Trade Idea: The projected path you have drawn suggests an expectation that the price will dip into this support zone, find buying pressure, and then continue its upward trajectory. This is often referred to as a "buy the dip" strategy.

Intraday Trading vs Swing TradingIntroduction
Brief overview of trading in financial markets.
Importance of choosing the right trading style for profitability and risk management.
Statement of purpose: Compare intraday trading and swing trading across multiple dimensions such as time horizon, risk, capital requirements, strategy, and psychology.
1. Understanding Intraday Trading
1.1 Definition
Buying and selling financial instruments within the same trading day.
Positions are squared off before the market closes.
1.2 Characteristics
Short-term focus (minutes to hours).
High trade frequency.
Requires constant market monitoring.
1.3 Tools & Techniques
Technical indicators: RSI, MACD, moving averages, Bollinger Bands.
Chart patterns: Flags, triangles, head & shoulders.
Level 2 data, real-time market depth.
1.4 Advantages
Potential for high profits in a single day.
No overnight risk exposure.
Quick capital turnover.
1.5 Disadvantages
High stress due to rapid decision-making.
Significant brokerage and transaction costs.
Requires advanced knowledge and quick reflexes.
2. Understanding Swing Trading
2.1 Definition
Holding positions for several days to weeks to capture medium-term price movements.
2.2 Characteristics
Medium-term focus.
Fewer trades but larger profit potential per trade.
Less time-intensive compared to intraday trading.
2.3 Tools & Techniques
Technical analysis: Trendlines, support/resistance, moving averages.
Fundamental analysis: Earnings reports, sector trends, macroeconomic indicators.
Swing patterns: Breakouts, pullbacks, reversals.
2.4 Advantages
Less stressful than intraday trading.
More time to analyze and make informed decisions.
Lower transaction costs due to fewer trades.
2.5 Disadvantages
Exposure to overnight and weekend risks.
Capital is tied up longer.
Requires patience and disciplined risk management.
3. Time Horizon and Trading Frequency
Intraday: Trades last minutes to hours; multiple trades daily.
Swing: Trades last days to weeks; limited trades but larger exposure.
Impact on lifestyle: Intraday requires active screen time; swing allows more flexibility.
4. Capital Requirements
Intraday: Leverage is often used; margin requirements are smaller but risk is higher.
Swing: Requires more capital per trade due to longer holding periods and lower leverage.
Risk of capital erosion: Intraday mistakes can wipe out a day’s gains; swing mistakes can impact several days of profit potential.
5. Risk and Reward Dynamics
Intraday: High volatility can yield high rewards but also steep losses.
Swing: Moderate volatility, potential for larger cumulative gains, but exposure to overnight gaps.
Risk management strategies: Stop-loss orders, position sizing, diversification.
6. Trading Psychology
Intraday:
Requires quick decision-making and mental resilience.
Emotional discipline is crucial; fear and greed can destroy profits quickly.
Swing:
Patience is essential to ride trends.
Ability to handle temporary drawdowns without panic-selling.
7. Strategy and Analysis
Intraday Trading Strategies:
Scalping: Quick small gains.
Momentum trading: Riding strong price trends within the day.
Swing Trading Strategies:
Trend-following: Entering trades along prevailing trends.
Reversal trading: Buying dips and selling rallies.
Technical vs fundamental analysis balance: Swing trading often incorporates both; intraday is heavily technical.
8. Costs and Tax Implications
Intraday:
Higher brokerage and STT due to frequent trades.
Short-term gains taxed differently depending on jurisdiction.
Swing:
Lower trading costs.
Gains may qualify for medium/long-term capital gains benefits.
9. Suitability for Different Traders
Intraday: Best for active, risk-tolerant, experienced traders with fast decision-making skills.
Swing: Suitable for part-time traders, working professionals, and those seeking less stressful trading.
10. Technology and Tools
Intraday: Real-time charts, high-speed internet, advanced trading platforms.
Swing: Standard charting tools, technical analysis software, news alerts.
Algorithmic trading: Both can benefit but intraday relies more heavily on automated systems.
11. Performance Metrics
Intraday:
Profit per trade is smaller but cumulative daily gains can be significant.
Key metrics: Win rate, risk-reward ratio, drawdown percentage.
Swing:
Profit per trade larger due to capturing trends.
Key metrics: Holding period returns, average gain/loss, volatility capture.
12. Case Studies
Example of successful intraday trades: High-volume stocks, news-based spikes.
Example of successful swing trades: Trend-following in indices or sectoral stocks.
Comparison of returns, drawdowns, and effort required.
13. Hybrid Approaches
Combining intraday scalping with swing trading to diversify income streams.
Portfolio allocation between short-term and medium-term trades.
Pros and cons of hybrid trading.
14. Choosing Your Style
Assess your risk tolerance, time availability, capital, and psychological comfort.
Test both styles using paper trading before committing real capital.
Flexibility and adaptation to changing market conditions.
15. Conclusion
Recap of key differences: time horizon, risk, rewards, strategies, tools.
Emphasis on personal suitability over “best style.”
Encouragement to practice disciplined trading, regardless of style.

Algorithmic AI Trading SystemIntroduction
Algorithmic AI trading systems are transforming the financial markets by combining the power of algorithms, artificial intelligence (AI), and big data to make trading more efficient, precise, and profitable. Traditional trading relied heavily on human intuition and manual execution, which was slower and prone to errors. In contrast, AI-powered trading systems leverage complex mathematical models, machine learning, and real-time data analysis to execute trades automatically, often outperforming human traders in speed and accuracy.
The integration of AI in algorithmic trading has become crucial for institutions, hedge funds, and retail traders seeking competitive advantages in highly volatile and liquid markets.
1. Understanding Algorithmic Trading
Algorithmic trading, often called algo-trading, uses predefined rules and mathematical models to execute trades automatically. These rules are designed based on market data such as price, volume, and timing. The main features include:
Speed: Algorithms can execute orders in milliseconds, capitalizing on short-lived market opportunities.
Accuracy: Reduces human errors in execution, ensuring trades occur exactly as planned.
Cost Efficiency: Automation lowers operational costs and reduces slippage in high-frequency trades.
Types of Algorithmic Trading Strategies
Trend-Following Algorithms: Identify and follow market trends to generate profits.
Mean Reversion Algorithms: Trade based on the assumption that prices will return to their historical average.
Statistical Arbitrage: Exploit price inefficiencies between correlated assets.
High-Frequency Trading (HFT): Leverages milliseconds-level execution speed for arbitrage or market making.
While these strategies are effective, AI enhances them by incorporating machine learning and predictive analytics to adapt to changing market conditions.
2. Role of Artificial Intelligence in Trading
Artificial intelligence brings adaptability, predictive power, and self-learning capabilities to algorithmic trading. AI in trading generally involves:
Machine Learning (ML): Algorithms learn from historical and real-time data to predict future price movements.
Natural Language Processing (NLP): Analyzes news, earnings reports, and social media sentiment to inform trades.
Deep Learning: Identifies complex non-linear patterns in market data that traditional models might miss.
AI Applications in Trading
Predictive Analytics: AI models forecast asset price movements and volatility based on historical data.
Sentiment Analysis: NLP models assess market sentiment from financial news, tweets, or analyst reports.
Risk Management: AI continuously monitors market exposure, portfolio risks, and liquidity constraints.
Trade Execution Optimization: Machine learning adjusts order execution to minimize slippage and transaction costs.
By combining AI with algorithms, trading systems move from rule-based automation to adaptive intelligence, enabling smarter and faster decision-making.
3. Architecture of an AI Trading System
A robust AI trading system typically consists of four key components:
Data Acquisition Layer:
Gathers structured (price, volume) and unstructured data (news, social media).
Sources include market feeds, APIs, historical databases, and alternative datasets like satellite imagery or economic indicators.
Data Processing & Feature Engineering:
Cleans, normalizes, and transforms raw data into meaningful inputs for AI models.
Feature engineering is critical to highlight relevant signals for price prediction.
AI Modeling Layer:
Machine learning models such as Random Forests, Gradient Boosting, or LSTM neural networks predict price movements or detect anomalies.
Reinforcement learning can be used to optimize trading strategies over time based on rewards and penalties.
Execution & Monitoring Layer:
Converts AI-generated signals into actionable trades using low-latency order execution engines.
Continuously monitors market conditions, system performance, and risk exposures.
4. Benefits of Algorithmic AI Trading
Speed and Efficiency: AI systems process vast datasets and execute trades far faster than humans.
24/7 Market Monitoring: AI can continuously monitor multiple markets without fatigue.
Data-Driven Decisions: Eliminates emotional bias from trading, relying on objective, statistical analysis.
Adaptive Strategies: Machine learning allows strategies to evolve with changing market dynamics.
Risk Minimization: Predictive models and real-time monitoring help prevent major losses.
5. Challenges and Risks
Despite its advantages, algorithmic AI trading comes with risks:
Overfitting: AI models trained on historical data may fail in live market conditions.
Market Impact: High-frequency trades may inadvertently affect market prices.
Data Quality Issues: Inaccurate or incomplete data can lead to wrong trading decisions.
Cybersecurity Risks: AI systems are vulnerable to hacking or manipulation.
Regulatory Compliance: Algorithmic and AI-driven trades are under strict regulatory scrutiny in many markets.
Traders must balance innovation with caution, ensuring robust risk management and compliance protocols.
6. Popular AI Trading Strategies
Reinforcement Learning for Portfolio Optimization:
AI agents learn to maximize portfolio returns while minimizing risk using reward-based learning.
Sentiment-Based Trading:
NLP algorithms analyze news and social media sentiment to predict price trends.
Algorithmic Arbitrage:
AI identifies temporary price discrepancies across exchanges for profit.
Predictive Modeling for Volatility:
AI forecasts market volatility, enabling traders to hedge positions effectively.
Hybrid Models:
Combines technical indicators, fundamental data, and sentiment analysis for holistic decision-making.
7. Case Studies and Real-World Applications
Hedge Funds and Investment Banks:
Firms like Renaissance Technologies and Goldman Sachs use AI-driven strategies to outperform traditional market approaches.
Retail Trading Platforms:
AI-powered trading bots for retail investors provide automated signal generation and trade execution.
Cryptocurrency Markets:
AI systems exploit the high volatility of crypto markets to generate consistent returns.
Alternative Data Utilization:
AI can analyze satellite imagery, weather data, or shipping patterns to predict commodity prices or stock movements.
8. The Future of AI in Trading
The AI trading landscape is evolving rapidly:
Explainable AI: Traders demand transparency in AI-driven decisions to trust automated systems.
Cross-Asset Integration: AI systems will increasingly manage multi-asset portfolios, including stocks, crypto, and derivatives.
Quantum Computing: May accelerate AI algorithms, enabling near-instantaneous market analysis.
Regulatory Evolution: Regulators are developing frameworks to monitor and manage AI-driven trading risks.
The future points toward AI-driven systems that are smarter, faster, more adaptive, and capable of operating across global markets seamlessly.
Conclusion
Algorithmic AI trading systems represent a paradigm shift in financial markets. By combining computational speed, adaptive intelligence, and vast data processing capabilities, these systems are setting new benchmarks for efficiency, profitability, and risk management. While challenges like overfitting, cybersecurity risks, and regulatory hurdles exist, the potential benefits for investors and institutions are immense.
AI in trading is not just about automation; it is about building systems that think, learn, and adapt—ushering in a new era where data-driven intelligence shapes the future of finance.
GOLD M30 – Bulls Defend $4,000, Eyes on 4,100+Gold’s historic surge above the $4,000 psychological barrier is now consolidating, with buyers defending the 3996$ support (Fibo 0.618 reaction). The structure remains bullish, while intraday traders are eyeing the next reaction zones for both continuation and scalp opportunities.
📊 Technical Levels to Watch (Fibo Matrix – M30)
3996$ Support Zone: Breakout retest + Fibo 0.618 → must-hold for bulls.
4018 – 4020: First intraday resistance, potential short-term reaction.
4043$: Expansion-based psychological barrier.
406x – 407x: Key SELL Reaction Zone (Fibo 1.5 – 1.618) → scalp rejection likely.
4095$+: Upper liquidity expansion, next major target if momentum extends.
🎯 Francis Trade Plan
✅ BUY Setup:
Entry: 3996 – 4000 zone.
Targets: 4018 → 4043 → 406x.
SL: Below 3984.
⚠️ SELL Setup (Short-term scalp only):
Entry: 406x – 407x reaction.
Targets: 4020 → 4000.
SL: Above 4096.
🔑 Francis View
The breakout at $4,000 signals strength, and bulls still dominate.
👉 Dips into 3996 support remain attractive BUY opportunities.
👉 Short-term scalpers can prepare for reaction SELLs around 406x – 407x.
📌 Bias: Bullish above $3996 – 4,100 zone remains the next liquidity magnet.

XAUUSD (Gold) Trading Ideathis is for educational purpose only
it clearly explains how to handle 2-point stop-loss and retry logic (max 3–4 times) for automation or manual trading
Wait for a green candle close above the 4088 level before entering.
Confirm the breakout with strong volume support.
The green line acts as your entry trigger zone.
Entry Level: 4088 (Green Line)
Exit Level: 4151 (Red Line)
Stop-Loss: 2 points
Max Attempts: 3–4 times per setup
The red line (4151) is the final exit target.
Keep a tight 2-point stop loss for controlled risk.
Rejection may happen 2–3 times near the entry zone — stay patient.
Avoid early entries before confirmation.
Watch for volume expansion during breakout candles.
Use 30-minute time frame for accuracy and clarity.
Once confirmed, ride the move toward the 100% level at 4117.
Partial profit booking is advised near 4117 zone.
Move SL to cost after price closes above 4100.
Avoid trading if candle closes below 4088 again.
The momentum remains bullish as long as price stays above 4088.
Red candle rejection below entry zone means wait again for setup.
Don’t chase enter only after a confirmed breakout.
Keep your chart clean and focus on price + volume behavior.
Plan your trade before execution , no impulsive entries.
Respect SL — discipline ensures long-term success.
Always analyze candle behavior near major levels before deciding.
Enter on candle close above 4088 with volume confirmation.
SL: 2 points below entry.
Targets: 4117 (first), 4151 (final).
Expect 2–3 rejections — wait for confirmation.

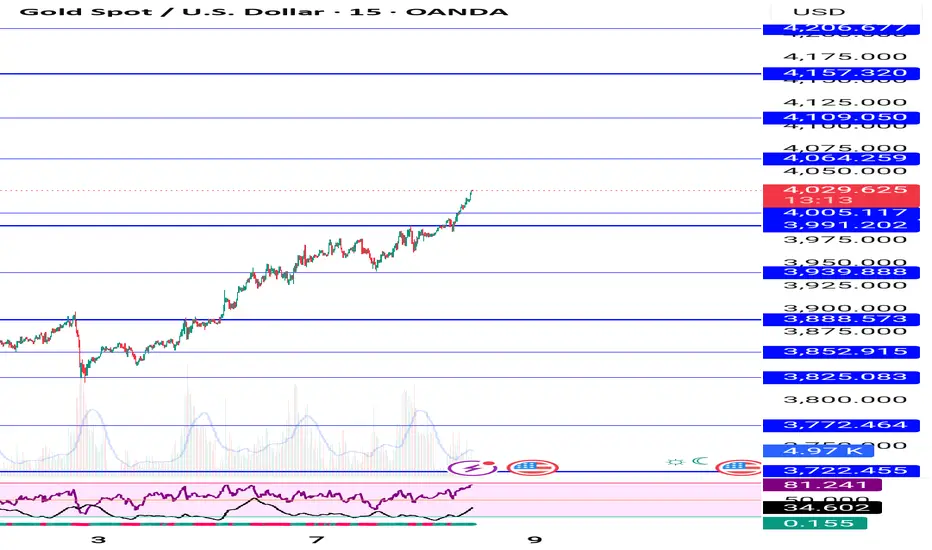
Gold 4000 $ upside target hit next target given on chart buy dipGood upside move will continue until US shutdown settlement news not come
How My Harmonic pattern projection Indicator work is explained below :
Recent High or Low :
D-0% is our recent low or high
Profit booking zone ( Early / Risky entry) : D 13.2% -D 16.1 % is
range if break them profit booking start on uptrend or downtrend but only profit booking, trend not changed
SL reversal zone (Safe entry ) : SL 23.1% and SL 25.5% is reversal zone if break then trend reverse and we can take reverse trade
Target : T1, T2, T3, T4 and .
Are our Target zone
Any Upside or downside level will activate only if break 1st level then 2nd will be active if break 2nd then 3rd will be active.
Total we have 7 important level which are support and resistance area
Until , 16% not break uptrend will continue if break then profit booking will start.
If break 25% then fresh downtrend will start then T1, T2,T3 will activate
1,3,5,10,15,20 minutes are short term levels.
30 minutes 60 minutes , 2 hours,3 hours, ... 1 day and 1 week chart positional and long term levels
XAUUSD – PRICE ABOVE $4000: ABSOLUTELY CRAZY FOR TRADERSXAUUSD – PRICE ABOVE $4000: ABSOLUTELY CRAZY FOR TRADERS
Gold has officially surpassed the $4000 mark, marking one of the most robust increases in recent history.
Let's take a look at the key price zones and short-term opportunities 👇
🔻 SELL Scenario
SELL 4025–4027 → SL 4033 → TP 4015 – 4000 – 3980
SELL 4042–4044 → SL 4049 → TP 4030 – 4015 – 4000 – 3980
🟩 BUY Scenario
BUY 3993–3995 → SL 3988 → TP 4005 – 4013 – 4023 – 4040
BUY 3980–3983 → SL 3975 → TP 3998 – 4005 – 4013 – 4023 – 4040
📈 Technical Analysis
The medium-term upward price channel continues to be stable.
Rising lows indicate that buying pressure remains very strong.
The nearest psychological resistance is around the 4043 zone, coinciding with the Fibonacci extension.
The expected buying zone is at the POC Volume Profile area — a high liquidity zone, once anticipated by many traders to reject gold prices, but now could become a strong demand zone.
🧭 Macroeconomic Perspective
If the Federal Reserve (Fed) continues to cut interest rates, the market may aim for the next milestone – 5000 USD/ounce.
Although short-term fluctuations may occur (such as temporary ceasefires in the Middle East or Ukraine), the core drivers of this trend remain unchanged:
US public debt is increasing
Central banks are diversifying foreign reserves
The USD is weakening
All of which support gold's medium-term upward trend.
⚡️Summary
Gold remains in a solid upward structure, even as it approaches overbought territory.
There might be strong corrections, but as long as the upward structure is maintained, buyers remain in control.

GOLD XAU/USD – Intraday Plan | Bulls Targeting 4,000$Gold has once again proven its safe-haven dominance, pushing close to 3,980$ during the Asian session. Despite USD fluctuations and global market risk-on vibes, buyers remain firmly in control. The psychological milestone of 4,000$ is now directly in focus.
🔎 Technical Snapshot (M30)
Trend remains bullish, supported by the Fibo channel.
Dip-buying pressure continues to dominate intraday price action.
Sellers will only gain short-term control near the 3988 – 4000$ resistance zone.
🔑 Key Trading Levels
BUY Zone (Fibo 0.618): 395x → Ideal intraday demand.
Support Zone: 393x → Must hold for bullish structure.
Immediate Resistance: 397x → Current ATH zone.
SELL Reaction Zone: 3988 – 4000$ → Potential short scalp.
Major Resistance: 4000 – 4006$ → Strong psychological wall.
📌 Trading Plan (FranCi$$ Style)
✅ BUY on Dips
Entry: 395x – 393x
Targets: 3975 → 3988 → 4000$
Stop Loss: Below 392x
⚡ SELL Scalp
Entry: 3988 – 4000$
Targets: 3970 → 3950$
Stop Loss: Above 4015$
🎯 Final Take
Gold’s path remains upward, but the 4000$ barrier is where bulls meet the biggest challenge. Smart traders will look to buy dips for continuation and use scalp sells only at strong rejection zones.
🔥 Stay tuned with FranCi$$ for realtime intraday updates – precision signals, scalping setups, and golden opportunities!

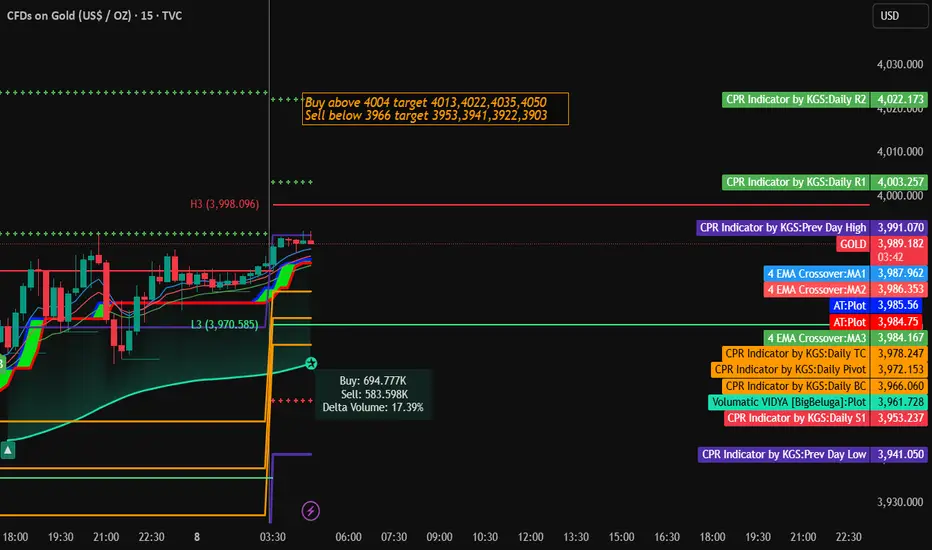
Gold Trading Strategy for 08th October 2025🟡 GOLD (XAUUSD) – INTRADAY TRADE SETUP 💰
📊 Strategy: Trade based on 5-Min Candle Breakout
🟢 BUY Setup
💵 Buy Above: High of 5-min candle closing above $4004
🎯 Targets:
1️⃣ $4013
2️⃣ $4022
3️⃣ $4035
4️⃣ $4050
🛡️ Stop Loss:
Place below the low of the previous 3 candles from the entry point.
🔴 SELL Setup
💵 Sell Below: Low of 5-min candle closing below $3966
🎯 Targets:
1️⃣ $3953
2️⃣ $3941
3️⃣ $3922
4️⃣ $3903
🛡️ Stop Loss:
Place above the high of the previous 3 candles from the entry point.
⚖️ Disclaimer:
📢 This setup is for educational and informational purposes only. It is not financial advice. Trading in Gold, Forex, or any commodity involves high risk. Please use proper risk management and consult your financial advisor before trading.
Gold 7th Oct 25 AMDClassical AMD pattern in Gold on 7th Oct. Asia accumulates, London manipulates (down) , New york distributes (up)

Robust Safe Haven Flow Sends Gold Flying to $3985Dollar Index shows resilience, climbs to 98.50
Geo political unrest boosts safe haven demand.
Gold extends bullish move to $3985
Immediate Support sits at $3955
Immediate Resistance sits at $3978
Gold continues to extend prevailing bullish streak setting new record high back to back with hardly any noticeable pullback as any retracement and dips are quickly being absorbed by buyers waiting for value buying on at bargain prices. Today's session has witnessed strong surge to new record high reaching $3985 and a pullback to $3969 while immediate hurdle $3988 caps recent gains in consolidation mode.
Fundamental drivers
Strong buying by central banks and record ETF flow boosting structural demand for the metal as safe haven asset as the world prepares to add more Gold to reserves to ward off dollar risks.
Geo political uncertainties across some European countries and Japan elections add to global concerns already on edge from Tariff woes.
Sticky inflation remains pivotal concern for Fed's interest rate decisions and Fed's hawkish or dovish tones will significantly impact further price action for Gold, Treasury bonds and Gold.
The US government shutdown continues with standoff in Congress adding tailwind to Gold.
Technical drivers
Gold is trading inside a broad ascending channel with strong bullish momentum where any pullback is quickly being absorbed and bought by buyers waiting to buy at value bargain. The bullish momentum is defying odds of overbought conditions and has been testing channel resistance where casual downward spikes only work to scare away weak longs enabling strong longs to see further gains and sustainability.
There has been multiple tests of channel mid line and lower boundaries attracting buying intervention again and again.
The current momentum is bullish supported by price stability above immediate support $3955 which if broken, exposes next downside zone $3938-$3935
The only major catalyst with potential for a strong downside correction is extremely overbought RSI reading of 90+ on monthly time frame which may witness a sizeable price correction in near term as these heights are prone to profit booking.
Overall outlook
Immediate rend remains bullish with strong momentum buying any pullback while heights are vulnerable to profit booking and correction.
Markets are adopting very cautious approach and short sellers are miserably trapped.

Gold (XAUUSD) 1D Chart Analysis – Buy/Sell Levels with TargetsGold is showing strong momentum after breaking important levels. Here’s a simple analysis with clear buy and sell points, target, and stop-loss guidance for traders. Perfect for intraday and positional trading.

Gold Near ₹4000, BofA Warns of Mid-Cycle Adjustment 📊 Market Context
Gold prices are inching closer to the ₹4,000/oz mark, but a fresh warning from Bank of America has made the market cautious. Strategist Paul Ciana notes that gold is over 20% above the MA200 – a level seen before sharp corrections in historical peak cycles (2008, 2011, 2020, 2022).
However, medium-term forecasts from Goldman Sachs, UBS, and even BofA still suggest that gold could reach ₹4200–₹4900/oz next year. This means the long-term upward trend is still intact – but the current phase is prone to unexpected corrections to shake off FOMO buying pressure.
🔎 Technical Analysis (H1/H4)
Prices are fluctuating near the ATH Zone and the crucial liquidity area around ₹3990–₹4000.
Buy Zones: ₹3935–₹3933 (CP zone & FVG reaction) offer an opportunity to accumulate orders.
Sell Zone: ₹3993–₹3995 (Liquidity Zone) – a liquidity trap is likely when prices approach the ₹4000 mark.
🔑 Key Levels
BUY Zones: ₹3935–₹3933, main support at ₹3910.
SELL Zone: ₹3993–₹3995, closely watch liquidity.
Psychological resistance: ₹4000.
📈 Scenario & Trading Plan
✅ BUY ZONE 1: ₹3935–₹3933
SL: ₹3927
TP: ₹3940 - ₹3945 - ₹3950 - ₹3960 - ₹3970 - ₹3980 - ???
✅ SELL ZONE: ₹3993–₹3995
SL: ₹4000
TP: ₹3988 - ₹3984 - ₹3980 - ₹3970 - ₹3960 - ???
⚠️ Risk Management Notes
The ₹3990–₹4000 area is extremely liquid – a peak sweep is likely before reversal.
Only enter trades with clear price action confirmation, avoid FOMO as prices near the psychological mark.
Adjust volume sensibly as volatility may be higher than usual with the market debating the risk of a “mid-cycle correction”.

Gold at $397x: Record High Reveals Double Top Pattern!Hello, traders!
Gold just hit a New Record High at $3,976.3/oz. However, immediately after, the market witnessed a clear structure break and the formation of a Double Top pattern in the European session. This strongly signals a shift in strategic priority.
Fundamentals & Bias Reversal
Core Drivers: Gold is up 50% YTD due to persistent Fed rate cut expectations (two more cuts projected) and severe global political instability (US Shutdown, France crisis, rising Japanese yields).
Technical Bias: We are now prioritizing SELL due to the confirmed Double Top and structure breakdown. Only consider BUYs at deeper support zones with controlled risk.
Key Price Levels:
Resistance: $3953, $3975, $3984, $4004
Support: $3942, $3931, $3910, $3899
Trading Strategy (Prioritize SELL):
SELL SCALP: $3957 - $3959
SL: $3963
TPs: $3953, $3948, $3943, $3938, $3933
SELL ZONE: $3975 - $3977
SL: $3985
TPs: $3967, $3957, $3947, $3937, $3927
BUY ZONE 1 (Wait): $3931 - $3929
SL: $3921
TPs: $3939, $3949, $3959, $3969, $3979
BUY ZONE 2 (Deeper): $3899 - $3897
SL: $3889
TPs: $3907, $3917, $3927, $3937, $3947
Will the Double Top send Gold back toward $3900? Let me know your thoughts! 👇
#Gold #XAUUSD #ATH #TechnicalAnalysis #DoubleTop #SELL #Fed #TradingView
viết bằng ngôn ngữ tiếng anh ấn độ phù hợp với nền tảng tradingview
Gold at $397x: Record High Reveals Double Top Pattern! Time to SELL? 🔥📉
Hello, traders!
Gold just hit a New Record High at $3,976.3/oz—paisa hi paisa! But hold your horses, boss. Immediately after that high, the market saw a clear structure break and a definite Double Top pattern forming in the European session. This is a big signal, suggesting a shift in strategic priority.
Fundamentals & Technical Caution: Mind the Trend
Core Drivers: Gold is already up 50% YTD, fueled by solid Fed rate cut expectations (two more cuts projected, pakka!). Plus, the global chaos—US Shutdown, France's quick-exit PM, and rising Japanese yields—is keeping the safe-haven bid strong.
Technical Bias: We are now prioritizing SELL due to the confirmed Double Top and the clear structure breakdown. Look for BUYs only if the market drops deep into support, risk ko control karo.
Key Price Levels:
Resistance: $3953, $3975, $3984, $4004
Support: $3942, $3931, $3910, $3899
Trading Strategy (Prioritize SELL):
SELL SCALP: $3957 - $3959
SL: $3963
TPs: $3953, $3948, $3943, $3938, $3933
SELL ZONE: $3975 - $3977
SL: $3985
TPs: $3967, $3957, $3947, $3937, $3927
BUY ZONE 1 (Wait): $3931 - $3929
SL: $3921
TPs: $3939, $3949, $3959, $3969, $3979
BUY ZONE 2 (Deeper): $3899 - $3897
SL: $3889
TPs: $3907, $3917, $3927, $3937, $3947
Will this Double Top be the beginning of a correction, or is $4000 still in the cards? Tell me your move! 👇
#Gold #XAUUSD #ATH #TechnicalAnalysis #DoubleTop #SELL #Fed #TradingView #MarketAnalysis

Sustainable Price Rise: Where’s the Next Optimal Entry?Hello TradingView community! 🚀
Gold (XAU/USD) is in an extremely sustainable upward structure. Instead of lengthy analysis, let's dive straight into the action plan: What is the optimal entry point and what target is Gold aiming for? Check out the details below.
1. Market Structure Analysis: The Strength of the Bulls 🐂
Looking at the chart, the first thing that catches our eye is a series of "BoS" (Break of Structure).
Every time Gold breaks an old peak, it not only creates a Higher High but also confirms that the upward trend is very strong and sustainable. This indicates that buying power is completely overwhelming and shows no sign of weakening. Smart Money is continuously pushing the price higher, and our job is to ride this "wave."
2. Potential Buying Zones - Where to Catch the Wave? 🧐
To optimize profits and minimize risks, finding a beautiful entry point after a price correction is extremely important. Based on the chart, we have 2 noteworthy potential buying zones:
Buying Zone 1 - Fibonacci Confluence ($3885): This is an extremely ideal "Buy Zone," coinciding with the golden Fibonacci ratio of 0.618. In technical analysis, this is a very strong support level, where prices often tend to reverse and continue the main trend. Professional traders always hunt for pullbacks to this zone.
Buying Zone 2 - Exploiting FVG ($3914 - $3933): Slightly higher, we have the FVG (Fair Value Gap) area at $3914 and the "Buy Scalping" zone at $3933. These are "price gaps" created by supply-demand imbalances when prices rise too quickly. The market tends to return to fill these gaps before continuing its journey. This could be an opportunity for those wanting to catch an earlier wave.
3. Target Conquest - What’s Gold’s Next Destination? 🎯
Once we have a buying position, where will our target be?
Short-term target: The "Sell Scalping FVG" zone around $3969 could be a minor resistance point where some traders will take profits.
Main target: The ultimate destination this structure is aiming for is the "Sell Gold Liquidity" zone at $3998. This is an important "liquidity" area, concentrating many stop-loss orders of the Sellers. Prices are often attracted to these zones like a "magnet" to sweep liquidity before making further moves.
Summary & Advice
Main trend: UP.
Primary strategy: Buy on dip when prices correct to important support zones.
Potential buying zones: $3885 (Fibonacci) and $3914 - $3933 (FVG).
Price targets: $3969 (short-term) and $3998 (main target).
Always remember, risk management is the key to surviving in the market. Set reasonable Stop-loss for all your trades.
WHAT DO YOU THINK ABOUT THIS PLAN?
Will Gold retrace to the Fibonacci zone $3885 or react right at the FVG zone $3914? Leave your opinions and perspectives in the comments below. We will discuss together to find the best opportunities!
👇 Don't forget to Like 👍 and Follow my TradingView channel to not miss daily Gold analyses!

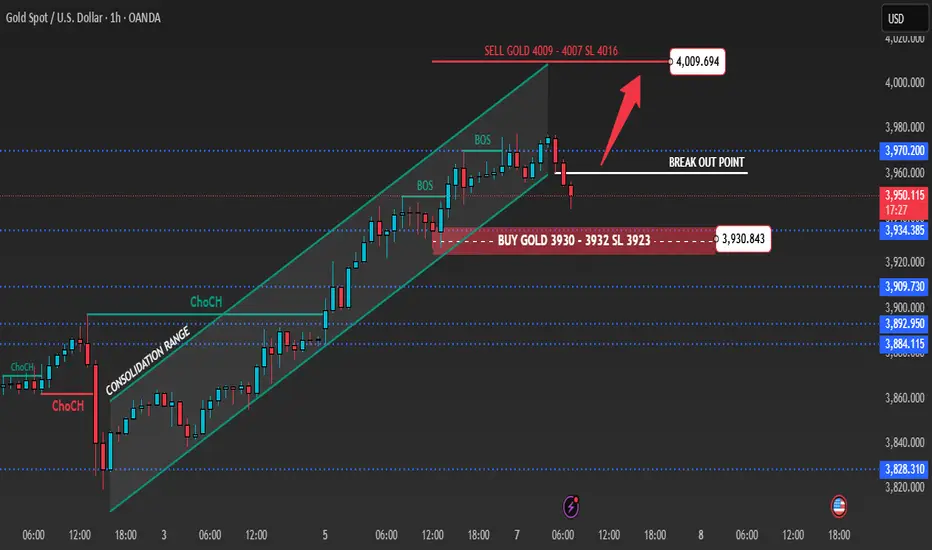
Gold 1H – Pullback Expected Before Key CPI Data💎 XAUUSD – Intraday Trading Plan | Ryan_TitanTrader
📈 Market Context
Gold is stabilizing below the $4,000 mark as traders await this week’s U.S. CPI data and fresh remarks from the Federal Reserve. After a strong multi-week rally, the metal is showing early exhaustion near premium liquidity zones, where engineered pullbacks often occur before continuation.
While the mid-term bias remains bullish, several analysts — including those from Citi and UBS — caution that gold could face short-term corrections if the dollar regains strength. The market continues to price in around a 65% probability of a December rate cut, keeping volatility elevated and sentiment uncertain.
🔎 Technical Analysis (H1/H4)
Price has slipped slightly below the ascending channel after consecutive BOS signals, indicating a potential short-term retracement before resuming the uptrend.
🟢 Buy Zone: 3932–3930 (Breakout & FVG zone) – an ideal discount area where buyers may re-enter the market.
🔴 Sell Zone: 4009–4007 (Premium liquidity) – a key region for short setups if price rejects strongly.
🔑 Key Levels
• BUY Zone: 3932–3930 (main support 3923)
• SELL Zone: 4009–4007 (liquidity reaction area)
• Psychological Resistance: 4000
💡 Trading Scenarios & Plan
🟢 BUY ZONE: 3932–3930
SL: 3923
TP: 3945 – 3955 – 3965 – 3975 – 3980+
🔴 SELL ZONE: 4009–4007
SL: 4016
TP: 3995 – 3980 – 3975 – 3965 – 3955
⚠️ Risk Management Notes
The 4000–4010 region acts as a high-liquidity magnet, where false breakouts and engineered sweeps may occur before reversals.
Wait for lower-timeframe confirmation (BOS or rejection candle) before entry.
Avoid overleveraging ahead of CPI — expect volatility spikes and rapid shifts in sentiment.
✅ Summary
Gold remains structurally bullish but vulnerable to intraday retracements near 4009–4007. Ryan_TitanTrader anticipates potential buy reactions from 3932–3930 and short-term rejections near 4009–4007. Holding above 3923 keeps the bullish outlook intact with upside targets toward 3970–3980.
🔔 Follow Ryan_TitanTrader for real-time updates, live setups, and advanced SMC insights as gold reacts to CPI data this week!
XAUUSD SHOWING A GOOD DOWN MOVE WITH 1:10 RISK REWARDXAUUSD SHOWING A GOOD DOWN MOVE WITH 1:10 RISK REWARD DUE TO THESE REASON
A. its following a rectangle pattern that stocked the marketwhich preventing the market to move any one direction now it trying to break the strong resistant lable
B. after the break of this rectangle it will boost the market potential for breakC. also its resisting from a strong neckline the neckline also got weeker ald the price is ready to break in the outer region
all of these reason are indicating the same thing its ready for breakout BREAKOUT trading are follws good risk reward
please dont use more than one percentage of your capitalfollow risk reward and tradeing rules that will help you to to become a bettertrader
thank you

AI Predicts Market Moves1. The Foundation: How AI Understands Market Behavior
AI predicts market movements by analyzing enormous amounts of structured and unstructured data. Unlike traditional models that rely on past prices and fixed formulas, AI adapts dynamically to changing market conditions.
Here’s how the process works:
Data Collection: AI systems gather information from multiple sources — stock prices, volumes, social media sentiment, macroeconomic indicators, corporate filings, and even satellite images.
Feature Engineering: Machine learning algorithms identify key features (price momentum, volatility, correlations) that may impact future movements.
Model Training: AI models, especially deep learning networks, are trained using historical data to learn patterns that precede bullish or bearish trends.
Prediction: The trained model predicts probable outcomes, such as price direction, volatility range, or breakout levels.
Feedback Loop: The system continuously learns from real-time data, refining its accuracy over time.
This self-learning nature makes AI a powerful force in financial prediction, as it becomes more accurate and efficient the longer it operates.
2. Machine Learning Models That Power Market Predictions
Several AI techniques are used to predict market movements. Each serves a unique role depending on the type of market data and the trading objective.
A. Supervised Learning
Supervised models are trained on labeled data (e.g., past price data with known outcomes). Common algorithms include:
Linear and Logistic Regression: Useful for basic price trend forecasts.
Random Forests and Gradient Boosting: Handle complex, nonlinear relationships between variables.
Support Vector Machines (SVM): Ideal for identifying trend reversals.
B. Unsupervised Learning
Unsupervised models detect hidden patterns without pre-labeled outcomes.
Clustering (e.g., K-means): Groups similar stocks or market behaviors.
Principal Component Analysis (PCA): Reduces data complexity to identify dominant market factors.
C. Deep Learning and Neural Networks
These models simulate how the human brain processes information.
Recurrent Neural Networks (RNNs) and LSTM (Long Short-Term Memory): Designed to analyze sequential data like time series, making them perfect for price prediction.
Convolutional Neural Networks (CNNs): Surprisingly effective for pattern recognition in candlestick charts or heatmaps.
Transformers (like those used in ChatGPT): Emerging models that can process multiple forms of data — text, numbers, sentiment — simultaneously for market insight.
D. Reinforcement Learning
In this model, AI acts as an agent that learns by taking actions and receiving feedback (reward or penalty). It’s widely used in algorithmic trading to optimize execution strategies or portfolio balancing.
3. Sentiment Analysis: Reading the Market’s Mood
The market is not purely mathematical — it’s emotional. Investor sentiment can drive markets up or down faster than fundamentals. AI sentiment analysis decodes these emotions from textual and social data sources.
Natural Language Processing (NLP) allows AI to read news articles, analyst reports, earnings calls, and social media posts.
By detecting tone and language, AI gauges whether market sentiment is bullish, bearish, or neutral.
Sentiment data is then quantified and fed into predictive models to anticipate short-term movements.
For example, a sudden surge in positive social media mentions about a stock may indicate upcoming bullish momentum. Conversely, a negative news trend could trigger an early warning for a price drop.
4. Big Data Meets AI: The New Market Edge
Market prediction used to depend primarily on numerical data — prices, volumes, and indicators. Today, AI uses big data to analyze patterns across multiple dimensions simultaneously.
Key data types AI analyzes include:
Price and Volume Data: Traditional market information.
Fundamental Data: Balance sheets, earnings reports, P/E ratios.
Macroeconomic Data: Inflation, interest rates, GDP growth.
Alternative Data: Satellite imagery (e.g., tracking retail traffic), credit card spending, or shipping volumes.
Behavioral Data: Search engine trends, social media posts, and online sentiment.
AI’s ability to merge these data types into a single predictive framework creates a far more holistic understanding of market dynamics — something human analysts can’t achieve manually.
5. High-Frequency Trading (HFT) and Predictive Algorithms
AI plays a crucial role in high-frequency trading, where thousands of trades occur in milliseconds. Here, even a microsecond advantage can yield significant profits.
AI systems in HFT:
Predict short-term price fluctuations based on market microstructures.
Execute trades automatically using reinforcement learning strategies.
Continuously adapt to new data and refine models to maintain a competitive edge.
For instance, if AI detects a sudden imbalance between buy and sell orders, it might predict a short-term breakout and place rapid-fire orders to capitalize on the move — all before human traders can react.
6. Predictive Portfolio Management and Risk Control
AI doesn’t just forecast prices; it predicts risk. Predictive portfolio models use AI to optimize allocations by analyzing correlations, volatility, and macroeconomic scenarios.
Predictive Asset Allocation: AI forecasts which assets are likely to outperform under certain conditions.
Dynamic Hedging: Machine learning models predict downside risk and automatically adjust hedges using derivatives.
Anomaly Detection: AI identifies abnormal price movements that may indicate fraud, manipulation, or systemic instability.
This predictive capability helps fund managers stay one step ahead of uncertainty, minimizing losses and enhancing long-term returns.
7. AI-Powered Tools Used by Traders
The global trading ecosystem now hosts numerous AI-based tools and platforms that help traders predict and react faster.
Examples include:
Bloomberg Terminal AI: Integrates NLP to summarize financial news instantly.
Kavout’s Kai Score: AI-driven stock ranking system.
Upstox and Zerodha (India): Implement algorithmic and data-driven recommendations powered by AI analytics.
AlphaSense: Scans millions of financial documents to detect sentiment and trends.
Even retail traders can now use AI-based trading bots that combine technical indicators, sentiment data, and reinforcement learning to generate predictive insights.
8. Limitations and Risks of AI Predictions
While AI has immense potential, it’s not infallible. Market predictions are inherently uncertain, and several challenges remain:
Black-Box Models: Deep learning models often lack transparency. Traders may not understand why a prediction was made.
Data Bias: If training data is skewed or incomplete, predictions may be inaccurate.
Overfitting: Models may perform well on past data but fail in new, unseen conditions.
Market Manipulation Risks: Predictive AI can be exploited by bad actors who manipulate data sources.
Flash Crashes: Rapid automated trading decisions can trigger sudden market collapses, as seen in past HFT incidents.
Thus, while AI enhances prediction power, it must be used responsibly, with human oversight and ethical guardrails.
9. The Human-AI Partnership in Trading
Despite automation, human intuition still matters. The most successful traders today combine AI-driven insights with human experience.
AI handles the data overload, filtering millions of variables into actionable signals.
Humans interpret context, political events, and macroeconomic nuances that models might miss.
Hybrid Strategies — where AI predicts and humans confirm — are proving to be the most effective approach for modern trading.
This collaboration ensures that traders harness the computational power of AI without losing the strategic foresight that only human judgment provides.
10. The Future of AI Market Predictions: What Lies Ahead
The next generation of AI in trading will go beyond prediction — it will move toward autonomous financial decision-making.
Emerging trends include:
Quantum AI Trading: Combining quantum computing with AI to handle even more complex datasets.
Generative AI Models: Creating simulated market scenarios for predictive testing.
Explainable AI (XAI): Making black-box models transparent so traders understand the “why” behind predictions.
Emotion AI: Measuring real-time trader sentiment through voice and facial analysis for behavioral prediction.
Global Integration: AI systems linking across markets — equities, commodities, forex, and crypto — for unified predictive analysis.
By 2030, it’s expected that over 70% of all trades globally will be AI-assisted or AI-driven, making machine intelligence the core of the financial ecosystem.
Conclusion: The Predictive Revolution in Trading
AI has evolved from being a buzzword to becoming the backbone of market prediction and trading. Its ability to process massive datasets, identify hidden correlations, and forecast potential moves with remarkable accuracy is transforming the very structure of financial markets.
Yet, while AI can predict patterns and probabilities, it cannot guarantee certainty — because markets are influenced by human behavior, policy shifts, and black swan events that defy logic.
The key lies in balance: leveraging AI’s speed, precision, and learning capability while maintaining human control and intuition. As AI continues to mature, those who adapt early — blending technology with insight — will dominate the next generation of global trading.

LiamTrading – Risk of correction before hitting the $4000 mark? LiamTrading – GOLD: Risk of correction before hitting the $4000 mark?
Hello everyone,
Gold is approaching the psychological price zone of $4000/oz, but before reaching this historic milestone, the market may be preparing for a short-term correction.
According to Bank of America's technical strategist – Paul Ciana, gold's upward momentum is “too hot,” and a mid-cycle correction could occur soon.
📉 Technical Analysis (Chart H1 – Wolfe Waves Formation)
Observing the chart, a Wolfe Waves pattern is clearly forming:
The Sell zone 3988–3990 is the convergence point of wave number 5 – a potential short-term reversal zone.
The Buy zone 3963–3965 is the retest point of local support, where sellers often tend to take short-term profits.
The Wolfe trend line indicates the possibility that the price will take liquidity above the peak zone before a corrective decline appears.
If a correction occurs, the 3940–3955 zone will be the first reaction area, where strong buying support is present.
🎯 Trading Scenario
Buy retest:
📍 3963–3965
🛑 SL: 3960
🎯 TP: 3972 – 3985 – 4000
Sell following Wolfe wave:
📍 3988–3990
🛑 SL: 3995
🎯 TP: 3972 – 3955 – 3945
🧭 Medium-term Outlook
Although the upward momentum remains dominant, the momentum is gradually decreasing and the market needs to “cool down” to create a new accumulation rhythm.
Dense liquidity zones around POC 3957–3960 may trigger a short-term pullback, before gold gains momentum to advance to the ATH zone of $4000 in the late-week sessions.
📌 Conclusion
Gold remains in a medium-term uptrend, but a short correction is necessary to maintain a sustainable upward structure.
Traders should prioritize flexible scalping, observing reactions at Fibo zones – Volume Profile – and especially the developing Wolfe Waves pattern.
I will continue to update the latest scenario details for XAUUSD daily.
👉 Follow me to not miss important wave rhythms!
