XAUUSD–Volume Profile buy scenario around 4,200, target 4,265+XAUUSD–Volume Profile buy scenario around 4,200, target 4,265+
Brian – Prioritize buying with the trend, use VAL to position entry
Market snapshot
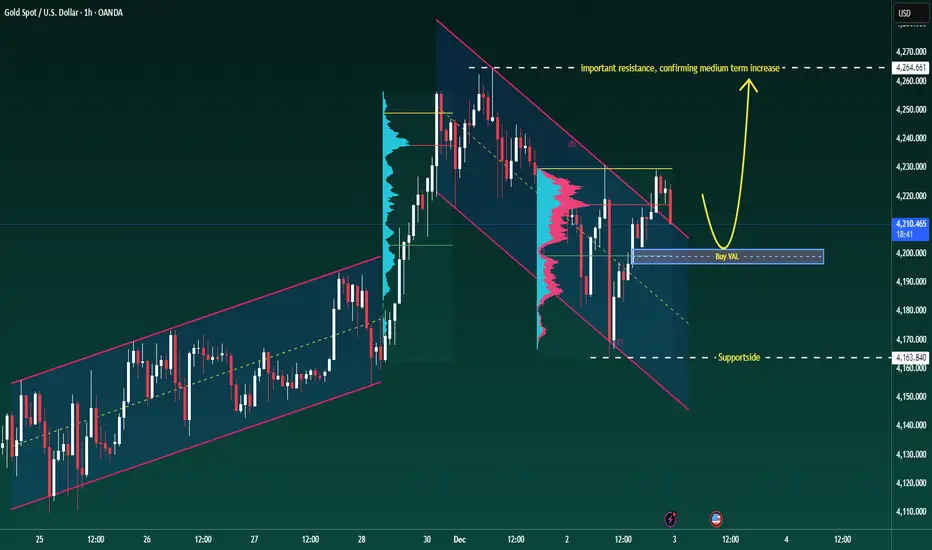
At the end of the US session yesterday, gold had a strong increase and then stabilized, currently moving sideways around 4,216 on H1.
The structure is still an uptrend, the current decline is mainly a technical correction within the value area.
On the chart, the 4,264–4,265 area is marked as important resistance, where if broken, the medium-term uptrend could be unleashed more strongly.
Volume Profile & key price areas
The VAL (Value Area Low) of the Volume Profile is currently around 4,200 – this is an area where the market has previously accepted a large volume of trades, suitable for trend-following buys.
A deeper support area is around 4,164 (Supportsides on the chart), where buyers have previously intervened very clearly.
Above: 4,265 – confirmed resistance, if broken will strengthen the scenario of gold heading to higher price areas, matching the "super cycle 5,000 USD" story in the long term.
Trading plan for next week (according to H1 & Volume Profile)
Priority scenario – Buy at VAL with the trend
Buying area: around 4,200 (VAL of Volume Profile).
Can flexibly range 4,198–4,203 depending on spread and market conditions.
Idea: wait for the price to pull back to the VAL area, observe H1 candle reactions (long lower tail, rejection candles...) before entering the order.
Immediate targets:
TP1: area 4,240–4,245
TP2: 4,265 – important resistance marked as "important resistance, confirming medium term increase".
If the price closes clearly above 4,265 and successfully retests, consider holding part of the position or finding additional entry points, according to the scenario of expanding to higher areas in the new cycle.
Defensive scenario – Deep support
If the 4,200 area does not hold, the 4,164 area will be the next support to watch.
Closing H1/D1 below 4,164 will be a signal to reduce short-term expectations and wait for a new structure instead of trying to "buy every dip".
Fundamental context – Reasons gold is still supported
Gold is heading for its best growth year since 1979, with an increase of over 60% in 2025 – this is the context of a true bull market, not just a recovery wave.
YTD performance of XAU outperforms BTC, showing that large capital flows prioritize stability and gold's safe haven role.
Current supporting factors: US bond yields cooling, USD weakening.
Geopolitical tensions escalating, Russia–US negotiations have not brought clear breakthroughs.
The market prices in nearly a 90% chance of the Fed cutting rates at the next meeting, making non-yielding assets like gold more attractive.
Follow Brian to share the Gold scenario together
Trade ideas
Gold Pullback to Bullish OB, Watch for Buy at 4,170–4,155⏰ Timeframe: 30 minutes
📅 Update: 12/02/2025
🔍 Market Context
After gold surged from the 4,115 USD area, the price peaked at 4,256 USD, then a small Bearish OB appeared around 4,223 USD (Fibo area 0.618–0.786) – where the market reacted with a slight decline.
Currently, the price is in a technical pullback phase after a long rally, forming a bearish CHoCH and a small BoS, indicating the market is rebalancing liquidity before deciding the next direction.
However, the main structure (H1–H4) still maintains a bullish bias, so the current adjustment area is only technical – suitable for observing buy opportunities from lower levels.
📊 Technical Breakdown
Bearish OB – Fibo Sell (4,223): short-term supply area, first reaction down after the peak of 4,256.
Small BoS (4,205): confirms the adjustment structure has formed.
Bullish Order Block (4,170–4,155): main demand area confluence with Fibo 0.786–1.0 – where strong buying force may reappear.
Extended target: 4,256 → 4,271 (FE 1.272–1.618) if the uptrend continues.
💎 Key Levels
🟢 Support (Buy Zones):
• 4,205 USD → short-term balance area, may react quickly.
• 4,170–4,155 USD → main Bullish OB area, confluence with Fibo 0.786–1.0 – ideal reaction point.
🔴 Resistance (Sell Zones):
• 4,223 USD → small Bearish OB – short-term supply area.
• 4,256 USD → main peak, short-term profit-taking area.
• 4,271 USD → extended target, upper liquidity area.
🎯 Trading Plan
Main Scenario – BUY SETUP (priority):
Wait for price to adjust to 4,170–4,155 USD.
Observe for bullish reversal signals (CHoCH, engulfing, long rejection).
Target increase: 4,223 → 4,256 → 4,271 USD.
Alternative Scenario – Deeper Sweep:
If price breaks 4,155, expect further liquidity test at 4,138–4,130 USD, before bouncing back.
🧠 Analyst’s View
Gold is following the “pullback in an uptrend structure” model.
As long as the price stays above 4,155 USD, the larger trend remains bullish.
The reasonable scenario is to watch for reactions at Bullish OB 4,170–4,155 – this is the area with the highest probability for the next recovery.
⚙️ Reaction Plan
BUY zone: 4,170 → 4,155
TP1: 4,223 TP2: 4,256 TP3: 4,271
Invalidation: M30 candle closes below 4,155
🛡️ Risk Note
Limit orders between the area (4,205–4,215).
Only confirm the trend with clear structural signals at the OB area.
Analysis is purely technical – not investment advice.

XAU/USD Bullish Continuation Setup Toward 4,223 After Liquidity 1. Market Structure
The chart highlights a COCH (Change of Character) followed by a BOS (Break of Structure), signaling a shift from bearish to bullish structure.
Several smaller coch points confirm internal bullish structure building.
2. Liquidity & POI Zones
There is a clear liquidity sweep near the PDL (Previous Day Low), where price dipped into a demand zone to collect orders.
An Extreme POI (Point of Interest) sits below current price — this acted as the strong reaction zone for the bullish move.
PDH (Previous Day High) is marked as an early short-term target/liquidity area.
3. Expected Move
The projection (zig-zag line) indicates bullish continuation after a pullback into the POI zone.
The target is marked around 4,223.629, matching the red horizontal resistance line.
The EMA (9) serves as dynamic support, showing price respecting the bullish trend.
4. Probability Outlook
As long as price stays above the trendline and POI, the bias remains bullish.
A break below the POI would invalidate the setup and open the lower liquidity region again.

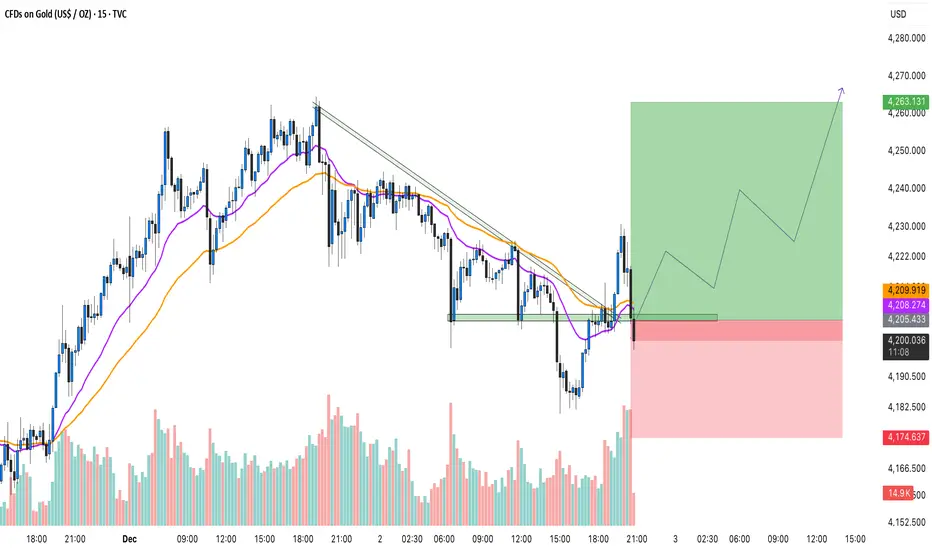
Gold Breaks Trendline – Bulls Back in Control!Hello Everyone let's analyse Gold as it has broken above its falling trendline resistance, signaling a possible shift from short-term weakness to bullish momentum. After several attempts, the price finally managed to close above the trendline with increasing volume, showing that buyers are stepping in again.
Currently, Gold is retesting the previous resistance turned support zone around $4200–$4205. As long as price holds above this level, the structure remains positive, and the next upside targets could be seen toward $4260–$4270.
Short-term traders can look for confirmation candles near support before entering. A clean retest followed by bullish continuation can offer a good risk–reward setup. On the other hand, if the price breaks back below $4190, momentum could slow down again.
Disclaimer: This analysis is for educational purposes only and should not be taken as financial advice. Please do your own research or consult your financial advisor before investing.
Analysis By @TraderRahulPal | More analysis & educational content on my profile.
If you found this helpful, don’t forget to like and follow for regular updates.
Gold Analysis and Trading Strategy | December 1✅ Last week, gold moved exactly as we anticipated and continued its strong upward trend.
On Friday, we repeatedly emphasized that the 4160–4165 zone was an excellent short-term buying opportunity and highlighted the core strategy of “buying on pullbacks.”
Gold then rallied strongly as expected, closing firmly near 4217, fully validating our trend outlook.
Despite the early closure of the U.S. market during Thanksgiving and the CME technical outage on Friday—which caused temporary liquidity issues and abnormal price fluctuations—the overall bullish rhythm remained intact. The essence of the strong trend did not change.
✅ 4H Chart Analysis
Gold has continued to rise steadily since rebounding from the 4020–4030 area.
Recent candles show multiple strong bullish bars, and the highs have successively broken above 4169 → 4182 → 4195, indicating continuously strengthening bullish momentum.
The latest large bullish candle has pierced the upper Bollinger band, clearly showing powerful upside momentum.
➡️ The 4H structure remains firmly bullish with no signs of a top forming.
Bollinger Bands:
The upper band is opening upward, showing a trending bullish move.
Price is riding along the upper band—a classic sign of a strong trend, where pullbacks are shallow and price tends to continue higher after brief consolidation.
✅ 1H Chart Analysis
The structure is clear: 4155 → 4170–4180 pullback → rally to 4226, forming a textbook bullish uptrend.
As long as 4155 is not broken, the trend is expected to continue toward the 4240–4250 zone.
Moving Averages:
MA5 and MA10 remain upward-sloping and close to price.
MA20 sits at 4188–4190, acting as the key short-term support.
A retest of MA20 should be viewed as a healthy pullback, not a reversal.
➡️ As long as price holds above MA20, the bullish trend will keep extending.
🔴 Resistance Levels: 4240–4245 / 4300
🟢 Support Levels: 4175–4180 / 4155
✅ Trading Strategy Reference
📌 1. Buy on Pullbacks (Main Strategy)
🟠Key buying zone: 4175–4180
🟠If price dips quickly but holds above 4175, consider entering long positions
🟠Strong buy zone: 4155–4160 (secondary long entry)
🎯 Targets: 4225 / 4240–4245
⛔ Stop-loss: below 4150
📌 2. Short on Rejections (Secondary Strategy)
🟠4245–4250 is a major resistance zone
🟠If price spikes into this area but shows rejection (long upper wicks or 1H bearish candle), consider light short positions
🎯 Targets: 4210 / 4185
⛔ Stop-loss: above 4255
✅ Summary
1️⃣ The market trend is bullish → support levels are rising → the uptrend is not finished
2️⃣ The 4H trend is strong, and the 1H chart is accelerating upward
3️⃣ 4155 is the key line — the “life line” of the bullish structure
✅ Key Levels to Watch Next Week
🔴 Upside: 4245–4250 — A break above this opens the path toward 4300
🟢 Downside: 4175–4180 — As long as this support holds, the bullish trend continues

Gold Analysis & Trading Strategy | December 5✅ 4H Chart Trend Analysis
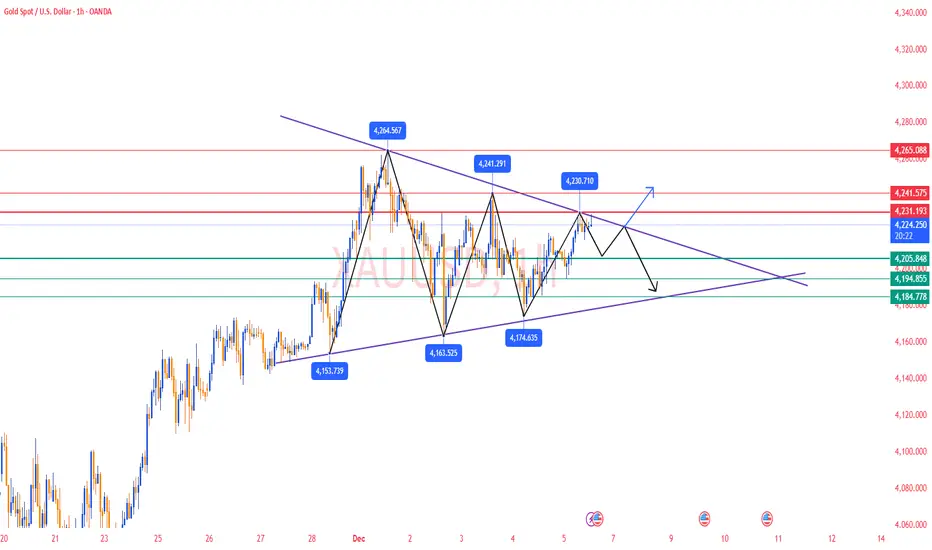
1️⃣ Lower rebound highs, weakening bullish momentum
Highs are stepping down from 4264.62 → 4241.55 → 4230, showing repeated rejection and forming an early descending high structure at the top.
2️⃣ Bollinger Middle Band as strong resistance
Current rebound is capped around 4227 mid-band
➡️ If price continues to fail breaking above → mid-term remains in consolidation
3️⃣ Moving averages indicate weak recovery
MA5 & MA10 are turning upward, but MA20 is flat
➡️ This suggests rebound = correction, not reversal
If price fails to break 4241–4245, strong bullish momentum will not be restored.
✅ 1H Chart Trend Analysis
1️⃣ Consecutive closes below 4227 with long upper shadows
➡ Bullish profit-taking at high levels
➡ Clear overhead selling pressure
2️⃣ Short-term MAs converging
MA5 / MA10 / MA20 are compressing together
➡ Momentum weakening → entering sideways consolidation
3️⃣ Bollinger Bands turning sideways
Price failing to ride the upper band → easy to shift into pullback mode
🔴 Resistance Levels :4227–4230 / 4240–4245
🟢 Support Levels:4205–4208 / 4185–4180
✅Trading Strategy Reference
🔰 Main Strategy: Sell the Rebound
📍Entry Zone: 4225–4230
🎯Targets: 4210 / 4195 / 4185
⛔Stop-loss: Above 4235
🔰 Secondary Strategy: Buy the Dip
📍If 4205–4208 holds, consider light longs
🎯Targets: 4220 / 4227
⛔Stop-loss: Below 4198
📌 Trend Summary
1️⃣ If 4205 breaks with strong selling volume → downside targets: 4188 / 4163
2️⃣ If price stabilizes above 4227 with bullish volume →
Bulls regain control → target 4245+
🎯 Key focus: Whether the 4205–4208 support zone remains intact
🔥Trading Reminder: Trading strategies are time-sensitive, and market conditions can change rapidly. Please adjust your trading plan based on real-time market conditions.
Price hits FVG: Get ready for Market Maker's next move!In the current market context, the price structure is clearly showing the regulation of Smart Money as it continuously creates new liquidity zones, breaks structures, and leaves important footprints like OB – FVG – BOS. Below is a trading plan built based on the observed price zones on the chart:
🟥 1. Market Context – Role of OB Sell
Price has reacted strongly at the Order Block Sell in the 4,237 – 4,256 zone.
This is where a strong push down occurred (accompanied by a structure break – BOS), confirming this as an active supply zone.
➡️ This will be the key level to monitor all pullbacks in the coming time.
🟩 2. Current Market Structure – Market Structure
After the OB Sell is activated, the market creates a bearish BOS.
Price is moving down to approach the Liquidity Buy below in the 4,154 – 4,161 zone.
On the way, price leaves a Fair Value Gap (FVG) – a zone that can be used as a retracement point to continue selling.
➡️ Overall bias: Bearish intraday – favor sell on pullback.
🟨 3. Main Trading Plan – SELL SETUP
🎯 Area of Interest
FVG: 4,197 – 4,214
This is the ideal price zone for price to return to balance before continuing the downtrend.
📌 Entry SELL:
Preferred scenario: Price retraces to fill FVG → reacts → creates a small bearish structure (BOS M1–M5) → Sell.
🎯 Targets:
TP1: 4,170 — intermediate support zone
TP2: Liquidity Buy: 4,154 – 4,161
TP3 (extended): 4,144 if liquidity below continues to be swept
🛑 Stop Loss:
Above the FVG peak or above the nearest OB zone: 4,214 – 4,227
➡️ High probability when price fails to break 4,214–4,227 and continues to create lower highs.
🟦 4. Secondary Scenario – SHORT-TERM BUY (Countertrend)
Only activated when price hits Liquidity Buy and a clear reversal signal appears:
📌 Entry BUY:
After sweeping liquidity in the 4,154–4,161 zone
Wait for bullish BOS confirmation on a lower timeframe
🎯 Targets:
4,184
4,197
4,214 (maximum – hit FVG and exit)
➡️ This is just a retracement trade, not trend-following, so risk management is crucial.
⭐ 5. Summary View
The market is moving in line with Smart Money behavior:
Sweep liquidity above (Sell-side Liquidity) → Create OB → Push price down
Leave FVG → Attract price back → Continue distribution
Main goal: Sweep Liquidity below
👉 The main trend remains SELL until the Liquidity Buy below is hit and a strong reversal structure is created.

Gold Analysis & Trading Strategy | December 1–2✅From the H4 structure, gold has maintained an overall bullish trend since rebounding from the 4020–4030 area. However, after reaching the recent high at 4264, price experienced a notable short-term pullback. The latest 4-hour candles show consecutive small bearish candles, indicating that bullish momentum has weakened at higher levels.
Bollinger Bands:
The upper band had previously opened upward, but price has now turned down from the upper band and entered a correction phase between the upper and middle bands. Price has not yet broken below the middle band (≈4185), suggesting that the medium-term bullish structure remains intact, although the strength has diminished.
Moving averages:
MA5 and MA10 have begun to form a bearish crossover, indicating short-term correction. MA20 (around 4189) is still sloping upward and serves as the key medium-term support.
✅From the 1-hour structure, price has continued to retreat after topping at 4264, breaking below MA5 and MA10. The current price (4236–4240) is hovering below MA20, showing that the short-term trend has shifted into a weak corrective phase.
Bollinger Bands:
The upper band has started to bend downward, indicating a weak consolidation at high levels. The lower band around 4218 suggests the risk of further short-term pullback.
The H1 pattern of "lower highs + lower lows" signals a small downward correction channel. As long as price does not break below 4200–4205 (the H4 pivot zone), the overall bullish trend will remain intact.
🔴 Resistance Levels: 4250–4256 / 4270–4275
🟢 Support Levels: 4220–4215 / 4175–4180
✅ Trading Strategy Reference:
🔰 Buy on Pullbacks (Main Strategy)
1️⃣ First buy zone: 4220–4215 (MA20 support)
2️⃣ Second buy zone: 4175–4180 (strong support)
🎯 Targets: 4250 / 4256 / 4270–4280
⛔ Stop-loss: below 4170
🔰 Short on Rejections (Secondary Strategy)
1️⃣ First sell zone: 4255–4265
2️⃣ Second sell zone: 4270–4275
If the price reaches these zones and shows:
▪ Long upper wicks
▪ OR a 1H bearish reversal candle
Light short positions may be considered.
🎯 Targets: 4230 / 4220
📌 Conclusion: Bullish Trend Intact — Short-term Consolidation, but Still Looking Upward
1️⃣ H4 bullish structure intact → Bollinger Band expansion → uptrend not finished
2️⃣ H1 acceleration → mild pullback is normal digestion
3️⃣ 4220 (H1 key support) = the short-term bullish lifeline.
4️⃣ As long as 4175–4180 holds, the trend continues toward 4270–4280, and a strong breakout may lead to 4300.
🔥Trading Reminder: Trading strategies are time-sensitive, and market conditions can change rapidly. Please adjust your trading plan based on real-time market conditions.

Gold Trading Strategy for 02nd December 2025✨ 🟡 GOLD INTRADAY TRADE LEVELS (Price in $ / XAUUSD)
🟢 BUY SETUP (Bullish Bias)
📌 Plan to buy only if price confirms strength.
🔼 Buy Trigger:
Buy above the high of the 1-Hour candle
Confirmation required: 1H candle must close above $4265
🎯 Targets:
TP1 → $4277
TP2 → $4288
TP3 → $4299
🛡️ Suggested Stop-Loss:
Below the breakout candle low or structure support
(Keep SL tight if volatility increases.)
📈 Trade Logic (Detailed):
A 1-hour close above $4265 indicates strong bullish momentum and institutional participation.
Breaking the high with follow-through suggests buyers are in control.
Targets are spaced with increasing distance to capture both short bursts and extended runs.
Ideal for trend continuation setups and breakout traders.
🔴 SELL SETUP (Bearish Bias)
📌 Plan to sell only if bearish pressure is confirmed.
🔽 Sell Trigger:
Sell below the low of the 30-Minute candle
Confirmation required: 30-min candle must close below $4203
🎯 Targets:
TP1 → $4190
TP2 → $4180
TP3 → $4170
🛡️ Suggested Stop-Loss:
Above the breakdown candle high or nearest resistance
(Avoid entering early; wait for candle close.)
📉 Trade Logic (Detailed):
A 30-minute close below $4203 signals short-term weakness and entry of aggressive sellers.
Breaching the low indicates loss of intraday support.
Targets are designed to capture momentum drops and liquidity hunts toward lower zones.
Best for momentum scalpers and short-term swing traders.
✳️ TRADE MANAGEMENT TIPS
🕒 Avoid entering in the middle of big candles — wait for retest or cleaner structure.
🎚️ Position sizing is crucial — keep risk per trade under 1–2%.
📊 Always monitor major news (CPI, NFP, FOMC) when trading GOLD.
🔁 Trail stop-loss after each target hit for safer exits.
⚠️ DISCLAIMER
This is not financial advice.
Trading gold, forex, and commodities involves high risk.
Always do your own analysis, use proper risk management, and trade only with money you can afford to lose.
Past performance is not indicative of future results.

XAUUSD - GOLD - Trying to catch TOP is like chasing your crush# Here are the key factors currently supporting gold:
Momentum remains bullish:
#GOLD has gained as markets increasingly price in a potential Federal Reserve interest rate cut.
Gold continues to be regarded as a safe-haven and hedge asset. Amid economic uncertainty, inflation concerns, geopolitical risks, and sustained demand from central banks and investors, gold retains its primary drivers.
# Here are the key technical levels to watch over the next month:
According to recent chart data:
The immediate support region is approximately $4,110–$4,010, which serves as a pivot zone. A break below this level could lead to further downside toward $3,817–$3,683.
On the upside, a breakout above $4,282–$4,325 could pave the way for a move toward $4,450–$4,550.
Target-6
If the current bullish momentum persists and supportive fundamental conditions remain in place, gold may target the level marked as 6 on the chart.
#Here are the factors most likely to influence the movement of XAU/USD in the near future:
1. U.S. interest rates and Federal Reserve policy.
2. U.S. economic data and inflation figures.
3. Strength or weakness of the U.S. dollar: Since gold is priced in U.S. dollars, a weaker dollar typically supports higher gold prices.
4. Geopolitical risk and global uncertainty: Global instability, trade tensions, or major macroeconomic concerns often drive investors toward gold as a safe-haven asset.
Conclusion
Gold will remain strong as long as key support levels hold and market sentiment remains favorable. With momentum in its favor, any dips are likely to present buying opportunities, while a clean breakout could initiate the next leg higher.
~ Disclaimer ~
High Risk Investment
Trading or investing in assets like crypto, equity, or commodities carries high risk and may not suit all investors.
Analysis on this channel uses recent technical data and market sentiment from web sources for informational and educational purposes only, not financial advice. Trading involves high risks, and past performance does not guarantee future results. Always conduct your own research or consult a SEBI-registered advisor before investing or trading.
This channel, Render With Me, is not responsible for any financial loss arising directly or indirectly from using or relying on this information.

Gold Trading Strategy for 01st December 2025📈 GOLD Intraday Trading Plan
🟢 BUY Setup (Long Position)
Entry Trigger: Buy above the high of the 15-minute candle after a confirmed close above $4248.
Reasoning: A breakout above 4248 on a lower timeframe signals bullish momentum and continuation strength.
🎯 Targets for LONG
Target 1: $4260
Target 2: $4276
Target 3: $4290
🛡️ Suggested Stop-Loss (SL)
Place SL below the breakout candle low or follow your risk management rules.
📉 SELL Setup (Short Position)
Entry Trigger: Sell below the low of the 1-hour candle after a confirmed close below $4196.
Reasoning: A breakdown on a higher timeframe confirms stronger bearish pressure.
🎯 Targets for SHORT
Target 1: $4183
Target 2: $4170
Target 3: $4155
🛡️ Suggested Stop-Loss (SL)
Place SL above the breakdown candle high or align with your risk tolerance.
📊 Risk Management Tips
Use 1–2% maximum risk per trade.
Avoid trading during major news events unless you’re experienced.
Always wait for candle close confirmations (VERY important).
Scale out partial profits at each target for balanced gains.
⚠️ Disclaimer
This analysis is for educational and informational purposes only. It is not financial advice or a recommendation to buy or sell any asset. Trading in gold and financial markets involves high risk, and you should assess your own risk tolerance and consult a professional financial advisor if needed.

SMC TRADING PLAN – XAUUSD (1H)1. Market Context
Observing the chart shows:
The price is moving in a short-term downtrend, indicated by the downtrend line that has been tested multiple times but not decisively broken.
Twice the price touched the trendline, it created a strong reaction → confirming this as a dynamic resistance zone.
The market has created MSS (Market Structure Shift) at both the top and bottom → indicating a transition phase, suitable for scalping trades at reaction zones.
The price levels you marked (4,230 – 4,219 – 4,192 – 4,181) are indeed potential liquidity pools / order blocks.
2. Main Trend & Smart Money Intentions
✔ What is Smart Money doing?
Attracting liquidity below around the 4,158 – 4,160 area (noted as “Liquidity” on the chart).
Pushing the price up to retest resistance around the trendline to hunt the liquidity of the Long side at the top.
Then bringing the price to a deeper discount area → then deciding to push up to break or continue distributing.
That is: Short-term Buy – Short-term Sell – then stronger Buy at the liquidity bottom
→ This is the standard Liquidity Hunt – MSS – Reversal model in SMC.
3. Two Main Scenarios
Scenario 1 – SELL from resistance (priority)
The price is approaching the trendline and resistance area you marked. This is a high-probability setup.
Ideal SELL zone:
📍 4,219 – 4,221 (reaction zone + FVG + Trendline retest)
Scalping target:
TP1 → 4,192
TP2 → 4,181
If a strong break: extend to 4,160 – 4,158 (main liquidity area)
Stoploss: 4,230.7 (above the liquidity sweep area)
Reason for SELL
Touching the downtrend line → strong technical reaction.
This is the Premium zone of the upward move.
Likely to form a short-term distribution before pushing down to hunt liquidity.
Scenario 2 – BUY from liquidity zone (secondary priority)
If the price dives down to take liquidity first, prioritize Buy at the bottom zone.
Strong BUY zone (Liquidity Zone):
📍 4,160 – 4,158
→ This is the bottom marked by Smart Money to hunt stoploss & create a new bottom.
Target:
TP1 → 4,181
TP2 → 4,192
TP3 → 4,219 – 4,230 (expecting to push the price to take top liquidity)
Stoploss: 4,146
Reason for BUY
Clear liquidity zone, created by the previous low bottom.
Coincides with the lower trendline.
Two previous MSS indicate the market is in an accumulation phase for a short-term reversal.
4. Detailed Trading Plan
🎯 SELL Setup – Quick Scalp (priority)
Entry: 4,219 – 4,221
SL: 4,230
TP:
TP1: 4,192
TP2: 4,181
TP3: 4,160 (if price breaks down)
High probability because: trendline reaction + premium zone + liquidity build-up.
🎯 BUY Setup – Safe (wait for price to hunt down)
Entry: 4,160 – 4,158
SL: 4,146
TP:
TP1: 4,181
TP2: 4,192
TP3: 4,219 – 4,230
High probability because: main liquidity zone + discount zone + potential for smart money to push up from the bottom.
5. Trading Advice
Only take orders when there is a clear reaction: wick rejection, minor structure break on M5.
Do not enter orders in the middle of the zone – only trade when the price hits the key level.
Scalping should prioritize quick TP because gold's range is quite strong.
📌 Conclusion
Your chart gives very clear signals according to SMC:
SELL at Premium – Buy at Discount – all revolving around liquidity hunt & MSS.
Two trading zones have been extremely clearly identified:
✔ SELL Zone: 4,219 – 4,221
✔ BUY Zone: 4,160 – 4,158

XAUUSD – Clean Rejection from LTF Demand With Potential Upside EGold tapped into a refined LTF demand pocket and instantly showed rejection, indicating buyers are stepping in exactly where they should. This aligns well with the ongoing HTF bullish bias and maintains the broader structure intact.
The strong wick + immediate reclaim of the micro-range suggests absorption and willingness to push higher if structure follows through.
Bullish Path:
• Tap into LTF demand
• Rejection + recovery inside the zone
• Micro structure shift
• Expansion toward the next HTF imbalance

XAU/USD – Waiting for 4,203 Retest Before the Next Bullish Leg(MMF Intraday Plan – Dec 03)
Gold continues to recover after last week’s deep drop, but the current bullish momentum is still weak and needs a liquidity sweep + clean pullback before pushing higher.
On the M30–H1 structure, price is still moving below the descending trendline, suggesting that Gold may need a deeper retest into the 4,203 demand zone—the key area where:
✔️ Fibo 0.618 of the latest impulse
✔️ Previous demand that created strong bullish displacement
✔️ Liquidity resting below the recent short-term lows
✔️ The higher-low (HL) structure of the bullish wave
Once this zone holds, Gold is positioned for the next expansion upward.
🧭 Primary Scenario – MMF BUY Setup
BUY Zone: 4,203 – 4,205
Stop-Loss: below 4,197
TP1: 4,230
TP2: 4,242 (major target – supply zone + Fibo 1.272)
If price breaks above 4,242 with momentum → next bullish extension targets 4,249–4,252.
⚠️ Secondary Scenario (Scalp SELL only)
Short-term scalp, not part of the main trend plan:
SELL Reaction Zone: 4,230 – 4,232
Stop-Loss: 4,236
TP: 4,215
Use this only as a quick reaction trade while the trend waits for confirmation.
📌 Daily Bias Summary
Intraday bias remains BULLISH while price holds above 4,197.
Best setup today: wait for a clean pullback into 4,203 for the main BUY.
Expect volatility during NY session due to upcoming data → manage positions carefully.

Premium Chart Patterns 1. Identify overall trend
Use BOS and CHoCH to read trend direction.
2. Mark premium and discount zones
Use Fibo 0.50 or volume profile to find optimal buy/sell zones.
3. Look for liquidity pools
Check where:
Retail stop losses are
False breakouts may occur
4. Wait for sweep or fake breakout
This is the strongest confirmation that institutions are active.
5. Mark order blocks & fair value gaps
These become entry and target zones.
6. Enter on retest
Never jump in early—wait for retest of order block, FVG, or structure.
7. Manage risk tightly
Premium patterns give small stop-loss and large RR opportunities.

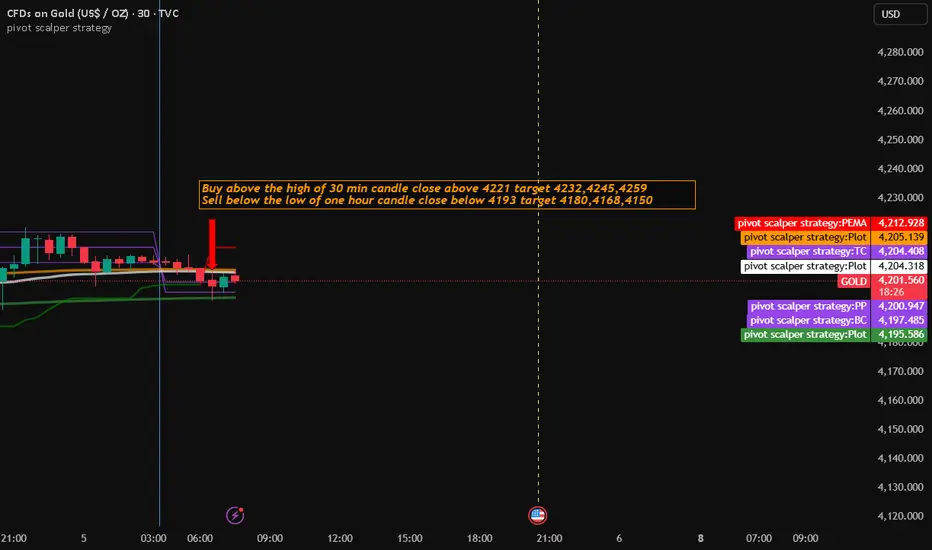
Gold Trading Strategy for 05th Deceber 2025📈 GOLD INTRADAY TRADE SETUP
✅ BUY SETUP (Long Trade)
🔔 Entry Condition:
Enter Buy above the high of the 30-minute candle
Candle must close above $4221
After a strong bullish close, look for continuation momentum.
🎯 Targets:
TP1: $4232
TP2: $4245
TP3: $4259
🛡 Stop-Loss Suggestion:
Below the breakout candle low (or 10–15 points below 4221 based on volatility).
📌 Notes:
Prefer breakout with volume.
Avoid entries during high-impact news volatility unless you're experienced.
Watch for rejection at resistance levels around 4232/4245.
📉 SELL SETUP (Short Trade)
🔔 Entry Condition:
Enter Sell below the low of the 1-hour candle
Candle must close below $4193
🎯 Targets:
TP1: $4180
TP2: $4168
TP3: $4150
🛡 Stop-Loss Suggestion:
Above the breakdown candle high (or 10–15 points above 4193 depending on market structure).
📌 Notes:
Prefer clean breakdowns—not wicks.
Confirm bearish structure on 15m/30m for safer entries.
Be cautious near support zones at 4180 and 4168.
⚠️ DISCLAIMER
📜 This analysis is for educational and informational purposes only.
💰 Trading Gold/Commodities involves high financial risk.
📉 Past performance does not guarantee future results.
🧠 Always use proper risk management, position sizing, and stop-loss.
👤 You are solely responsible for your trading decisions.
XAUUSD –| watch reaction at POC – VAL – VAH according to VolumeXAUUSD – Brian | watch reaction at POC – VAL – VAH according to Volume Profile
1. Market snapshot
Gold is entering a redistribution phase in the high price range, with fluctuations mainly revolving around large volume clusters on the Volume Profile. In this context, Brian's current priority scenario is to watch for a Sell when the price approaches the POC / VAL / VAH areas – where the market previously traded heavily.
2. Volume Profile – Notable price areas
POC – VAH area 4.217 is the price area where buyers/sellers previously "struggled" strongly, suitable for looking for sell signals if there is a rejection reaction.
VAL & the support area below around 4.134 is where short-term buying force may appear, suitable for a technical rebound buy scenario.
3. Trading plan (this week)
Scenario 1 – Sell according to Volume Profile (priority)
Sell: 4.217
SL: 4.125
TP: 4.200 – 4.182 – 4.150
Idea: wait for the price to rebound to the POC/VAH area around 4.217, observe the H1/M30 candle reaction. If a clear rejection signal appears (long upper tail, reversal candle...), the sell order can be activated according to the plan.
Scenario 2 – Short buy at VAL/support area
Buy: 4.134
SL: 4.125
TP: 4.155 – 4.180 – 4.200
Idea: if the price adjusts deeply near the VAL area and holds above 4.125, a technical rebound may occur. This is a short buy, not going too far against the trend, prioritizing partial profit-taking when the price returns to the upper POC area.
4. News to watch – Unemployment Claims
Today there are US Unemployment Claims figures, which are quite sensitive data for gold because:
The market will assess the strength/weakness of the US labor market.
Worse-than-expected figures → increase the likelihood of Fed easing → positive for gold.
Better-than-expected figures → support USD, may cause gold to face adjustment pressure.
Therefore, it is advisable to limit new orders close to the news release time, wait for the post-news candle to stabilize, and then reassess the structure.
5. Risk management (user-friendly for phone users)
Sell is the priority scenario but do not overlook SL 4.125, to avoid the case of a strong breakout above the current volume cluster.
With the Buy 4.134 scenario, it is advisable to split TP, move SL to breakeven when the price hits TP1 to reduce the pressure of having to "watch the chart" continuously on the phone.
If D1/H4 closes below the 4.125 area with large volume, Brian will consider it a signal to reduce short-term buying expectations and wait for a clearer new structure.

Key-Resistance Liquidity Grab → FVG ShortIdea:
Price has reached a key resistance zone — a common place where smart money or institutions may hunt liquidity (stop-losses above resistance before reversing).
There is an unfilled Fair Value Gap (FVG) / imbalance zone drawn below (green “POI / FVG” zone). In price-action trading, these FVGs often act like magnets: after a rapid move, price tends to retrace and “fill” the gap.
The plan: wait for a rejection at resistance (signaling liquidity grab is done), then short — target the FVG/POI zone where the market may come back to fill imbalance.
🎯 Trade Plan (Entry / Exit / Risk-Reward)
Parameter Plan
Entry After a bearish rejection (e.g. long upper-wick candle) near the resistance zone.
Stop-Loss Slightly above the resistance / recent swing high (to avoid being stopped by a false breakout).
Take-Profit (TP) Around / within the FVG / POI zone (green zone on chart) — where imbalance may be filled.
Risk–Reward Aim for at least 1 : 2 — ideally more, depending on how far the FVG is below resistance.
⚠️ What Makes This Setup Valid (and What to Watch)
FVGs mark market inefficiencies / liquidity gaps created by rapid moves, which often get revisited.
A reversal or rejection at a well-defined resistance zone gives signal that the liquidity hunt may be done and a move downward may begin.
But — if price breaks cleanly and strongly above the resistance (with momentum), the short trade becomes invalid.
Also, FVGs don’t always get filled. Entry should ideally wait for a clear rejection or confirmation, not just assume a fill.

Why Gold Hits Your SL🌟 Why Gold Hits Your SL 😭💛📈
Gold is one of the most aggressive and volatile assets in the market — and if you’ve ever wondered “Why does gold ALWAYS hit my stop-loss before moving in my direction?”, this post explains the real reason.
Let’s break it down clearly 👇
🔶 1. Gold Loves Liquidity — Not Levels 💦💰
Gold doesn’t move based on your support/resistance lines.
It moves based on liquidity, meaning:
Where traders place stop-losses ❌
Where pending orders sit 🎯
Where large institutions want to fill positions 🏦
Your SL is simply sitting where everyone else puts theirs, which makes it prime liquidity.
🔶 2. XAUUSD Spikes Are Designed to Collect Orders ⚡💥
Gold often creates sudden:
Wicks
Fake breakouts
Quick pumps or dumps
Sharp candle spikes
These moves are NOT random — they’re engineered to:
🔸 Trigger stop-losses
🔸 Activate pending buy/sell orders
🔸 Grab liquidity before the real move
This is why your SL gets hit by $1–$3 before price completely reverses.
🔶 3. Gold Moves Session-by-Session 🕒🌍
Gold behaves differently depending on the time of day:
Asia session → Slow, tight range
London session → First big manipulation
New York session → Volatility explosion + real direction
Most SL hunts take place when London opens or when NY session begins ⚠️🔥
🔶 4. Clean Highs & Lows = SL Magnets 🧲📌
Gold LOVES attacking:
Previous day’s high/low
Asian range high/low
London session extremes
Double tops & bottoms
Round numbers (like 4000 / 4050 / 4100)
These areas hold thousands of stop-losses.
So before gold takes a real direction — it sweeps them first. 🏹😈
🔶 5. The Classic Gold Pattern: Trap → Reversal → Expansion 🔁🚀
Most XAUUSD moves follow this sequence:
1️⃣ Sweep liquidity 😭
2️⃣ Fake breakout 😈
3️⃣ Sharp rejection 👋
4️⃣ Real trend begins 🚀
If you’ve ever seen price:
Break a level
Wick hard
Then reverse the entire move
That’s gold performing a liquidity grab.
🔶 6. How To Avoid Getting Stopped Out ✔️
Here’s what actually helps:
🌟 A. Don’t put SL exactly at obvious levels
Move it beyond common liquidity zones.
🌟 B. Wait for the sweep before entering
Let gold perform the trap first.
🌟 C. Trade reaction — not prediction
Look for re-entry after the wick forms.
🌟 D. Use sessions to your advantage
Avoid placing SL right before London/NY opens.
🌟 Final Words
Gold isn’t hunting you —
it’s hunting liquidity.
Your job is simple:
👉 Stop placing stops where everyone else does
👉 Let gold sweep liquidity first
👉 Then catch the real move
Trade smarter, not tighter. 💛⚡

Weekly Gold analysis & 8R scenarioLast week gold closed positively with a strong candle showing positivity and approaching to a strong 4H FVG nested inside weekly quadrant level and making cluster. We may see both buying and selling scenarios.
Gold has also broken 4H trend line and retested it. So we can see a possible move till FVG.
We may also witness a breakout if price violates FVG and breaks all time high with strong volume support.
1. Price is creating higher highs in micro structure level and approaching towards 4hours FVG after breaking and retesting trend line at 4 Hours.
2. Trend line breakout is supported by strong volume.
3. Price is continuously running above EMAs confirming up move for now.
4. We may see a reversal scenario at 4 hour FVG level.
5. Most probably price will take liquidity of FVG/RDRB level and create MSS/CISD/TS/iFVG in LTF.
6. Price should show rejection/reversal in respective LTF (1h/15m) at FVG zone.
7. Take the trade only once clear entry model i.e. turtle soup. iFVG break, CDS or MSS happens on LTF
All these combinations are signalling a high probability and ~8R trade scenario.
Note – if you liked this analysis, please boost the idea so that other can also get benefit of it.
Also follow me for notification for incoming ideas.
Also Feel free to comment if you have any input to share.
Join me on live stream for real time update.
Disclaimer: This analysis is for educational purposes only and does not constitute investment advice. Please do your own research (DYOR) and check with your financial advisor before making any trading decisions.

XAU/USD – Gold Retests Bullish OB, Preparing for a Major Recover📊 Market Structure
After the Liquidity Sweep around the 4,26x highs, Gold shifted into a short-term distribution phase and formed a series of bearish ChoCHs.
However, the entire current decline remains a corrective move, as price is now approaching the Bullish Order Block at 4,155 – 4,158 USD, which is also the primary support of the prevailing trend.
The ascending trendline has not been fully broken → buyers still have structure support.
The main scenario: price may continue sweeping deeper into the Bullish OB, or even tag the Deep OB at 4,129 – 4,130 USD, before initiating a strong bullish recovery.
💎 Key Technical Zones
Bullish OB: 4,155 – 4,158 USD → primary BUY zone
Deep OB: 4,129 – 4,130 USD → safer BUY zone (deep retest)
Bearish OB: 4,211 – 4,213 USD → short-term SELL reaction
Liquidity Above: 4,239 – 4,240 USD
🎯 Trading Plan – Two Clear Scenarios
1️⃣ BUY Setup – Trend-Following Priority
When price taps the Bullish OB 4,155 – 4,158 and prints a clear rejection candle:
Entry: 4,155 – 4,158
SL: 4,128
TP1: 4,188
TP2: 4,211
TP3: 4,239
TP4: 4,260+
→ A trend-aligned setup: low risk – high reward.
→ If price does not react at the Bullish OB, wait for a deeper BUY at the Deep OB (safer).
2️⃣ SELL Scalp – For Intraday Traders Only
If price retraces into the Bearish OB 4,211 – 4,213 and shows rejection:
Entry: 4,211 – 4,213
SL: 4,225
Short TP: 4,188 → 4,175
→ This is only a reaction play. Do NOT hold long-term since the main trend remains bullish.
🧠 Vincent’s View
Gold is likely in its final corrective phase before starting a new bullish leg.
As long as 4,129 remains intact, buyers maintain full control.
Smart money is likely accumulating around the Bullish OB before pushing price back toward 4,239 – 4,260.
⚡ “Smart money always returns to where strength began — buy where the market was born.”
⏰ Timeframe: H1
📅 Updated: 04/12/2025
✍️ Analysis by: Captain Vincent

XAUUSD – H1 Sideways, Priority is Trading at Liquidity Zones...XAUUSD – H1 Sideways, Priority is Trading at Liquidity Zones
Gold is moving sideways on the H1 timeframe, with price fluctuating around the equilibrium zone and not choosing a clear direction yet.
In this condition, I avoid chasing trades in the middle of the range — instead, I only trade at the liquidity edges, where volume is higher and order-flow signals are clearer.
🎯 BUY Scenario – “Liquidity Buy” at the Lower Range
Buy: 4.191 – 4.194
SL: 4.187
TP: 4.212 – 4.235 – 4.260 – 4.290
The 4.191–4.194 zone is a Liquidity Buy area:
It aligns with the most recent sweep low.
It sits near a thick volume cluster showing strong absorption of sell orders earlier.
If price dips into this zone, I prefer buying back toward the upper boundary of the range, taking partial profits from 4.212 up to 4.26x.
This setup follows the idea of catching the defensive buy flow that is protecting the bottom of the accumulation zone.
🔁 SELL Scenario – Sell POC at Upper Range 4.237–4.240
Sell: 4.237 – 4.240
SL: 4.245
TP: 4.220 – 4.202 – 4.180 – 4.155
The 4.237–4.240 zone is a Sell POC / supply region:
Heavy volume sitting at the top.
Confluence with the current range high.
Price has previously rejected several times from this region.
If price returns to this zone, I prefer selling down toward the mid and lower range.
SL is kept tight above 4.245 to avoid being caught by a genuine breakout.
1️⃣ Broader Context – Market Shock ≠ Market Collapse
2013 – Abenomics: BOJ’s extreme easing caused volatility, but no systemic crash.
2022–2023: Fed hiked aggressively; risk assets corrected but eventually recovered.
Lesson: Modern financial markets are highly resilient to policy shocks.
For gold, this means:
Current pullbacks are not signs of a trend collapse — they are position re-balancing phases.
Our task is to read price levels & liquidity instead of reacting emotionally to short-term news.
2️⃣ Technical View from H1
Price is ranging between ~4.19x and ~4.24x.
Volume Profile shows most volume at the centre; liquidity is thin at both edges — perfect zones for stop hunts and reversals.
A deeper Buy Zone POC lies around 4.16x.
If price breaks below 4.155 and closes beneath it, the short-term bullish structure becomes threatened.
With no clean breakout yet, I stick to a mean-reversion strategy:
Buy at the liquidity bottom
Sell at the supply top
Until the sideways structure breaks
3️⃣ Today’s Trading Plan
Only trade around the two edges:
✔ Buy Setup
Buy: 4.191–4.194
SL: 4.187
TP: 4.212 – 4.235 – 4.260 – 4.290
✔ Sell Setup
Sell: 4.237–4.240
SL: 4.245
TP: 4.220 – 4.202 – 4.180 – 4.155
No entries in the middle of the range to avoid getting “bitten from both sides.”
Keep risk at 1–2% per trade, do not widen SL.
If price breaks strongly beyond either boundary and stabilizes, I stop the range-trading strategy and wait for a new structure.
If you find this analysis useful, feel free to follow the TradingView account and share whether today you prefer BUY at the bottom or SELL at the POC zone.

XAUUSD GOLD Analysis on (03/12/2025)#XAUUSD UPDATEDE
Current price - 4223
If price stay below 4245, then next target 4200,4180 and 4160 above that 4270
Plan;If price break 4224-4230 area, and stay below 4220, we will place sell order in gold with target of 4200,4180 and 4160 & stop loss should be placed at 4245
