Gold Correction Done!!!Gold has retraced to the 0.65 Fibonacci level on the 4H timeframe, calculated from the previous swing low. This zone has historically acted as a strong inflection point deep enough to shake out weak hands, but often the launchpad for the next leg up.
Zooming into the lower timeframes (30M–1H), we’re seeing bullish engulfing candles and hammer formations, signalling a potential reversal. Momentum is shifting. If support holds, this could be the start of a solid upside move.
🔍 Multi-Timeframe Snapshot:
🕓 4H Chart:
Price parked at 0.65 Fib retracement.
No breakdown below structure.
Setup still valid unless support fails.
🕒 1H & 30M Chart:
Bullish engulfing + hammer candles.
Higher lows forming.
Volume starting to lean bullish.
🕒 15M Chart:
Microstructure shows swing low forming.
Use this for dynamic trailing or TP reference.
Entry Zone: Current Market price
Stop Loss : 3890
Target : Mentioned on the chart or follow the swing low in 15M TF
Trade ideas

GOLD RETESTING SUPPLY BEFORE NEXT LEG DOWN🧭 DAILY TRADING PLAN – GOLD (XAU/USD)
Date: Oct 28, 2025
Main timeframe: M30 – H1
Strategy: SMC + Market Structure + Supply Zone
1. MARKET CONTEXT
Gold continues its bearish momentum after multiple CHoCH and BOS confirmations on lower timeframes.
Price is currently trading around 3935, after rejecting from several supply zones (4045–4047, 4011–4013, and 3975–3977).
Higher timeframe structure (H1–H4) remains bearish, with resistance forming between 4010–4050 and potential liquidity resting below 3928.
2. INTRADAY BIAS
Bias: Bearish
Expectation: Short retracement into supply → continuation down to support zone.
3. TRADING SETUP
Sell Zone #1: 3975 – 3977
Sell Confirmation: Price forms bearish CHoCH on M15–M30 near supply zone.
Entry: 3976
Stop Loss: 3982 (6 USD range)
Take Profit 1: 3940
Take Profit 2: 3928
R:R ≈ 1:4 — targeting liquidity below the previous swing low.
Avoid buying until clear BOS above 4013 is confirmed.
4. NOTES
If price closes above 4013, invalidates short bias and shifts to neutral — wait for fresh structure before entering again.
Monitor volume + reaction near Support Zone (3928–3940) for potential profit-taking.

XAUUSD SELL TRADE | WILL 4150 ACT AS A BARRIER?Yesterday, Gold experienced a significant sell-off after breaking below our previously identified positional sell level at 4185, triggering a sharp decline down to 4004.
Currently, Gold is showing signs of a retracement. The 4150 level is now acting as a strong resistance.
Trade Idea:
Sell Gold near 4150
Stop Loss: 4157.6
Target Levels: 4121, 4111, and 4101
Note: Monitor price action around these levels closely and manage risk accordingly.
Do you agree with this bearish outlook?
👍 Like if you’re ready to short!
💬 Comment your take or questions below — let’s build a powerful, informed trading community!
Your feedback drives our content and keeps everyone trading smarter. Let’s make those pips together! 🚀
Happy Trading,
– The InvestPro Team

Gold Breaks Key Support Zone — Bearish Momentum Builds Below $4,Analysis:
The XAU/USD (Gold vs. USD) 45-minute chart shows a clear breakdown below the established support zone, indicating a shift in market sentiment from consolidation to bearish momentum.
The support zone around $4,050 – $4,000 had previously held multiple times, acting as a strong demand area.
The recent breakout below this zone confirms a potential trend continuation to the downside.
Price action suggests a bearish pattern with lower highs and lower lows forming before the breakout.
A retest of the broken support (now resistance) may occur before the next leg lower.
The next major target lies near $3,900 – $3,850, aligning with the projected measured move.
Technical Outlook:
If gold fails to reclaim the $4,050 level, further downside pressure remains likely. However, a close back above this level could invalidate the bearish breakout and signal a possible false break.

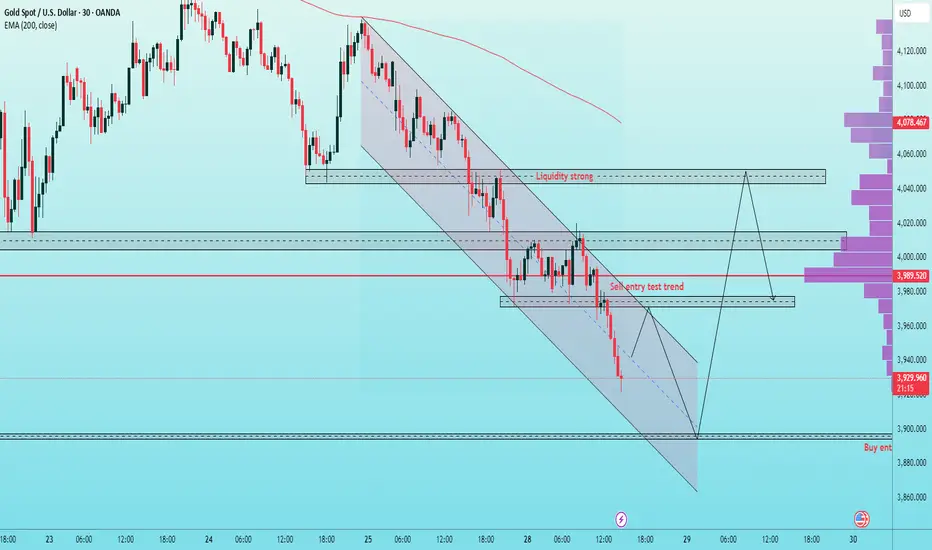
Steven Trading - XAUUSD: Stay Close to the Descending ChannelSteven Trading - XAUUSD: Stay Close to the Descending Channel, Clear SELL/BUY Opportunities Ahead of the FED 🎯
Welcome, everyone, Steven Trading is back with a detailed Gold (XAU/USD) strategy for the start of the week!
Currently, Gold is trading steadily within a clearly established descending channel on smaller time frames. Our task is to stay close to the channel to look for Sell signals at resistance zones and Buy signals reacting at key support areas.
1. 📊 IN-DEPTH TECHNICAL ANALYSIS (Steven's TA)
Based on M30/H1 analysis (refer to images):
Main Trend: Gold is in a descending channel, closely following sell signals. Lower Highs and Lower Lows are continuously being formed.
Important SELL Zone: The 38.2% Fibo level at $3973 is acting as a crucial resistance. This is a technical confluence zone to closely monitor for executing trend-following Sell orders.
Ideal BUY Zone: A strong and potential support area to catch reaction waves is around $3890 - 3900. This area lies at the bottom of the descending channel, expected to create a bounce reaction.
2. 📰 MACRO CONTEXT & CASH FLOW (Context)
The market is in a tug-of-war ahead of the crucial Fed meeting:
Short-term Support 🟢: Gold prices have paused in a two-day downtrend as safe-haven demand returns ahead of the Fed meeting. The US dollar (USD) hit a weekly low due to dovish Fed expectations, reducing concerns about US-China trade, which supports Gold prices.
Long-term Support: The Bank of Korea (BOK) has planned to purchase gold – the first addition since 2013, providing long-term psychological support.
Focus: All attention is on the Fed meeting, determining the medium-term trend of USD and XAU/USD. Gold is seeking to reclaim the 21-day SMA at $4061.
3. 🎯 DETAILED TRADING PLAN (ACTION PLAN)
We prioritise trading within the channel range:
🔴 SELL Scenario (Stay Close to the Channel)
Entry Zone: $3973 - 3975 (Important 38.2% Fibo Zone)
Stop Loss (SL): $3979 (Set a tight SL)
Take Profit (TP): TP1: $3955 | TP2: $3930 | TP3: $3910 | TP4: $3888
🟢 BUY Reaction Scenario (Channel Bottom)
Entry Zone: $3895 - 3897
Stop Loss (SL): $3890
Take Profit (TP): TP1: $3922 | TP2: $3944 | TP3: $3975 | TP4: $3998
4. 🧠 Notes and Discipline (Steven's Note)
Discipline is number 1: Always adhere to the set Stop Loss. If the market goes against the plan, we accept the small predetermined risk.
Psychology: XAU/USD is testing the crucial 38.2% Fibo support level as the Fed meeting approaches. Volatility will be high, be patient for the right price zone.
Risk Management: Only trade with a risk volume of 1-2% of the account.
Do you agree with this strategy? Like 👍 and Follow 🔔 to not miss the next insights from Steven!
GOLD (XAU/USD): SHORT OPPORTUNITY — RIDING THE FINAL BEAR LEG!1. MACRO VIEW: THE FED DECISION & MARKET TENSION
The Gold market is currently caught in a tug-of-war:
Downside Pressure (USD): Positive developments in the US-China trade talks are easing global risk concerns, which often reduces demand for safe-haven Gold.
Upside Support (Gold): Traders are fully pricing in a 25bps Fed rate cut on Wednesday, putting downward pressure on the US Dollar (which is supportive of Gold). Geopolitical tensions (Russia-US) add further safe-haven appeal.
Key Takeaway: While USD weakness is supportive, our Technicals strongly suggest a corrective move needs to conclude first. The FOMC decision is the ultimate game-changer.
2. TECHNICALS: STRUCTURE CONFIRMS THE BEARISH BIAS
Trend Shift: Gold’s strong previous rally has ended. The structure has been clearly broken, confirming a Bearish Shift for the short-term trend.
Expected Move: We are looking for a classic technical pullback (Retest) to the newly formed resistance zone. Following this retest, we expect sellers to push the price down to complete the correction.
3. 💡 TRADE STRATEGY (THE SHORT SETUP)
We are positioning for a SELL (SHORT) trade, anticipating the end of the corrective phase:
Ideal Entry Zone (Entry): 3,949.849 (Retesting the previous major Support, now acting as Resistance)
Take Profit (TP1): 3,929.793
Take Profit (TP2): 3,878.287 – 3,811.333 (The Major Demand Zone Target below)
Stop Loss (SL): Above 3,949.849 (Placed above the confirmed resistance)
⚠️ Important Note: The FED rate decision on Wednesday guarantees high volatility. Trade cautiously and ALWAYS prioritize risk management!
What is your view on Gold's bottom? Share your thoughts below! 👇
#Gold #XAUUSD #FOMC #TradePlan

LiamTrading - XAUUSD: SCENARIO AHEAD OF FOMCLiamTrading - XAUUSD: SCENARIO AHEAD OF FOMC - The $3840 Mark Awaits a Bottom Catch Reaction Wave
Hello trading community,
The Gold market is exhibiting a strong and sustainable downtrend. We are witnessing a crash after the price broke through key support zones. With the upcoming FOMC event, our strategy is to seek Buy opportunities at deep liquidity zones and continue to Sell when the price recovers to retest the broken trend.
📰 MACRO ANALYSIS & CASH FLOW CONTEXT
Gold is currently under dual pressure:
Bearish Pressure 🔴: Optimism about the US-China trade progress has significantly weakened the demand for Gold, traditionally a safe-haven commodity. Spot Gold prices have fallen below $3950, hitting a three-week low, down about 0.78% on the day (28/10).
Short-term Support 🟢: Bets on the possibility of Fed rate cuts continue to weaken the US Dollar (USD), which is the only factor that could potentially support this precious metal.
Conclusion: This tug-of-war makes bottom identification challenging. The bearish scenario remains the top priority.
📊 TECHNICAL ANALYSIS: THE DOWNWARD WAVE CONTINUES
Based on the H4 chart (image_5fa7fa.png):
Current Trend: The price has successfully broken the key liquidity support zone near $3950 and is continuing its downward momentum.
Current Fibonacci Level: The price is touching and reacting at the 1.618 Fibonacci level (around $3950).
Next Target: The next target for Gold will be the 2.618 Fibonacci area (around $3840), which is a large liquidity zone expected to see strong reactions.
Main Strategy: We focus on two scenarios: Catching the bottom reaction at 3840 and continuing to Sell when the price rebounds.
🎯 DETAILED TRADING PLAN (ACTION PLAN)
We have two detailed scenarios based on the current price level:
🟢 BUY Reversal Scenario
We wait for the price to hit the deep liquidity bottom at 3840 to execute a buy order with the expectation of a technical recovery.
Entry Zone: 3840
Stop Loss (SL): 3832 (tight SL)
Take Profit Targets (TP): TP1: $3872 | TP2: $3898 | TP3: $3925 | TP4: $3950
🔴 SELL Retest Scenario
If Gold recovers without breaking the downtrend structure:
Entry Zone: Watch for a Sell retest at $4091
Stop Loss (SL): $4099
Take Profit Targets (TP): TP1: $4065 | TP2: $4033 | TP3: $4004 | TP4: $3965
SUMMARY & DISCIPLINE (Steven's Note)
Gold is in a strong decline ahead of the FOMC, with significant volatility expected. Capturing deep Fibonacci and Liquidity zones is key.
Note: Always adhere to the set Stop Loss. Capital management is the top priority, risking only 1-2% of the account per trade.
Wishing traders a successful and disciplined new trading week!

GOLD TRADE SETUPPrice retesting the 2nd zone, waiting for 3rd confirmation ⚡
Patience = Power 💪
Smart traders wait for confirmation before execution 🎯

Sell Projection for XAUUSD (Gold/USD) dated 28.10.25Market Structure
Price Action: The chart shows a sideways channel breakout followed by a strong bearish engulfing candle.
This indicates a shift from consolidation to bearish momentum.
📈 Entry Setup
Entry Zone: Around the retest area near 3,984 (highlighted in blue).
Price is expected to pull back to this zone before continuing downward.
The “ENTRY FOR SELLERS & RETEST ZONE” is marked clearly in the chart.
🛑 Stop Loss
Stop Loss Level: ~ 4,008.551
Positioned above day resistance, giving enough buffer to avoid fake breakouts.
🟢 Target
Target Price: ~ 3,950.397
This level aligns with monthly support, giving a clean RR (Risk-to-Reward) structure.
⚡ Additional Notes
Day Resistance: 3,984.320
Monthly Support: 3,950.397
Breaked the sideways channel: This is the key trigger zone that shows bearish pressure building.
If price rejects the retest zone strongly, it can accelerate toward the target quickly.
📊 Summary of the Trade Idea
Setup Element Details
Pair XAUUSD / Gold
Direction Sell
Entry Zone 3984
Stop Loss 4008.551
Target 3950.397
Structure Sideways Breakout → Retest → Sell
Confirmation Candle Bearish Engulfing
✅ Trading Tip: Wait for clear rejection or bearish confirmation at the entry zone (e.g., wick rejection or engulfing candle) before executing the sell.

Elliott Wave Analysis – XAUUSD (October 28, 2025)
🔹 Momentum
D1 Timeframe:
The momentum lines on D1 remain intertwined. When this happens, the trend often continues with candle counts that follow Fibonacci numbers (3, 5, 8…).
Currently, there are around 3 candles, indicating a high probability of a reversal forming soon, possibly today.
H4 Timeframe:
Momentum is rising, suggesting a potential short-term upward or sideways move to push momentum into the overbought zone.
If the market consolidates at this level, once momentum reaches the overbought region, another bearish leg on H4 could still occur.
H1 Timeframe:
Momentum is currently decreasing. Price is closing lower around the liquidity zone at 3994, showing signs of a liquidity sweep.
We expect price to continue moving lower toward the next liquidity zone, in alignment with the short-term bearish structure on H1.
________________________________________
🔹 Wave Structure
D1 Timeframe:
The overall wave structure remains largely unchanged. Yesterday’s strong bearish candle fits within our prior analysis, confirming that the corrective wave is still in progress.
However, since the D1 momentum lines have already stuck together for about three candles, a potential bullish reversal candle today could mark the completion of this correction.
H4 Timeframe:
The structure has broken the previous low, suggesting that this could be the final leg of wave Y (blue).
Observing the completed 5-wave structure (1–2–3–4–5 in blue), this corrective leg has now returned to the base of the previous wave 4, achieving both price and time symmetry.
→ A short-term bullish reversal is expected from the current area.
H1 Timeframe:
The prior correction formed a triangle pattern (abcde in red), which has now broken to the downside, developing into a 5-wave sequence (black).
Wave 4 (black) appears completed, and price is likely within the final wave 5 down.
🎯 Target zones for completion of wave 5 (black):
• Target 1️⃣: 3953
• Target 2️⃣: 3927
________________________________________
🔹 Trading Plan
Scenario 1:
• Buy Zone: 3955 – 3952
• Stop Loss: 3932
• TP1: 4050
Scenario 2:
• Buy Zone: 3939 – 3927
• Stop Loss: 3907
• TP1: 3994

Gold Under Pressure: Critical Support Lost, 4040 Reclaim Needed Yesterday's session provided clear confirmation of the bearish pressure building in gold as price faced strong resistance around the CPR area between 4094-4108. The early Asian session rejection was particularly telling, as buyers simply couldn't get enough strength to push through this zone. What followed was a decisive breakdown below the psychologically important 4000 level, which had been acting as major support throughout the recent price action.
For today's session, CPR zone positioned at 4001-4040. This is now our critical battleground. Bulls need to reclaim at least 4040 (CPR TC) to suggest any meaningful recovery is underway. Without a clean breakout above this level, the path of least resistance remains to the downside, and bears are firmly in control of the near-term direction. The current price structure suggests sellers are gaining confidence, especially after yesterday's breakdown.
On the downside, the first intraday support level for today is to watch at 3933. This could provide a temporary bounce zone if we see continued selling pressure. However, given the momentum shift and the loss of 4000 support, we need to approach any long positions cautiously here. The market is clearly favoring the bears at this point, and it would take a significant shift in sentiment to change that dynamic in the immediate term.
My Position : I am still managing my buy entries and currently in floating loss ,max extension that I am expecting in lower side is at around 3800-50 area and that is manageable as per my current lot sizing.

Gold Trading Strategy for 28th October 2025🌟 💰 GOLD TRADING SETUP 💰 🌟
📊 Instrument: 🟡 GOLD (XAU/USD)
🟢 BUY SETUP
➡️ Entry: Buy above the high of the 1-hour candle — once price closes above 💲4021
🎯 Targets:
🎯 T1: 💲4033
🎯 T2: 💲4045
🎯 T3: 💲4070
🛡️ Stop Loss: Below 💲4010 (or as per your risk tolerance)
🔴 SELL SETUP
➡️ Entry: Sell below the low of the 15-min candle — once price closes below 💲3944
🎯 Targets:
🎯 T1: 💲3932
🎯 T2: 💲3919
🎯 T3: 💲3903
🛡️ Stop Loss: Above 💲3955 (or as per your risk tolerance)
⚠️ Disclaimer:
📢 This is not financial advice. These are purely educational and technical analysis-based trading ideas.
💼 Always do your own research and use proper risk management before taking any trades.
📉 The market is volatile — trade at your own discretion and never risk more than you can afford to lose.

Gold Trading Strategy | October 27-28
✅ As we anticipated, gold successfully broke below the key psychological support at $4000, confirming our previous analysis.
The short positions we advised our members to place in advance have also gained over 400 PIPS in this round of the downtrend
✅ Recently, there has been a clear rotation of funds between U.S. Treasury bonds and the spot gold market.
The U.S. 10-year Treasury yield has climbed back above the 4% level, reflecting subtle market adjustments to the Fed’s rate-cut expectations this week.
This shift led to a temporary outflow of safe-haven capital, causing gold to remain under pressure.
Meanwhile, the U.S. dollar index edged down about 0.14% during the day, yet gold failed to benefit, indicating a lack of bullish confidence in the short term.
✅ On the 4-hour chart, gold continues to display a bearish structure.
After breaking below the $4000 psychological level, its downside momentum has not yet been fully exhausted.
The resistance level is seen around 4010, and if this level fails to break, gold is likely to continue weak consolidation.
The support level lies near 3945, which is a key pivot zone; if it holds, gold will likely oscillate within the 3945–4010 range in the short term.
✅ On the 1-hour chart, gold previously formed a double-top pattern, and the neckline has been clearly broken.
Price action remains below the neckline, confirming bearish dominance.
The moving averages are expanding downward, showing that bearish momentum continues.
In the short term, the 4004 level has turned from support into resistance.
As long as gold remains below this area during the U.S. session, any rebound should be viewed as a selling opportunity.
🔴 Resistance Levels: 4004 / 4010
🟢 Support Levels: 3970 / 3945
✅ Trading Strategy Reference:
🔰 If gold rebounds to the 4004–4010 zone and faces resistance, consider light short positions, with a stop loss above 4015, targeting 3970–3950.
🔰 If gold pulls back to around 3945 and holds steady, consider short-term long positions, targeting 3990–4000.
✅ Overall, gold’s short-term outlook remains bearish, with the technical structure still favoring sellers.
If the price fails to regain a foothold above 4010 tonight, it is likely to retest the 3945 support area.
Traders should remain cautious and continue to follow the trend, focusing on selling near resistance zones as the main strategy.

Gold as said on Friday until 4160 not break sell on rise Gold sell on rise recommended until 4160 not break ,
Still no buy signals sell on rise will continue
How My Harmonic pattern projection Indicator work is explained below :
Recent High or Low :
D-0% is our recent low or high
Profit booking zone ( Early / Risky entry) : D 13.2% -D 16.1 % is
range if break them profit booking start on uptrend or downtrend but only profit booking, trend not changed
SL reversal zone (Safe entry ) : SL 23.1% and SL 25.5% is reversal zone if break then trend reverse and we can take reverse trade
Target : T1, T2, T3, T4 and .
Are our Target zone
Any Upside or downside level will activate only if break 1st level then 2nd will be active if break 2nd then 3rd will be active.
Total we have 7 important level which are support and resistance area
Until , 16% not break uptrend will continue if break then profit booking will start.
If break 25% then fresh downtrend will start then T1, T2,T3 will activate
1,3,5,10,15,20 minutes are short term levels.
30 minutes 60 minutes , 2 hours,3 hours, ... 1 day and 1 week chart positional and long term levels

GOLD - ENTERS COREECTION PHASESymbol - XAUUSD
Gold is currently undergoing a corrective phase following approximately six weeks of aggressive upward movement. Price action is forming a consolidation range while continuing to pressure the support zone.
The recent record breaking rally became overheated, prompting profit-taking and long liquidation. Additionally, a gradual shift in market sentiment and macroeconomic backdrop is contributing to capital outflows. However, ongoing US–China trade negotiations, the US government shutdown, and heightened geopolitical uncertainty, including the cancellation of Trump’s meeting with President Putin, continue to pose economic risks that could provide underlying support for the precious metal.
Overall, the current pullback appears to be a healthy corrective pause within the broader structure. The 4000 level remains a critical support area. A sustained recovery above 4110 would indicate that buyers are interested, though further momentum largely depends on developments surrounding global trade policies.
Resistance levels: 4100, 4110, 4163
Support levels: 4058, 4000
A decisive breakdown of the lower boundary of the trading range could trigger a deeper corrective wave. The 4000 level is the primary focus, as strong volatility may occur around this zone. Given the current market conditions - with declines matching the previous intensity of the rally, patience is warranted until momentum stabilizes, enabling more informed technical decisions.

XAUUSD - NOV-DEC 2025 TARGET / STRATEGY analysis While BRICS is already dealing to settle payment for Trades in their Local Currency ditching US dollar, Dollar seems to Weaken Further.
US Dollar Drops 50% Against Gold Since 2021 | The Jerusalem Post
The US dollar has long seemed untouchable, but its fortress is cracking | Fair Observer
with coming Christmas Gold can see a little sell off before Gearing UP.
TARGET already marked for LONG & short both
Note: Keep Trailing once in Profit
also ALSWAY look for EMI 20,50 & 100 it works as a good Support/Resistance
Folow on X

#xauusd gold dumping is going to 3600 this is my gold analysis#xauusd gold dumping is going to 3600 this is my gold analysis #xauusd gold dumping is going to 3600 this is my gold analysis
v
#xauusd gold dumping is going to 3600 this is my gold analysis#xauusd gold dumping is going to 3600 this is my gold analysis#xauusd gold dumping is going to 3600 this is my gold analysis#xauusd gold dumping is going to 3600 this is my gold analysis
#xauusd gold dumping is going to 3600 this is my gold analysis
why the reason you can sea on my previous public post of #gold
#xauusd

Risk-On Rally Threatens Gold: Eyes on Critical $4,000 LevelGold is sliding toward the $4,000 support level as improving US-China trade deal sentiment reduces demand for safe havens.
What’s Driving the Drop:
Risk-On Shift after upbeat trade comments from Washington.
Bearish Setup as price fails to reclaim broken support.
Key Levels:
Support: $4,000. A breakdown could send prices toward $3,945.
Resistance: $4,150–$4,185 for bulls to regain control.
Bottom line: Gold is under pressure, and a move below $4,000 may trigger steeper losses.

XAUUSD – Institutional Demand Zone Setup🎯 XAUUSD – Institutional Demand Zone Setup
💡 Structure Insight:
Market formed Rally → Base → Drop → Base → Drop, completing a bearish leg.
Now, price approaching a fresh Drop–Base–Rally demand zone (green area).
🧠 Smart Money Logic:
Institutions already built liquidity with previous lower highs.
Current drop is sweeping liquidity to fill orders at the demand base.
After rejection from this zone → expect new rally formation.
📍 Plan:
✅ Wait for rejection inside the green zone.
✅ Confirm with bullish candle close or structure break.
✅ Enter long after confirmation.
🎯 Target: Blue projection area (imbalance fill zone).
🛑 Stop Loss: Below the demand base.

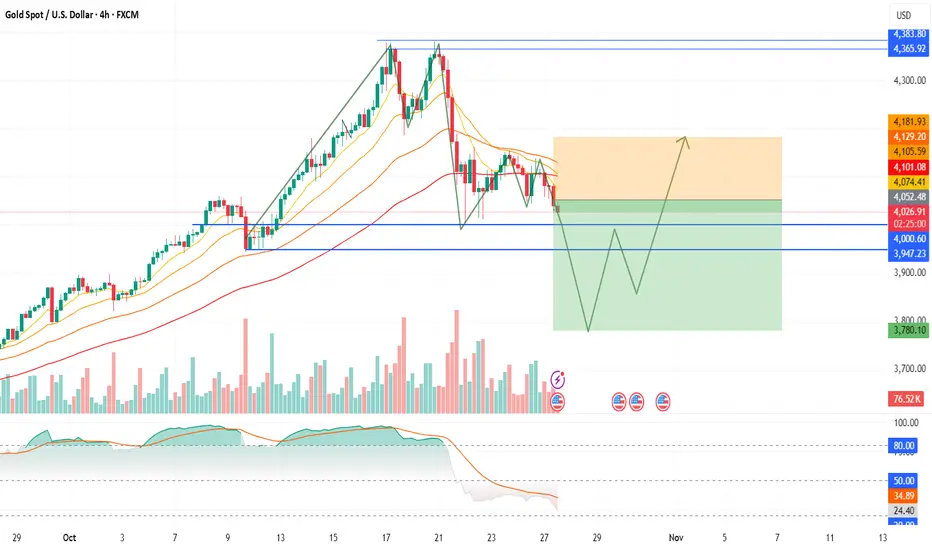
Dual-phase trading — shorting the drop, then switching to long Gold is currently trading near $4,040, and my short-term outlook is bearish, followed by a strong bullish reversal in the coming sessions.
I expect prices to decline first toward the $3,800–$3,750 zone, which aligns with key support and previous demand levels. This correction phase would complete a healthy market reset before a potential major rally begins.
Once price stabilizes around $3,800, I anticipate a sharp reversal and breakout move toward $4,200+, possibly extending higher if momentum builds.
📊 My Plan:
Bias: Bearish first → then Bullish
Short-Term Target: $3,800–$3,750
Reversal Zone: Accumulate longs near $3,800
Upside Target: $4,200+
Invalidation: Below $3,740 (on 4H closing)
This setup favors patience and dual-phase trading — shorting the drop, then switching to long for the rebound.
gold spot update at early momentum gold spot trading very high volatile and now facing strong hurdle 4065--85$ if mkt hold blw than soon 4008$---3965$ in near terms yes last low 4003$ looks some barrier.where can mkt reversal for buyer trap .
trading idea---- gold spot can selll on rise with small sl 4065 or let see tgt 4008--3965$++

Elliott Wave Analysis – XAUUSD (October 27, 2025)
🔹 Momentum
• D1 Timeframe:
D1 momentum remains clustered, suggesting that a bullish reversal could occur at any time. However, since momentum has not yet separated clearly, short-term downside pressure still exists.
• H4 Timeframe:
H4 momentum is currently declining, meaning that the downtrend could continue. We need to wait for H4 momentum to reach the oversold area and observe the market’s reaction there to determine whether the current drop is complete.
• H1 Timeframe:
H1 momentum is rising slightly, indicating the potential for a short-term rebound. However, since H4 is still in a down phase, any upward movement could face resistance near the 4098 level.
________________________________________
🔹 Wave Structure
• D1 Timeframe:
Price is currently moving sideways while D1 momentum remains stuck together, signaling a possible upcoming 5-day rally once D1 momentum turns upward into the overbought zone.
o If price fails to break above wave (3) yellow, this move is likely a wave (4) yellow correction.
o Conversely, if price breaks above wave (3) yellow, the current correction may only be a minor wave within wave (3) yellow.
________________________________________
🔹 Two Main Scenarios
1️⃣ Bullish Scenario (WXY blue completed):
If the WXY blue corrective structure has finished, the market may start a new wave (5) purple uptrend.
In this case:
• As H4 momentum moves into the oversold area, price should not fall deeply toward 4004.
• A sharp and decisive rebound from that zone would confirm this bullish scenario.
2️⃣ Bearish Scenario (Correction still in progress):
If the correction is not yet complete, the H4 decline could continue:
• Price might break below 4004, or at least retest it.
• If that happens, the downtrend could extend toward 3953 or 3927.
________________________________________
🔹 H1 Structure – Triangle Formation
On the H1 chart, price is consolidating within a contracting triangle, suggesting sideways accumulation with two possible interpretations:
• Scenario 1:
The triangle represents wave X of the WXY black structure.
When H4 momentum reaches the oversold zone and price holds above 4004, we may see an impulsive breakout toward the previous high at 4381, completing a flat correction of wave (4) yellow (D1).
• Scenario 2:
The triangle is wave (4) of wave Y blue, meaning that once completed, price could decline further toward 3953 or 3927 to finish wave Y. After that, a more stable upward wave is expected.
________________________________________
🔹 Trading Plan
Currently, price remains inside the triangle pattern:
• For experienced traders:
Wait for a breakout of either side of the triangle for direct entry.
• For more conservative traders:
Wait for Buy opportunities near strong support below.
🎯 Buy Zone: 3930 – 3927
🛑 Stop Loss: 3917
🎯 TP1: 4004
👉 If price breaks above 4149, we can look for Buy entries upon breakout, expecting an extended upward move toward 4268 or higher.

XAU/USD (Gold) chart on the 3-hour timeframe...XAU/USD (Gold) chart on the 3-hour timeframe, I can see my using the Ichimoku Cloud and have marked a range with a potential breakdown area and a target point already indicated on the chart.
Here’s what the chart suggests:
Current price: around 4031 USD
Range low (support): around 4030 USD (which is currently being tested)
Range high (resistance): around 4190–4200 USD
Breakdown target (measured move): around 3940–3950 USD
📉 Analysis:
Price has broken below the range box, indicating a bearish breakout.
The Ichimoku Cloud ahead is bearish and thick, showing potential resistance.
A measured move from the height of the range (≈ 150–170 points) projects downward to around 3940–3950 USD.
My chart already marks 3944.299 as the target point, which aligns well with this projection.
✅ Target Summary
Type Level (USD) Comment
Short-term target 3,944 Measured move target after range breakdown
Extended target 3,900–3,880 Possible continuation if bearish momentum sustains
Invalidated above 4,090–4,100 If price re-enters the range and closes above the cloud
