Gold Next Move below or above Gold Next Move below or Above $4000-$4010 only
Gold dropped well with Fed resume the rates
Trade ideas

Gold for next week -> 3 Nov 2025I'm expecting a drop into the demand zone and from there expecting a rally into the next supply zone which I marked above.

GOLD TRAPPED BETWEEN LIQUIDITY ZONES – WAITING FOR SMART MONEY M🧭 DAILY TRADING PLAN – GOLD (XAU/USD)
Date: Oct 31, 2025
Main timeframe: M30 – H1
Strategy: SMC + Liquidity Grab + BOS/CHOCH Confirmation
🎯 Hook:
Gold is currently ranging between two key liquidity zones after a bullish BOS. Will price hunt the weak high or sweep the buy-side liquidity before the next leg?
🌐 MARKET CONTEXT
After a strong recovery from 3960 → 4040, price created a weak high with no significant displacement. The recent rejection from 4037–4039 suggests short-term supply pressure, but overall market structure remains bullish with multiple BOS confirmations.
Current structure shows a liquidity grab → retracement phase before continuation.
📈 TRADING PLAN
Scenario 1 – BUY setup (preferable)
Entry zone: 3996 – 3994
Confirmation: Bullish reaction / CHoCH on lower timeframe (M5–M15)
TP1: 4030
TP2: 4038 (liquidity above weak high)
SL: 3988 (≈ 6$ risk range)
Bias: Continuation bullish leg after mitigation
Alternative BUY zone (deep retracement):
Entry: 3960 – 3958
TP: 4030
SL: 3952
Use only if price sweeps lower liquidity.
Scenario 2 – SELL setup (counter-trade)
Entry zone: 4037 – 4039
Confirmation: M15 bearish CHoCH / rejection candle
TP1: 4010
TP2: 3995
SL: 4045 (≈ 6$ risk range)
Bias: Short-term sell before retest demand
🧩 SUMMARY
Market still shows bullish structure, so buy setups at demand zones are higher probability.
Sell setups should be quick scalps around the weak high, targeting intraday retracement.

StevenTrading - XAUUSD: Buy Up Priority – Leverage New ...StevenTrading - XAUUSD: Buy Up Priority – Leverage New Bullish Structure and Await FED/Trade
Hello everyone, StevenTrading is back with a detailed Gold strategy!
Gold is currently restrained due to reduced expectations of a Fed rate cut in December and optimism in US-China trade.
However, the gold scenario is on a bullish structure and we prioritise buying up higher positions according to Fibonacci.
Macroeconomic factors such as the Fed meeting and high-level trade talks will drive XAU/USD actions.
📰 MACRO ANALYSIS & SENTIMENT
Pressure 🔴: Gold prices have undergone a deep correction after opening higher for the week.
The US dollar index hovers around $99.50$ due to uncertainty surrounding the Fed's policy outlook.
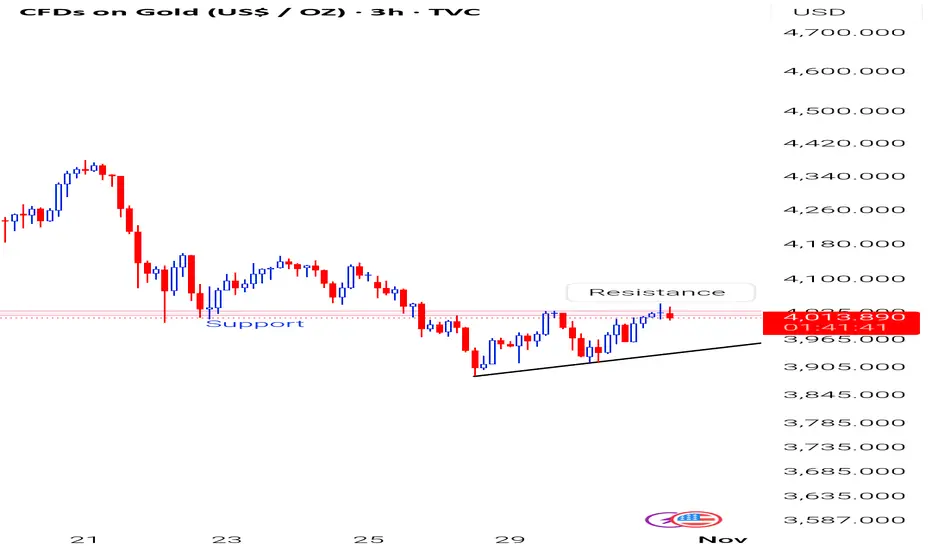
Technical Outlook: The current technical outlook highlights a loss of short-term bullish momentum.
However, the bullish structure remains intact (refer to image_1df12a.png).
📊 TECHNICAL ANALYSIS & BUY UP PLAN
Priority: Buy Up higher positions according to Fibonacci.
Strategic Sell Rhythm: The sell rhythm will watch at Fibonacci and previous support around $4059$.
🎯 DETAILED TRADING PLAN
We have a primary BUY scenario and a scalping SELL at resistance:
🟢 Primary BUY Scenario (BUY Primary)Logic: Watch for buying at liquidity and support zones.
Entry (BUY): $3960 - 3960$ (Support/Fibonacci Zone)
SL: $3954$
TP1/TP2: $3975$ | $3998 FWB:TP3 : $4020$
🔴 Scalping SELL Scenario (SELL Scalping)
Logic: Watch for selling at Fibonacci and previous support around $4059$.
Entry (SELL): $4058 - 4060$
SL: $4065$
TP1/TP2: $4033$ | $4018$TP3/TP4: $4000$ | $3978$
📌 SUMMARY & DISCIPLINE Despite the short-term loss of momentum, the bullish structure is still prioritised.
Important: FED and trade uncertainties will create volatility.
Capital management discipline and adherence to SL are key. Do you agree with this buy-up strategy? Comment and follow!

XAUUSDGold shows bullish retracement. It will react from inducement zone. and will fall to the Demand and reverse to continue upside.

XAUUSDGold rejected from the support area broke the Trendline and formed a pattern head and shoulders shorting gold here.
Tp - 3959

Gold : if fails to hold recent high 4046 then be ready for Gold taken resistance at previous support which is very crucial juncture. Expecting a sharp fall in coming day is ready .. here RR is favourable in terms of seller .
Check your set-up .
# No recommendation
XAUUSDGold has been showing bullish signs break of pattern and and Trendline keeping it simple and in higher time frame as well gold is showing bullish signs.
Buy @ 4000
Tp - 4054
Extended Tp 4086


XAU/USD — Rejection Expected from Resistance Zone for Bearish CoCurrent Price: $4,005
Resistance Zone: $4,020 – $4,040
Gold is approaching a strong resistance area that previously triggered a pullback.
Trend Structure:
The market is moving inside a short-term ascending channel, but momentum shows signs of exhaustion near the upper boundary.
Key Observation:
A false breakout or rejection at the resistance could initiate a downward correction.
Bearish Signal Setup:
Entry Zone (Sell): $4,015 – $4,035 (look for rejection candles or bearish engulfing near resistance)
Target 1: $3,960
Target 2 (Main Target): $3,913
Stop Loss: $4,045 above resistance zone EUREX:FDAX1! ICEEUR:RC1! ICEEUR:BRN1! ICEEUR:WBS1! EUREX:FESX1! EUREX:FGBL1! EUREX:FDXM1!
Risk/Reward Ratio: Approx. 1:2.5
Confirmation:
Wait for bearish confirmation candle on 15M or 30M timeframe.
Break below $3,980 will strengthen bearish momentum toward target.
Signal Summary (📉 Sell Setup):
Direction Entry TP1 TP2 SL ICEEUR:Z1! ICEEUR:W1! EUREX:FGBM1! EUREX:FGBS1! EUREX:FGBS1! ICEEUR:GWM1! EUREX:FXXP1! EUREX:DOWF1! ICEEUR:XZ1!
🔻 SELL 4,015 – 4,035 3,960 3,913 4,045

XAUUSDA good Buy setup was waiting for the Trendline break , previous demand zone was there a correction was required that was my login that brought my bias for long please follow if you like my idea

#Gold | From Double Top Breakdown to Potential W Reversal#XAUUSD | 4H Chart
Formed an M pattern (Double Top) , broke down, and completed its target ✅
Now taking support at the demand zone, showing early signs of a W-pattern formation (potential bullish reversal).
Support: 3944.43 / 3915.52 / 3892.95-3897.13
Immediate Resistance: 4030.34-4033.87
Key Resistance Levels:
4056.70-4065.52 / 4133.00-4154.79 / 4185.91-4205.12 (previous M-pattern breakdown zone)
Expectation:
If #XAUUSD surpasses 4034 on 4 HCB , price may retest the M-pattern breakdown zone (4185-4205) .
#Gold #XAUUSD #Wpattern #Mpattern #ChartPattern #PriceAction #Commodities
📌 Disclaimer: This analysis is shared for educational purposes only. It is not a buy/sell recommendation. Please do your own research before making any trading decisions.

🇺🇸 IMPACT OF FED AFTER FOMC DECISION🇺🇸 IMPACT OF FED AFTER FOMC DECISION
Hello traders,
The latest Federal Reserve rate decision shook global markets — pushing Gold (XAUUSD) and Bitcoin lower while the US Dollar strengthened sharply.
The Fed cut interest rates for the second time this year, bringing them down to 3.75%–4%, but the announcement to end Quantitative Tightening (QT) by 1st Dec 2025 was the real game changer.
This is the moment to stay calm, read the market structure, and act according to your plan.
📰 MACRO ANALYSIS – THE FED’S DOUBLE IMPACT
Rate Cut (Normally Bullish for Gold):
The second rate cut should, in theory, support Gold prices. However, much of this was already priced in before the announcement.
QT Ending (USD Strength Booster):
Ending QT signals that the Fed is trying to rebalance its monetary stance. This boosted the US Dollar Index (DXY), putting heavy selling pressure on both Gold and BTC.
Market Reaction:
Gold saw a sharp drop right after the announcement, then moved sideways in a wide range. During today’s Asian session, Gold fluctuated nearly $70 before retracing slightly.
📊 TECHNICAL OUTLOOK – WIDE RANGE, BUILDING BULLISH STRUCTURE
Looking at the current XAUUSD market structure:
Structure: Gold is currently consolidating in a wide range. However, a bullish structure seems to be forming with higher lows — a sustainable Dow-style uptrend pattern.
Trading Plan: Stay flexible and trade both sides —
🔴 Sell (Short) near liquidity resistance zones.
🟢 Buy (Long) from deep liquidity supports.
🎯 TRADING ACTION PLAN
🔴 SELL CONTINUATION – Short from Resistance
Entry Zone: 4005
Stop Loss: 4013
Targets:
TP1: 3990
TP2: 3975
TP3: 3960
TP4: 3943
🟢 BUY RECOVERY – Long from Support
Entry Zone: 3907–3909
Stop Loss: 3902
Targets:
TP1: 3933
TP2: 3954
TP3: 3970
TP4: 3999
⚖️ FINAL THOUGHTS
The Fed’s decision has reshaped the short-term outlook.
A $70 volatility range shows Gold’s high liquidity — but also high risk.
📌 LiamTrading’s Note:
A strong bullish structure is building up on the lower timeframes. Patience is key — wait for the ideal Buy zone near 3907 to catch the next recovery leg.
Always maintain strict risk and capital management, especially during post-FOMC volatility.
Are you ready to ride this 70-dollar range?
👉 Tap LIKE 👍 and COMMENT your setup!

XAUUSDPrice Action Trading is a method of financial market analysis where traders make buying and selling decisions solely based on the asset's price movements over time, without relying on technical indicators.
It's essentially the art of reading a "naked" or clean chart to understand the psychology and behavior of market participants.

Gold today booked 80 points on sell and 30 points on buyGold yesterday sold at 4010 booked 3940 , and bought at 3960 booked at 4000
How My Harmonic pattern projection Indicator work is explained below :
Recent High or Low :
D-0% is our recent low or high
Profit booking zone ( Early / Risky entry) : D 13.2% -D 16.1 % is
range if break them profit booking start on uptrend or downtrend but only profit booking, trend not changed
SL reversal zone (Safe entry ) : SL 23.1% and SL 25.5% is reversal zone if break then trend reverse and we can take reverse trade
Target : T1, T2, T3, T4 and .
Are our Target zone
Any Upside or downside level will activate only if break 1st level then 2nd will be active if break 2nd then 3rd will be active.
Total we have 7 important level which are support and resistance area
Until , 16% not break uptrend will continue if break then profit booking will start.
If break 25% then fresh downtrend will start then T1, T2,T3 will activate
1,3,5,10,15,20 minutes are short term levels.
30 minutes 60 minutes , 2 hours,3 hours, ... 1 day and 1 week chart positional and long term levels
Gold Spot Ready For Big Move in Coming Days - 30 October 2025Gold prices may see a major breakout soon. Traders eye upcoming data and Fed signals for the next big move in the gold spot market.

GOLD READY FOR A BULLISH REBIRTH | Pullback Buy Setup Inside🧭 DAILY TRADING PLAN — GOLD (XAU/USD)
Date: Oct 30, 2025
Main timeframe: H1 – M30
Strategy: SMC + EMA Confluence + Trendline Reversal
🧩 MARKET CONTEXT
Gold has just completed a liquidity sweep below 3920 and is forming a bullish corrective structure along the rising trendline.
The short-term structure shows CHoCH → BOS confirmation around 3950–3970, signaling a potential reversal phase.
Price is currently testing the EMA zone (H1) and approaching the key supply at 4026–4028, where short-term profit-taking might appear.
Overall, market sentiment remains bullish toward 4020–4030, but a short retracement could occur before the next leg up.
🎯 TRADE PLAN
BUY SETUP #1
Entry: 3950 – 3948
SL: 3943
TP: 4018 → 4026
(R:R ≈ 1:3)
If price fails to hold above 3948, wait for a deeper liquidity grab:
BUY SETUP #2
Entry: 3921 – 3919
SL: 3913
TP: 3980 → 4020
(Liquidity sweep + trendline confluence)
SELL SETUP (Counter-trade)
Entry: 4026 – 4028 (rejection zone)
SL: 4033
TP: 3970 – 3950
(Only valid if bearish BOS appears on M15)
🔍 TECHNICAL INSIGHT
Structure flipped bullish after CHoCH & BOS on M30
Trendline support remains intact
EMA 34 crossing upward on H1 – confirming short-term momentum
Main liquidity pools sit around 3919 (below) and 4028 (above)
Expect pullback → bullish continuation as long as price stays above 3948

StevenTrading - XAUUSD: OUTLOOK FOR 30 OCT...StevenTrading - XAUUSD: OUTLOOK FOR 30 OCT – NEW BULLISH CYCLE AT $3942$
Hello traders,
Gold is gaining traction as the USD weakens and safe-haven demand returns.
We believe Gold has completed its Elliott Wave ABC correction and is now beginning a new bullish cycle.
🔍 Fundamental Analysis
Recent rate-cut news hasn’t changed Gold’s structure much immediately, but overall market sentiment is shifting toward looking for bullish confirmation.
🎯 DETAILED ACTION PLAN
🟢 PRIORITY BUY – Starting the New Bullish Wave
This is the main scenario, based on the view that Gold has finished its corrective phase and is now seeking a strong support zone for an upward move.
Logic Entry:
The $3942 - 3944$ range lies just above $3938$ (Support) and aligns perfectly with a potential Buy Zone on the chart.
Entry: $3942 - 3944$
Stop Loss (SL): $3935$ (tight SL below key technical support)
Take Profit (TP1/TP2): $3966$ | $3980$ (short-term swing targets)
🔴 SELL SCALPING – Testing Short-Term Resistance
This setup is for quick scalping trades when Gold retests the psychological resistance zone near $4000$.
Logic Entry:
The $4003 - 4005$ range is just below the $4017$ resistance.
This offers a short-term selling opportunity before a confirmed breakout of the bullish structure.
Entry: $4003 - 4005$
Stop Loss (SL): $4010$
Take Profit (TP1/TP2): $3989$ | $3970$
⚙️ Core Watch Levels
Resistance: $4017$
Support: $3938$
💡 Pro Tip: Focus on Buy setups around the $3942 liquidity zone to catch the early stage of the new bullish cycle. Strict stop-loss discipline is a must!

GOLD | Is This the FINAL Short Setup Before the Next Move? Welcome Traders!
Forget the noise — focus on structure and sentiment. Gold is holding firm near $3,950, but the macro backdrop just got tighter.
The question now: Can demand strength beat Powell’s new hawkish tone?
1. Market Insight – Powell vs. Demand
Two forces are pulling Gold in opposite directions:
🐻 Bearish Catalyst:
Powell hinted that another rate cut in December is unlikely, and the Fed plans to continue balance sheet reduction — strengthening the USD and weighing on non-yielding assets like Gold.
🐂 Bullish Support:
Persistent central bank demand and ETF inflows continue to provide a safety net, tightening overall Gold supply.
🎯 Outlook:
Expect sideways compression before a potential breakout. We’re stalking the strategic Sell Zone to align with the bearish fundamentals.
📊 2. Structure Check – Where Bears Wait
The market is approaching a major confluence zone:
SELL LIMIT Zone: $4,057 — intersection of the descending trendline and key horizontal resistance.
Immediate Support: $4,005 — target for the first leg down.
3. Action Plan – The Short Sniper Setup
Entry: SELL LIMIT $4,057
Stop-Loss: just above the descending trendline
TP1: $4,005 (short-term support retest)
Extended Target: $3,938 if breakdown accelerat
Powell’s hawkish tone is clear — but will bears finally take control from $4,057$, or will central bank demand defend the rally?

Elliott Wave Analysis – XAUUSD | October 30, 2025
1️⃣ Momentum
• D1 Timeframe:
D1 momentum remains entangled. Yesterday’s daily candle closed at its lowest point, rejecting all intraday bullish attempts. However, it has not yet broken the previous candle’s low — this suggests that the bearish trend is still intact, though weakening, and a potential reversal could occur within the next 1–2 days.
• H4 Timeframe:
H4 momentum is approaching the oversold zone, indicating a possible short-term recovery lasting around 4–5 H4 candles.
• H1 Timeframe:
The price is currently either consolidating or continuing its short-term decline.
If it continues to cling to the 3927 liquidity zone, a further breakdown is likely.
________________________________________
2️⃣ Wave Structure
• D1 Timeframe:
Price is now sitting near the 0.382 Fibonacci retracement of wave (3) in yellow — a typical correction level for wave (4).
Therefore, if the decline continues or the correction extends, it’s highly probable that we are in wave (4) of the yellow count, and the current drop is only the first sub-wave of this corrective phase.
• H4 Timeframe:
Currently, price is around the 0.872 extension of wave (3) in purple, which is not ideal for a completed wave (4).
When combining the D1 and H4 structures, both indicate that the market is likely forming a corrective wave (4) in yellow, and a recovery move may soon appear as D1 momentum begins to turn upward.
👉 If this scenario is confirmed:
o If price breaks above the previous wave (3) high (around 4400), it would confirm the start of a new impulsive wave upward.
o If price rises slowly and the highest target only reaches around 4400 before turning down again → this move is likely part of the corrective wave (4) before another bearish leg resumes.
• H1 Timeframe:
The current formation suggests a potential double zigzag structure.
To confirm this setup, price needs to break below 3892. This is a strong liquidity zone, so if price reaches it, a temporary bounce could occur.
Key liquidity zones above to watch: 3927 – 3953 – 3995.
If price fails to break above the previous red wave X, these zones may act as strong resistance levels, pushing the market lower again.
Target areas for the red wave Y are:
o 3814
o 3786
________________________________________
3️⃣ Trade Plan
Scenario 1:
• Buy Zone: 3815 – 3813
• SL: 3804
• TP1: 3892
Scenario 2:
• Buy Zone: 3787 – 3785
• SL: 3776
• TP1: 3892
________________________________________
📌 Summary:
D1 momentum is weakening and nearing the oversold zone → a potential bullish rebound could develop in the coming sessions.
The 3815 – 3785 area remains a key buy zone, while 3927 – 3995 should be closely monitored as resistance levels to confirm the next directional move.

Gold Struggles at 4000: Managing Longs in Corrective PhaseYesterday's session brought some disappointment for the bulls as gold tested the psychological 4000 level but failed to sustain above it on the larger timeframes. After reaching a high around 4028, we saw sellers step in with conviction, leading to a breakdown of the ascending trendline that had been supporting the recent recovery attempt. The rejection at these levels was swift, and now we're trading back at lower levels, which puts the immediate bullish case on hold for the time being.
For today's trading session, the CPR range positioned between 3943-3968 represents the intraday battleground. This zone is now acting as resistance, and bulls will need to prove themselves here if they want to regain any meaningful momentum. To shift the current selling sequence and get back into control, price needs to reclaim the broken trendline support and more importantly, break above yesterday's high at 4028. Until that happens, the path remains to the downside, and we need to respect what the market is telling us for current short term structure.
On the support side, the 3880-3900 zone that we have to watch and losing control here could open the door for more corrections toward lower levels and can make attempt towards 3850 (50% Fib Level).
From a fundamental perspective, we're also dealing with some interesting cross-currents. The China-US trade deal developments are currently providing some headwinds for gold, giving short-term sellers additional reasons to press their advantage. However, zooming out to the bigger picture, yesterday's Federal Reserve decision to cut rates by another 25 basis points and signal the end of Quantitative Tightening is structurally bullish for gold over the medium to long term. This transition to monetary easing typically creates a favorable environment for precious metals.
As for my positioning, I'm continuing to manage my existing long positions. My broader view remains to buy the dip because the longer-term structure still favors the bulls. These short-term corrections, while uncomfortable, are part of the journey in trending markets. The key is staying patient and not getting shaken out by near-term volatility when the fundamental and structural backdrop remains supportive.

Gold Rebounds Toward OB, but Deeper Correction May Follow🔍 Market Context
After forming a Change of Character (ChoCH) and a clear Break of Structure (BoS) to the downside, gold dropped sharply from 4,080–4,100 USD, confirming a shift from bullish to bearish structure.
Price is now making a technical rebound, forming Lower Highs toward the Order Block 4,012 USD — aligning with a small Fair Value Gap (FVG) , suggesting new selling pressure may emerge.
This rebound is seen as a “pullback retest supply” within a completed bearish setup.
If the 4,012 USD supply zone reacts strongly, price may extend its drop toward lower liquidity pools.
💎 Key Technical Structure
BoS (bearish): confirms a break below prior bullish structure.
Order Block (OB): 4,010–4,020 USD → main supply area confluencing with FVG.
FVG zone: 3,985–4,010 USD → technical retracement zone.
Supply Zone: 3,891–3,895 USD → temporary support, may be swept.
Liquidity Zone: 3,850–3,860 USD → key liquidity target.
📈 Trading Scenarios
1️⃣ SELL Setup – Retest OB 4,010–4,020 USD
Entry: 4,010 – 4,020
SL: 4,035
Take Profit: 3,985 - 3,965 - 3,945 - 3,915 - 3,890/Open
✅ Condition:
Wait for price to retest FVG–OB with clear bearish confirmation (strong rejection, bearish engulfing, or minor ChoCH on M15).
➡️ Trend-follow setup – sell after price retests supply zone.
2️⃣ BUY Setup – Reversal at Liquidity Zone 3,850 USD
Entry: 3,850 – 3,860
SL: 3,830
TP1: 3,870 - 3,885 - 3,900 - 3,920 - 3,940/Open
✅ Condition:
Wait for strong absorption or bullish reversal signal (long-tail rejection or bullish ChoCH on M15–H1).
➡️ Counter-trend scalp setup for reversal traders.
⚠️ Risk Management
Prioritise SELLs below 4,035 USD.
BUYs only valid with confirmation at Liquidity Zone.
Avoid mid-range trading (3,920–3,970) to reduce noise.
💬 Conclusion
Gold remains in a bearish trend after breaking prior bullish structure.
As long as price stays below 4,035 USD , downside momentum prevails.
Next major target: 3,891 – 3,851 USD .
👉 Strategic Plan:
Sell 4,010–4,020 | SL 4,035 | TP 3,985 → 3,890 🎯
Buy 3,850–3,860 | SL 3,830 | TP 3,870 → 3,940 🎯
💎 Price never lies — liquidity always reveals the truth.
⏰ Timeframe: 1H
📅 Updated: 29/10/2025
✍️ Analysis by: Captain Vincent

technical analysis for your XAU/USD (Gold vs USD) chart:XAU/USD (Gold) 15-Min Chart Analysis – 29 Oct 2025
Market Structure
The previous descending channel has been broken to the upside, indicating a potential trend reversal from bearish to bullish.
Price retraced back to a support level zone (≈ $3,920 – $3,940), where buyers are likely to defend.
Key Levels
Support Zone: 3,920 – 3,940
→ Price already tested this area with strong rejection wicks, showing buyer interest.
Resistance Zone: 3,980 – 4,020
→ Short-term resistance; a breakout above 4,020 confirms bullish momentum.
Target Level: 4,142
→ As marked on your chart, this is the projected bullish target after confirmation of upward continuation.
Price Action
After a downward correction, gold found support and formed a double-bottom-type pattern near the 3,940 level.
Price is currently consolidating above support, signaling potential accumulation before an upward push.
Momentum Outlook
If price holds above 3,940, expect a move towards 4,000 → 4,020, followed by a breakout to 4,142 (target).
However, if 3,920 support breaks, the price may retest 3,880–3,860, resuming short-term bearish momentum.
📈 Trading Bias
Bullish bias above 3,940 (target 4,142).
Bearish only below 3,920 (target 3,860). EURONEXT:NH7X2025 EURONEXT:PE6X2025 EURONEXT:PE7X2025 EURONEXT:A57X2025 EURONEXT:AJ7X2025 EURONEXT:AJ7X2025 EURONEXT:B16X2025 EURONEXT:B17X2025 EURONEXT:BC6X2025 EURONEXT:BC7X2025 EURONEXT:BC8Z2025 EURONEXT:FE6X2025 EURONEXT:MH7X2025
