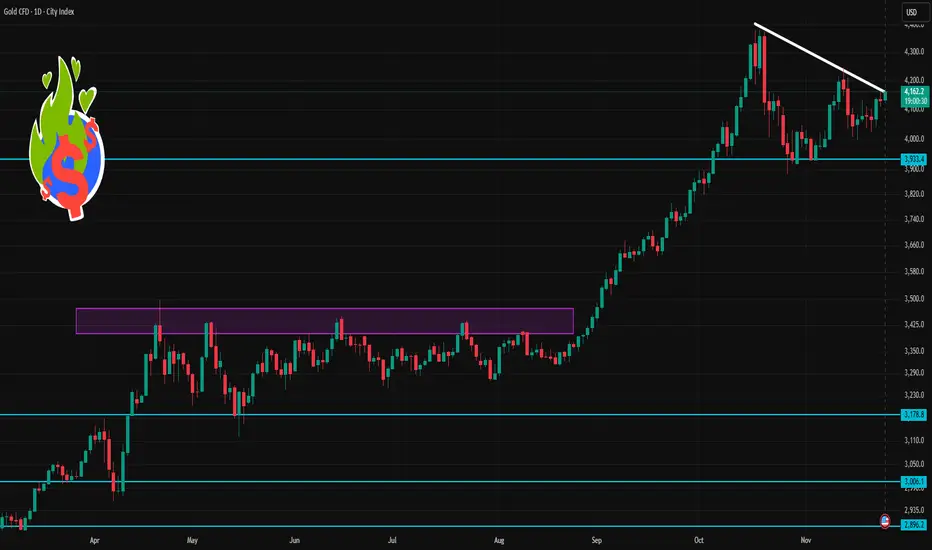
A Short Gold Sell Opportunity You Can't MissLooking at the chart, gold continues to move steadily within a clear downtrend channel, with each peak and trough forming progressively lower levels over time. Currently, the price is approaching the upper boundary of the channel and interacting with the same resistance area where sellers have stepped in multiple times before, forcing the market to reverse. This behavior strongly indicates that the potential for a continued corrective move downward, in line with the main trend, remains intact.
With this in mind, I believe a price decline toward the 4,080 level is a reasonable and logical target for the current correction. As long as the price hasn’t clearly broken through the upper boundary of the channel, I will continue to favor the scenario where the bearish trend remains dominant, viewing any upward movement as a mere pullback within the overall structure.
This is not financial advice, but simply my personal perspective based on the current price action.
Trade ideas

Gold Holds Near 2-Week Highs as USD Softens Ahead of Fed CutsGold continues to trade firmly near recent highs as the USD weakens amid growing expectations of a Fed rate cut in December.
The earlier pullback was mostly driven by stronger risk appetite in equities, not by gold weakness itself — meaning the macro bullish backdrop remains intact.
With markets now pricing:
76% chance of a December rate cut,
and almost 90 bps of cuts by end-2026,
the broader environment continues to favour upside on dips.
📊 Technical Outlook – MMF Style (H1/H2)
Price has respected the ascending trendline drawn from the early-week swing low and is now pushing above the 0.618–0.786 retracement zone.
Key Levels
BUY Zone 1: 4,132 – 4,149 (Fibo 0.382–0.618 + demand)
BUY Zone 2: Trendline retest area
Target Zone: 4,188 – 4,195 (1.272–1.618 Fibo extension)
Structure is currently bullish, with clear higher highs and higher lows.
A retracement into 4,14x before continuation higher is the most probable scenario.
🎯 MMF Trading Plan (Intraday)
Primary Setup – BUY Dip Continuation
BUY: 4,132 – 4,149
SL: 4,121
TP:
→ 4,168
→ 4,185
→ 4,192 – major extension target
Alternative Scenario – Break & Hold Above 4,170
If price consolidates above 4,170, expect a direct push toward 4,19x without a deep pullback.
Bearish Scenario (Low probability for now)
Only valid if price breaks below trendline + closes under 4,128.
Target would be a deeper correction toward 4,10x — but this is not the base case.
🧠 MMF View
Gold’s structure + macro narrative → bullish trend intact.
The market is clearly positioning ahead of possible December policy easing — dips into 4,13x–4,14x remain attractive opportunities.
“In a rate-cut environment, gold tends to trend — the only task is to buy from strength, not chase.”

XAU/USD: Gold Bullish, Watch for Pullback to 4,150-4,130⏰ Timeframe: 30m
📅 Update: 26/11/2025
🔍 Market Context
After a strong upward trend and breaking the resistance zone of 4,096 USD, gold enters a technical correction phase to reaccumulate liquidity.
The price is currently fluctuating around the 4,150 USD area, serving as a crucial pivot to confirm whether the bullish structure will continue or require a deeper retracement.
📊 Technical Structure
4,150 USD (Mid Support): quick reaction zone, potential for short-term buy orders (scalp).
OB (4,130 USD): priority BUY Zone, confluence with 0.5 Fibo – main rebalancing area.
Support Base (4,096 USD): Break–Resistance zone, maintaining the medium-term bullish trend structure.
Target Expansion: 4,181 → 4,202 → 4,211 → 4,235 – 4,242 USD.
💎 Key Levels
🟢 Support Zones:
• 4,096 USD – main structural base.
• 4,130 USD – main OB (priority BUY).
• 4,150 USD – intraday pivot, quick reaction for scalping.
🔴 Resistance Zones:
• 4,181 USD – short-term resistance.
• 4,202 USD – intermediate balancing zone.
• 4,211 USD – expansion zone (1.272 Fibo).
• 4,235 – 4,242 USD – extended supply zone (1.618), prone to profit-taking reactions.
🎯 Market Outlook
1️⃣ Priority Scenario:
– Price lightly pulls back to the 4,150 USD area, potential for quick reaction.
– If it breaks through 4,150, the 4,130 USD (OB) zone will be the balancing point for a stronger recovery.
– Expansion targets: 4,181 → 4,211 → 4,242 USD.
2️⃣ Secondary Scenario:
– If the price breaks below 4,096 USD, the short-term bullish structure becomes invalid, shifting to a neutral state.
🧠 Analyst’s View
4,150 USD is the "stepping stone" between the OB zone and short-term resistance – where the market decides to continue or accumulate deeper.
A reasonable strategy is to monitor quick reactions at 4,150 (scalp) and prioritize clear buy opportunities at 4,130 (OB) if the price retraces deeply.
🛡️ Risk Note
The market is rebalancing within an uptrend – avoid hasty actions without clear candle or cash flow confirmation.
Analysis is technical & educational, not investment advice.

LANA_M2 XAUUSD – WAIT FOR A PULLBACK TO BUY WITH THE UPTREND ...LANA_M2 XAUUSD – WAIT FOR A PULLBACK TO BUY WITH THE UPTREND
1. Fundamental Analysis
Gold continues its bullish momentum and has just formed a two-week high as expectations for an early FOMC rate cut strengthen.
Weaker U.S. economic data, cooling bond yields, and pressure on the USD are supporting gold, both from real-yield dynamics and safe-haven demand.
With this outlook, Lana prefers waiting for a mild correction before buying with the trend, instead of chasing buys at higher prices.
2. Technical Analysis
On the H1 chart, the market structure has shifted to bullish with consecutive BOS, confirming buyer control.
FVG demand zones around 4100 and 4080 are acting as support, aligning with key swing lows after BOS.
The upper zone around 4180–4200 is an FVG supply area and a premium/ resistance zone where price may react with a short-term pullback.
With Fibonacci confluence, 4103–4105 and 4086–4088 match the 50–61.8% retracement of the latest bullish leg — ideal for waiting for a pullback to buy.
3. Key Price Zones
Support / Discount (Demand & FVG):
4103 – 4105
4086 – 4088
Resistance / Premium (Supply & FVG):
4165 – 4194 – 4202
4. Trade Setups
⭐ Primary Scenario – Buy with the Trend
Buy entry: 4103 – 4105
SL: 3998
TP: 4115 – 4130 – 4165 – 4190
⭐ Alternative Scenario – Deep Buy at Lower FVG
Buy entry: 4086 – 4088
SL: 4080
TP: 4100 – 4125 – 4146 – 4170 – 4190
⭐ Short-term Reversal – Sell at Premium Zone
Sell entry: 4194
SL: 4202
TP: 4177 – 4150 – 4132 – 4110
👉 Follow Lana on TradingView to get the earliest gold analysis updates. 💛

Gold 1 Day Time Frame 🔎 Current Context
1. Gold currently trades around US $4,160–4,165/oz.
2. Many technical-analysis services show daily momentum as bullish: moving averages, RSI/MACD and other indicators point toward a positive bias.
3. But macro factors (strong USD, Fed policy, global risk sentiment) remain important and may cause sharp swings.
⚠️ What to Watch Out For
Volatility: Gold remains sensitive to macro events — USD strength, rate expectations, major economic data — so price can easily break support/resistance zones.
False Breakouts: Even if price crosses a level, it may revert quickly. Combine with other indicators (volume, price action, confirmations) before acting.
Trend Shifts: A major change in global risk sentiment or central-bank moves can rapidly change trend direction, invalidating technical levels.
XAU/USD: Gold Bullish, Waiting for Perfect Buy Pullback📊 Market Structure
Gold is maintaining a strong bullish structure after a series of BoS from the bottom region. The most recent rally broke the 4,130 mark and continues to hold above the small OB area, indicating that the BUY side is still in control.
Currently, the price is slightly retracing to retest the structure — the target is to test the area:
• OB 4,130 – 4,126 USD
• Or deeper to FVG 4,104 – 4,089 USD
In both cases, these are discount areas to continue BUYING according to the main trend.
The larger trend still targets the upper liquidity levels including:
• 4,151
• 4,181
• 4,207
• 4,243
💎 Key Technical Zones
• OB Retest Zone: 4,130 – 4,126 (quick bounce area)
• FVG Zone: 4,104 – 4,089 (best discount area to BUY)
• Large Bearish OB: 4,045 – 4,060 (final area if price adjusts deeply)
• Target Zones: 4,151 – 4,181 – 4,207 – 4,243
🎯 Trading Plan – BUY (priority)
1️⃣ BUY 1 – Retest OB 4,130
• Entry: 4,126 – 4,131
• SL: below 4,115
• TP1: 4,151
• TP2: 4,181
• TP3: 4,207
• TP4: 4,243
→ This is a quick setup – for a short retracement before continuing.
2️⃣ BUY 2 – FVG 4,104 – 4,089 (best)
• Entry: 4,089 – 4,104
• SL: 4,070
• TP1: 4,151
• TP2: 4,181
• TP3: 4,207
• TP4: 4,243
→ This FVG area is a strong confluence: fibo, small demand, and trendline.
3️⃣ BUY 3 – OB Bearish shift (deep entry)
• Entry: 4,045 – 4,060
• SL: 4,020
• TP1: 4,104
• TP2: 4,151
• TP3: 4,207
→ Only activate when the market shakes strongly, but RR is extremely good.
🎯 SELL Scalp (secondary – only short trades)
Only SELL when the price reaches strong resistance areas and rejection signals appear:
• 4,151
• 4,181
• 4,207
• 4,243
Entry SELL: only enter when there is H1 rejection
SL: 10–15 USD
TP: back to 4,151 → 4,130
→ This is counter-trend, not a priority setup.
🧠 Vincent’s View
The overall trend is still bullish. The current retracements are just a “breathing phase” – the market is accumulating energy to continue pushing up to higher liquidity areas.
As long as the price stays above 4,089 – the bullish trend is not threatened.
“Smart Money buys the dip — Retail buys the breakout.” ⚜️
⏰ Timeframe: 1H
✍️ Analysis by: Captain Vincent

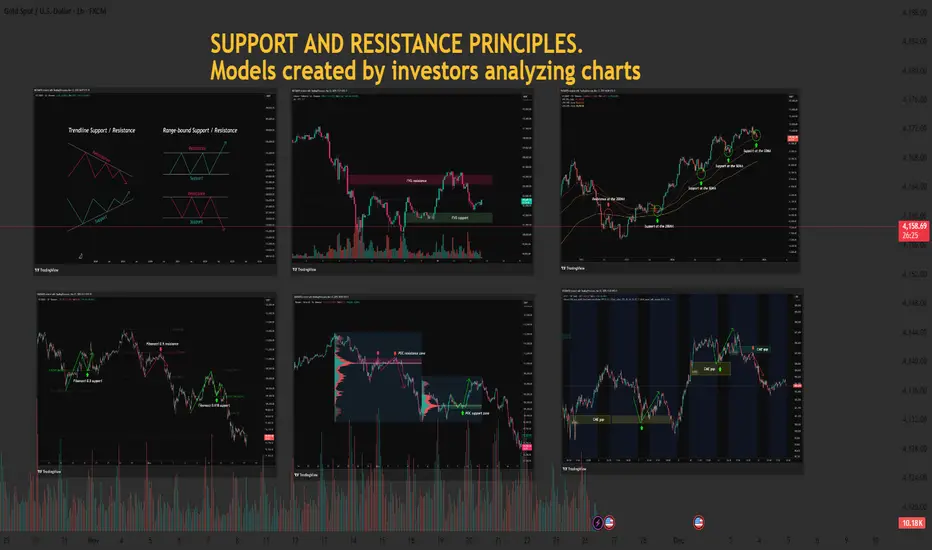
Essential Guide to Support and Resistance 1️⃣ The Importance of Support and Resistance in the Highly Volatile Crypto Market
- The cryptocurrency market operates 24/7/365 and shows significantly higher volatility than traditional financial markets. This volatility creates exceptional profit opportunities but also triggers intense fear and greed, placing substantial psychological pressure on traders.
- Support and resistance act as critical reference points within this chaos, highlighting areas where price is likely to react. Beyond technical analysis, they reflect the collective psychology of traders. Understanding them is essential for long-term success in crypto trading.
2️⃣ The Nature of Support and Resistance and Their Psychological Foundation
Support and resistance form where buying and selling pressures clash strongly enough to slow down or halt price movement.
Support:
At this level, buyers perceive the asset as “cheap enough” and are willing to enter, forming a psychological and structural barrier against further decline. Traders previously stuck in losing positions may sell at breakeven, adding layered reactions around these levels.
Resistance:
At this level, sellers believe the asset is “expensive enough” and reduce exposure, while trapped traders near the top may sell with a “better late than never” mentality, limiting further upward movement.
※ The Meaning of Breakouts and Fakeouts
- When support breaks, active buyers may panic and trigger stop-loss selling. Conversely, breaking resistance often invites aggressive buyers, accelerating the trend.
- However, many breakouts turn into fakeouts, designed to exploit trader psychology. Avoid jumping in too early without confirmation.
3️⃣ Key Support and Resistance Models Explained
📈 Trendlines & Accumulation Zones: Market Structure and Trader Expectations
- Trendlines visually represent collective expectations of future price direction.
- Touching an uptrend line triggers “buy the dip” psychology.
- Touching a downtrend line reinforces the belief that price “cannot move higher.”
- Accumulation Boxes mark areas where buying and selling pressures stabilize. Traders plan around these zones, driven by the mindset of “waiting for the breakout” to catch meaningful moves.
drive.google.com
📈 FVG (Fair Value Gap): Market Inefficiency & Smart Money Footprints
An FVG forms when price moves too quickly through a zone, leaving an unfilled “price gap.” These gaps often represent sudden activity from Smart Money (institutions, whales).
Gap Filling:
Markets naturally avoid leaving inefficiencies unresolved. When price returns to an FVG, the entities responsible for the original move may adjust or reopen positions, creating support or resistance.
Newer traders can observe FVGs as footprints of Smart Money and plan reactions accordingly.
drive.google.com
📈 Moving Averages (MA): Collective Sentiment & Trend Direction
MAs reflect the average price the market perceives over time. Because MAs are widely monitored, they naturally form psychological support and resistance.
Short-term MA (e.g., 50MA): Tracks short-term sentiment.
Price below → worry about trend weakening.
Price above → renewed optimism.
Long-term MA (e.g., 200MA): Represents long-term sentiment.
Price below 200MA → fear of prolonged downtrend.
Price above 200MA → hope for sustained bullishness.
When acting as support/resistance, MAs reflect strong collective agreement.
drive.google.com
📈 POC (Point of Control) – Volume Profile: Market Consensus & Volume Strength
POC is the price level with the highest trading volume within a given range — the market’s strongest consensus level.
Price below POC:
POC becomes strong resistance.
Buyers stuck in losing positions may sell at breakeven, strengthening resistance.
Price above POC:
POC turns into solid support.
Buyers believe price should not fall below this level.
POC often reflects the market’s “expected value” and the area where loss-aversion psychology is strongest.
drive.google.com
📈 Fibonacci: Natural Order & Human Expectations
- Fibonacci retracement applies golden ratio mathematics to charts, reflecting where traders expect reversals and forming support/resistance.
- These levels work not by magic but because many traders plan trades around them — collective behavior creates real reactions.
- Levels like 0.5 and 0.618 carry psychological significance, often seen as optimal buying or selling opportunities.
drive.google.com
📈 CME Gap: Institutional Movement & Mean Reversion Behavior
CME gaps occur in Bitcoin futures due to institutional trading hours. When spot price moves over the weekend while futures are closed, gaps form.
Gap Filling:
These gaps represent time periods without institutional activity, encouraging the market to “normalize” abnormal price areas.
Traders commonly expect gaps to be filled eventually, turning them into potential support/resistance zones.
drive.google.com
4️⃣ Managing Trading Psychology Through Support and Resistance
Even the best tools are useless without psychological discipline.
Confirmation Bias & Stop-Loss Discipline
- Ignoring losses due to selective perception leads to failure.
- When support breaks, accept the invalidation and exit decisively.
Overbought/Oversold Psychology & FOMO
- Avoid chasing price upward out of fear of missing out.
- In crashes, resist panic-selling at the bottom.
- Rely on your structured support/resistance rules.
Scaling Into Trades
- Avoid buying everything at one support level—or selling everything at one resistance level.
- Scaling entries across multiple levels increases psychological stability and reduces the impact of misjudgment.
5️⃣ Building a Complete Strategy & Practical Application Tips
Confluence Creates Strongest Levels
When multiple support/resistance signals overlap
(e.g., Fibonacci 0.618 + 200MA + POC + FVG),
these zones become significantly stronger because they reflect collective trader agreement.
Volume Confirms Support/Resistance Strength
High volume validates a level's importance.
A reliable breakout requires strong volume, showing clear market participation and intent.
Develop Your Own Trading Plan
Do not follow every model blindly.
Choose indicators and methods that fit your style, and create clear trading rules.
Discipline with your own system leads to psychological stability and long-term success.
Don’t forget to like and share your thoughts in the comments! ❤️
Elliott Wave Analysis XAUUSD – November 26, 2025
1. Momentum Analysis
D1 (Daily)
Daily momentum is deeply inside the overbought zone, meaning the probability of a bearish reversal is very high—possibly today or tomorrow. This upcoming downward phase will align with the next downward cycle of D1 momentum.
H4
H4 momentum is currently rising. Therefore, price may:
• Continue with another upward push, or
• Move sideways to push H4 momentum into the overbought zone.
H1
H1 momentum is preparing to turn downward, suggesting that a short-term bearish move on H1 may appear very soon.
________________________________________
2. Wave Structure
D1
The overall D1 structure remains unchanged from the previous plan.
The only difference is that D1 momentum has pushed deeper into the overbought region, increasing the likelihood of a reversal either today or tomorrow.
H4
Price is forming a green ABC corrective structure, and it appears price is approaching the final stage of wave C (green).
With H4 momentum turning upward, price may still produce:
• One more small push upward, or
• A mild sideways upward drift to complete wave C.
H1
On H1, price is forming a 5-wave structure (1–2–3–4–5, black). This creates two possible interpretations:
Scenario 1 (Primary Expectation)
This 5-wave pattern represents wave C (green) inside the ABC correction of wave 2 (red).
→ Since wave C is always a 5-wave structure, this scenario is fully consistent with Elliott Wave rules and remains our main working count.
Scenario 2
The 5-wave structure is actually the beginning of a new trend, potentially forming wave 1 of a larger bullish cycle.
Although there isn’t enough evidence to support this scenario yet, the mere presence of a clean 5-wave structure means we must keep this possibility in mind.
________________________________________
3. Relationship Between D1 Momentum & Wave Structure
The previous downward and upward swings inside wave Y (purple) on D1 correspond almost perfectly with the downward and upward cycles of D1 momentum.
D1 is now overbought and preparing to turn down.
➡️ Therefore, the upcoming corrective decline is extremely important.
Case 1 – Price holds above 4021
If D1 momentum reaches oversold territory and turns upward without price breaking below 4021, then:
• The current 5-wave structure may represent wave 1,
• The upcoming decline will be wave 2,
• When D1 momentum turns upward → wave 2 finishes.
Case 2 – Price breaks below 4020
If D1 momentum reverses upward from oversold but price breaks below 4020:
• The current 5-wave structure is wave C (green),
• Price will extend downward to complete wave Y,
• Wave Y completes when D1 momentum turns upward again.
🎯 In both scenarios, the next key move is still a downward leg.
________________________________________
4. Wave C Target Levels
Yesterday, two targets were provided:
• 4158
• 4184 – 4193
Price already hit 4158, then reversed strongly, producing 300 pips profit.
We now expect the remaining target 4184 – 4193 to act as the primary sell zone.
________________________________________
5. Trading Plan
📍 Sell Zone: 4184 – 4185
• SL: 4205
• TP1: 4123
• TP2: 4081
• TP3: 4020

WHICH SIDE TO CHOOSE TODAY — BUY OR SELL?1. Quick Market Context
PPI, Core PPI, and Retail Sales came in weak → low inflation → Fed may cut rates in December.
Price has broken out of the H4 accumulation zone → BUY bias for today.
Tonight we have Unemployment Claims → if the data is higher → XAU tends to continue rising.
✅ MAIN STRATEGY – BUY ON DIP
📌 All setups follow SL 100 pips – TP 100 pips
🎯 BUY ZONE 1 (Primary Entry)
4130 – 4136
→ Open BUY.
→ Retest zone after breakout.
→ SL: 10 pips | TP: 10 pips
🎯 BUY ZONE 2 (Major Support Zone)
4108 – 4113
→ Strong BUY zone.
→ If broken → deeper correction possible.
→ SL: 10 pips | TP: 10 pips
🔵 POTENTIAL BUY ZONES (SWING ENTRIES)
Use for bottom-picking with flexible RR (1:1, 1:2, 1:3, 1:4...)
4100 – 4102
4092 – 4094
4088
4060 – 4066
→ For swing setups: SL/TP depends on larger RR (not fixed 10 pips).
❌ SECONDARY STRATEGY – SELL REACTION (COUNTERTREND / QUICK SCALP)
📌 SELL setups also follow SL 10 pips – TP 10 pips.
🎯 SELL ZONE 1 (Strongest Reaction Area)
4192 – 4195
→ Short SELL for quick reaction.
→ SL: 10 pips | TP: 10 pips
🎯 SELL ZONE 2
4200 – 4202
→ Psychological resistance → SELL scalp.
→ SL: 10 pips | TP: 10 pips
🎯 SELL ZONE (Fibo Extension)
4180 – 4187
→ Short-term SELL for a small pullback.
→ SL: 10 pips | TP: 10 pips
🔶 BI / INVALIDATION ZONES
If price breaks these levels → short-term trend shifts:
Break below 4108 → BUY invalid → potential drop to 4100 / 4092.
Break above 4202 → SELL invalid → upside extension toward 4215 – 4220.
⚠️ Risk Management
Manage your capital strictly, observe market reactions, and adjust accordingly.
This plan is for reference only, not financial advice.
Trade responsibly.
Have a good day, guys!

Gold Trading Strategy for 26th November 2025✨ GOLD TRADING PLAN – INTRADAY LEVELS ✨
(Well-structured, step-by-step, visually segmented with icons & dollars as requested)
🟢 BUY SETUP – LONG POSITION
📍 Entry Condition:
Buy ONLY IF price breaks & closes above the High of the 1-Hour Candle = $4154+
📌 Clear Trade Logic:
Breaking the previous hour high indicates bullish strength & momentum. A candle close above confirms continuation and reduces false breakout probability.
🎯 Targets for Upside Movement:
Target No. Price Level
🎯 T1 $4168
🎯 T2 $4185
🎯 T3 $4199
🔒 Recommended Stop Loss (SL):
Below previous 1-hour support zone OR below breakout candle low
(This protects against fake breakouts)
🔻 SELL SETUP – SHORT POSITION
📍 Entry Condition:
Sell ONLY IF price breaks & closes below the Low of the 30-Minute Candle = $4106-
📌 Clear Trade Logic:
Break of intra-day support signals bearish pressure. A candle close confirms sellers are dominant and validates the downside.
🎯 Targets for Downside Movement:
Target No. Price Level
🎯 T1 $4090
🎯 T2 $4078
🎯 T3 $4060
🔒 Recommended Stop Loss (SL):
Above breakout retracement zone OR 30-min rejection high.
🧠 Trade Execution Notes (Very Important)
✔ Wait for candle close confirmation, not just wick breakout.
✔ Use proper risk-reward ratio (1:2 or better).
✔ Avoid overleverage & follow strict SL discipline.
✔ Volume confirmation strengthens signals.
✔ Check news & volatility (US data, Fed, Dollar index) 📊
⚠ DISCLAIMER (Mandatory)
This is not financial or investment advice. Levels are shared for educational & chart-analysis purpose only.
Trading in Gold/Commodities involves high market risk — decisions must be based on personal judgment, risk capacity & research.
The user is fully responsible for their trades.

Gold Analysis and Trading Strategy | November 25–26✅ From the 4-hour chart, gold is still in a post-rebound consolidation range. After quickly rebounding from the 4022 level, the price is currently running above the MA5 and MA10. Short-term bulls still have momentum, but the upside pressure remains strong. The price is fluctuating above the Bollinger middle band, and the bands are slightly narrowing, indicating the market is entering a range-bound consolidation phase.
✅ From the 1-hour structure, the market is in a bullish upward-shifting structure, with higher lows and higher highs. Although MA5 and MA10 show slight convergence, the price has moved back above the short-term moving averages, indicating that the bullish momentum is still dominant.
🔴 Resistance Levels: 4156–4160 / 4170–4180
🟢 Support Levels: 4110–4120 / 4070–4080
✅ Trading Strategy Reference
🔰 Focus on Shorting on Rebounds
📍 Sell lightly around 4156–4160
🎯 Targets: 4135 / 4120
⛔ Stop-loss: Above 4170
This zone is a strong H4 resistance area that has been tested multiple times without breaking, making it a priority area for short entries.
🔰 Buy on Pullbacks
📍 Consider long positions around 4126–4130
🎯 Targets: 4155 / 4160 /4170
⛔ Stop-loss: Below 4115
The H1 moving-average system provides clear support. As long as 4115 holds, the bullish trend can continue.
🔥Trading Reminder: Trading strategies are time-sensitive, and market conditions can change rapidly. Please adjust your trading plan based on real-time market conditions.
Gold H1 – Pre-NFP Liquidity Hunt as US–China Tone Warms🟡 XAUUSD – Intraday Smart Money Plan | by Ryan_TitanTrader (25/11)
📈 Market Context
Gold is approaching a key premium zone while markets react to fresh geopolitical headlines. Earlier today, Donald Trump confirmed he had a “very good call” with President Xi of China, highlighting strong bilateral relations and continued cooperation.
This matters for gold because:
• Warmer US–China relations often reduce geopolitical risk premiums, pressuring gold.
• The timing is critical: markets are entering NFP week, a period where institutions frequently engineer liquidity grabs.
• Traders may see a USD-supportive environment ahead of NFP, especially if risk sentiment stabilizes.
In short, gold is sitting in a zone where liquidity sweeps are highly probable before a larger move develops.
🔎 Technical Analysis (1H – SMC Structure)
• Market Structure
Price is climbing toward a major liquidity cluster around 4170–4172, aligning with previous equal highs and an unmitigated supply block.
Below, the FVG demand zone at 4102–4100 serves as today’s discount reaction zone.
• Premium Sell Zone (1H Supply)
4170 – 4172
• Buy-side liquidity sits above prior highs
• Clear premium zone relative to current swing structure
• Likely target for engineered sweep ahead of NFP volatility
• Discount Buy Zone (1H Demand)
4102 – 4100
• FVG imbalance + BOS origin
• Confluence with discount retracement levels
• Strong RR for bullish reaction after sell-side sweep
• Liquidity Map
• Buy-side: 4172 → 4180
• Sell-side: 4100 → 4092
Expect the classic SMC sequence:
Sweep → CHoCH → Displacement → Retest → Expansion.
🔴 Sell Setup – Premium Reaction
Entry: 4170 – 4172
Stop-Loss: 4180
Take-Profit:
→ 4138 (imbalance fill)
→ 4115 (mid-range liquidity)
→ 4102–4100 (discount zone retest)
📌 Must wait for liquidity sweep + bearish CHoCH on M5–M15.
🟢 Buy Setup – Discount Reaction
Entry: 4102 – 4100
Stop-Loss: 4092
Take-Profit:
→ 4135 (intraday reaction)
→ 4160 (premium edge)
→ 4170 (buy-side liquidity sweep)
📌 Valid only after sell-side liquidity is taken.
⚠️ Risk Management Notes
• Expect extra volatility as markets price in US–China optimism ahead of NFP.
• Liquidity traps are common during Asian/London sessions—wait for confirmation.
• Avoid taking positions inside the chop zone 4125–4150 without structure shifts.
• Treat both scenarios as liquidity plays, not trend continuation trades.
📝 Summary
Gold is approaching a major liquidity pocket as geopolitical sentiment improves following Trump’s positive call with President Xi.
With NFP approaching, institutions are likely to sweep liquidity above 4170 or below 4100 before establishing direction.
Key Levels Today
🔴 Sell Zone: 4170–4172
🟢 Buy Zone: 4102–4100
Prepare for the typical pre-NFP pattern:
Accumulation → Sweep → Displacement → Retest → Target.
📍 Follow @Ryan_TitanTrader for daily Smart Money updates.

Gold Maintains Bullish Momentum,Watching for Breakout Above 4150📊 Market Overview:
Gold is currently trading around 4140. Market sentiment remains tilted toward buying due to expectations of an upcoming Fed rate cut, while the USD shows mild weakening during the session.
📉 Technical Analysis:
• Key resistance: 4150 – 4162
• Nearest support: 4125 – 4130
• EMA: Price is above the EMA-09, indicating the bullish trend is still intact.
• Candlestick / Momentum:
– The 4150 zone is forming a strong resistance; H1 candles show upper wicks → short-term profit-taking pressure.
– If H1 closes above 4150 → gold may extend to 4175 – 4190.
– If it fails, price may retest 4130.
📌 Outlook:
Gold may continue rising if it breaks above 4150 with a confirmed candle.
Otherwise, if it cannot break 4150 in the next 2–3 H1 candles, the market could retrace to 4130 before rising again.
________________________________________
💡 Suggested Trading Strategy:
🔺 BUY XAU/USD
Entry: 4128 – 4132
🎯 TP: 40 / 80 / 200 pips
❌ SL: 4125

Part 2 Intraday Trading Master ClassMargin and Risk Management
Option buying requires no margin except the premium.
Option selling requires high margin because:
Risk is unlimited.
Exchanges demand safety.
Risk Management Rules
Never sell naked options without stop-loss.
Avoid selling during high volatility events.
Use spreads to reduce risk.
Position size properly—do not over-leverage.

XAUUSD – Bearish Reversal Setup Toward Liquidity TargetsChart Analysis
Your chart shows a potential bearish reversal on XAUUSD with a clear smart-money structure. Here’s the breakdown:
1. Market Structure
Multiple Breaks of Structure (BOS) and Change of Character (ChoCH) indicate a shift from bullish momentum to bearish intent.
Price made a final sweep / liquidity grab at the recent high before sharply dropping into your marked entry zone.
2. Entry Zone
The “ENTRY” mark aligns with:
A bearish mitigation zone from the last up-move
A distribution pattern forming (rounded top + BOS)
This suggests institutional selling activity.
3. Target One – 4,080.064
This level is a logical first target because:
It aligns with previous demand acting as newly created liquidity.
You expect a corrective pullback before continuation—your white zig-zag path reflects this.
4. Target Two – 4,040.652
A deeper liquidity pool and the next major imbalance area.
If price breaks Target One, momentum likely accelerates.
This is the main downside liquidity sweep zone.
5. Context
The shaded half-circle structures highlight swing points where price formed lower highs, reinforcing the bearish narrative.
The clean equal-lows and imbalances under price give strong bearish draw-on-liquidity.

LiamTrading – XAUUSD H1 | Gold forming Head–Shoulders Pattern...LiamTrading – XAUUSD H1 | Gold forming Head–Shoulders Pattern, waiting for pullback to POC for entry
Gold is completing the final bullish leg of the Head–Shoulders structure on the H1 timeframe.
Price has now reached the Fibonacci zone (both retracement + extension), which also aligns with a resistance cluster and the POC of the Volume Profile — so the current choppy reaction is completely normal.
My plan is to use this pullback:
→ prioritize short-term Buy entries following the current bullish leg,
→ then look for Sell setups at the strong resistance above.
Macro Background
Russia continues missile strikes on Kyiv right after the US–Ukraine reached a “19-point framework”, causing peace prospects to stall again.
However, secret negotiations among the US, Russia, and Ukraine in Abu Dhabi are still ongoing, though no major terms have been finalized.
With “war not stopping – negotiations not settled”, global risk sentiment remains tense.
This keeps medium–long-term demand for Gold strong.
But in the short term, price may still show wide swings around key technical zones before choosing a clearer direction.
H1 Technical Analysis – Head & Shoulders, Fibonacci, Volume Profile
The Head–Shoulders pattern is now clearly visible.
Price is currently in the right-shoulder completion phase, approaching upper resistance.
Gold at the moment is:
Hitting the Fibonacci retracement of the previous decline.
Also overlapping with the Fibonacci extension of the short-term bullish wave → high chance of reaction and volatility.
Below price, the 4090–4093 zone is a support/mini-POC area where Volume Profile thickens — ideal for a short-term Buy following the current bullish structure.
Above price, the 4185–4187 zone is a strong resistance cluster:
Confluence of potential right-shoulder top + old supply + Fibonacci extension.
This is the area I will prioritize for Sell setups once the pattern completes.
Notable Support/FVG zones:
4122–4116 (near support)
4169–4210 (mid-term FVG/resistance)
Reference Trading Scenarios
1. Buy with the current bullish wave (short-term)
Buy: 4091–4093
SL: 4085
TP: 4120 → 4145 → 4170 → 4190 → 4220
Logic:
Buy at the confluence support + small POC, taking advantage of the upward push completing the right shoulder.
Once the trade reaches +1R, shift SL to breakeven to protect capital.
2. Sell at the Head–Shoulders resistance zone (medium-term priority)
Sell: 4185–4187
SL: 4193
TP: 4170 → 4155 → 4130 → 4110
Logic:
This is a strong resistance zone overlapping the supply region and Fibonacci extension.
Only activate the Sell if H1/M15 shows clear rejection signals (pin bar, bearish engulfing, weak volume) around 4185–4187.
Additional Levels to Watch
Support – FVG: 4122–4116
Resistance – FVG: 4169–4210
Can be used for quick scalp opportunities, but the main scenarios remain:
Buy near 409x as long as major resistance hasn’t been touched.
Sell near 418x when the Head–Shoulders structure shows completion signs.

MARKET CONTEXT CHART H1 I 11/25Market Context (English Version)
Gold is still moving within a solid bullish structure, shown clearly through its sequence of higher-highs and higher-lows. Buying pressure remains dominant in the short term, but price is approaching the Supply Zone at 4,147 – 4,150, where profit-taking pressure may appear.
The Volume Profile reveals:
POC at 4,093 → This is the price level with the highest traded volume, showing strong agreement from both buyers and sellers.
VAH Zone 4,120 – 4,125 acts as soft resistance; if this zone holds after a pullback, the bullish trend remains intact.
VAL Zone 4,043 – 4,020, combined with the lower Demand Zone, forms a strong defensive layer for buyers if price makes a deeper correction.
Currently, price is running closely along the ascending trendline, signaling that buyers are still applying pressure. However, as price approaches the Supply Zone, the market may temporarily stall and create a technical correction.
Notable signals:
H1 candles show upper wicks, indicating that sellers are starting to react around 4,145 – 4,147.
The Volume Profile is heavier toward the upper range, suggesting the market may need a liquidity grab back toward the POC before continuing upward.
Overall:
➡️ The primary trend is still bullish.
➡️ But the market is likely in need of a pullback to accumulate more strength.
➡️ Only if price breaks below 4,093 will a deeper correction begin.
➡️ A break below 4,015 would confirm a full structural shift from bullish to bearish.
🟦 Scenario 1: Price continues upward – Breaks the Supply Zone (bullish continuation)
Conditions:
Price maintains the ascending trendline.
4,120 (VAH zone) holds and price bounces strongly.
Development:
Price retraces toward 4,120 – 4,093 (VAH & POC).
Strong buying absorption appears → forms a higher low.
Price pushes back up to retest the 4,147 Supply Zone.
If buyers dominate → break above 4,147 and extend toward 4,160 – 4,175.
Meaning:
The bullish trend remains intact. Buyers are fully in control.
🟧 Scenario 2: Deep correction before continuing upward (pullback to VAL Zone)
Conditions:
Price breaks the ascending trendline.
Buyers fail to defend VAH/POC and price loses 4,120.
Development:
Price breaks below 4,093 (POC).
Drops further toward 4,043 – 4,020 (VAL zone).
This is a strong prior demand level.
Price reacts at VAL → forms a new low → resumes bullish momentum.
Meaning:
Healthy correction. Market pulls back to gather liquidity before the next bullish leg.
🟥 Scenario 3: Bearish reversal – Break of Demand Zone
Conditions:
Price breaks below 4,043 – 4,015 (Demand + VAL).
Strong selling absorption overwhelms buyers.
Development:
Price falls through the Demand Zone.
Retests it, turning it into new Supply.
A medium-term bearish trend forms.
Downside targets:
4,000
3,985
3,970
Meaning:
Market structure breaks. Bullish trend ends, and a new bearish phase begins.

Swing Trading Secrets1. The Secret of Trend Recognition
The biggest secret of profitable swing trading is identifying the dominant trend of the market. Most novices try to pick tops and bottoms, but professionals follow the path of least resistance. Trend recognition means:
Uptrend: Higher highs (HH) + higher lows (HL)
Downtrend: Lower highs (LH) + lower lows (LL)
Range: Price oscillates between support and resistance
Swing traders do not predict; they react. They align trades with the existing trend.
For example:
In an uptrend, they wait for pullbacks to key levels.
In a downtrend, they short the rallies.
In a range, they buy at support and sell at resistance.
Knowing the trend keeps traders on the right side of probability.
2. The Secret of Patience and Timing
Effective swing traders don’t enter randomly. They wait for specific conditions:
A. The market must be near a key level
Trendline touch
Moving average support (e.g., 20-EMA, 50-EMA)
Fibonacci retracement (38.2%, 50%, 61.8%)
Previous swing high/low
Volume clusters
B. Price must confirm the reversal or continuation
Patience allows the market to “show its hand” before entering.
The secret: wait for the candle close, not the candle forming.
Many traders lose because they enter too early. Timing matters more than direction.
3. The Secret of Multi-Timeframe Confluence
Professional swing traders use multiple timeframes:
Higher timeframe (HTF): 1-week or 1-day → Trend direction
Trading timeframe (TTF): 4-hour or 1-day → Entry zones
Lower timeframe (LTF): 1-hour or 15-min → Entry trigger refinement
This is called top-down analysis.
If the weekly chart shows an uptrend, the daily chart shows a pullback, and the 4-hour chart shows a bullish reversal pattern, the probability of success becomes extremely strong.
Multi-timeframe alignment is a powerful edge.
4. The Secret of High-Probability Patterns
Swing traders rely on chart patterns—not lots of patterns, just a handful of powerful ones that repeat reliably.
A. Continuation Patterns
Bull flag
Bear flag
Ascending triangle
Descending channel
These indicate that the trend is likely to continue.
B. Reversal Patterns
Double top / double bottom
Head and shoulders
Morning star / evening star
Hammer / shooting star
C. Breakout Patterns
Cup and handle
Range breakout
Consolidation breakout
Professional traders focus on clean patterns. If the pattern is messy, overlapping, or unclear, they move on.
5. The Secret of Volume Analysis
Price shows direction; volume shows conviction.
High-probability swing trades usually show:
High volume on breakouts
Low volume on pullbacks
High volume on reversal candles
Volume spikes at support/resistance
Volume acts like a lie detector. If a breakout happens on weak volume, it is often a trap.
Understanding volume helps traders avoid false signals.
6. The Secret of Risk Management
Most swing traders fail not because their strategy is bad but because their risk management is weak.
Professionals follow these golden rules:
Risk only 1–2% of capital per trade
Always place a stop-loss
Size positions based on volatility
Avoid overtrading
Never increase lot size after a loss
The greatest secret:
Protecting capital is more important than making profits.
A trader who avoids major losses can survive long enough to catch big winning swings.
7. The Secret of Support & Resistance Mastery
Swing traders obsess over support and resistance levels.
These levels act as price magnets and turning zones.
Key levels include:
Previous swing highs/lows
Daily, weekly, and monthly levels
Psychological numbers (100, 500, 1000)
Fibonacci retracement levels
Supply and demand zones
Swing traders wait for price reactions at these levels and only trade when confirmation appears.
8. The Secret of Using Indicators the Right Way
Professional swing traders use indicators as confirmation, not decision-making tools.
Popular indicator combinations:
A. Trend + Momentum
50-EMA or 200-EMA + RSI
20-EMA + MACD
B. Pullback Identification
Bollinger Bands
Stochastic RSI
C. Breakout Confirmation
Volume + MACD
RSI breakout
The secret:
Use indicators sparingly—2 or 3 maximum.
Clear charts produce clearer decisions.
9. The Secret of Trading Psychology
Swing trading rewards emotional control.
Professionals master:
A. Discipline
Follow the plan strictly.
B. Patience
Wait for the best setups.
C. Emotional Detachment
React to charts, not feelings.
D. Consistency
A few high-quality trades outperform dozens of random trades.
The less emotionally involved a trader is, the better they perform.
10. The Secret of Journaling Every Trade
This is one of the most underrated secrets.
A trade journal includes:
Entry and exit
Stop loss
Chart screenshots
Reason for trade
Mistakes
Market context
Journaling forces self-reflection and dramatically improves discipline and performance.
11. The Secret of Avoiding News-Based Noise
Swing traders avoid making decisions during:
Major economic announcements
Earnings reports
Policy changes
High volatility events
News can create unpredictable spikes that damage swing positions.
Professionals stay defensive during such periods.
12. The Secret of Letting Winners Run
One of the greatest swing trading secrets is knowing when not to exit early.
Successful traders:
Trail their stop-loss
Add positions in trend continuation
Hold until target zones are met
Small losses and big wins create long-term profitability.
Conclusion
Swing trading appears simple but demands mastery of multiple elements—trend recognition, timing, patience, volume interpretation, chart patterns, risk management, and psychology. The real secrets lie not in magical indicators but in disciplined execution and consistent behavior. When traders combine technical analysis with emotional control, they unlock the ability to capture market swings with confidence and accuracy.

Gold comex bought at 4035 today booked at 4150 AI dat in descpt.Parameters Data
Asset Name Gold COMEX
Reason 🟩 Hypothetical price action mein DEMA support aur trend continuation dikh rahi hai.
R:R 🟩 1:1.14 (Risk reward T2 target ke liye theek hai.) / Threshold: Breakout above - & Breakdown below
Current Trade 🟩 BUY Active | T1: 4160.00, T2: 4180.00, T3: 4200.00 | SL: 4120.00
Probability 🟩 80%
Confidence 🟩 18/30 (Hypothetical technical structure strong hai.)
Price Movement Buy side: 4160.00, 4180.00, 4200.00. If break 4140.00 then downside possible towards 4120.00, 4100.00, 4080.00.
FNO Data (OI/PCR) 🟩 Hypothetical PCR Bullish hai.
Liquidity Zones 🟩 High Liquidity zone $4,140 - $4,160 ke beech.
Max Pain 🟨 $4,150 (Spot ke kareeb, consolidation dikhata hai.)
Gamma Exposure 🟩 Gamma positive territory mein.
Supports 🟩 S1: 4140.00 | S2: 4120.00 (20 DEMA) | S3: 4100.00
Resistances 🟥 R1: 4160.00 (Minor Resistance) | R2: 4180.00 | R3: 4200.00
DEMA Levels 🟩 20 DEMA: 4120.00 | 50 DEMA: 4100.00 | 100 DEMA: 4080.00
ADX/RSI/DMI 🟩 RSI (14) 65 (Bullish Zone). Strong momentum.
Market Depth 🟩 Buying pressure high hai.
Cross‑Asset Correlation 🟩 Hypothetically, Dollar/Yields weak honge.
COT Positioning 🟩 Managed money net long positions hold kar rahe hain.
Source Ledger 🟩 CME, Kitco, OANDA, TradingView (Based on hypothetical trend).

Gold Breaks Out of Consolidation, A New Bullish Cycle Incoming?Gold has shown a significant recovery, breaking out of the multi-day sideways range between 4,00x–4,10x. Instead of collapsing below 4000, strong buying pressure stepped in — pushing price back above 4100, signaling that the market may be choosing an early bullish breakout ahead of expectations for a potential FED rate-cut cycle.
📊 Technical Outlook (H1/H2)
1. Structure
Gold has officially broken out of the symmetrical triangle formation.
Price is now printing higher highs – higher lows, confirming short-term bullish structure.
2. Key Levels
BUY Zone 1: 4,095 – 4,100 (Fibo 0.236 + intraday demand)
BUY Zone 2: 4,118 – 4,122 (Fibo 0.382 + breakout retest zone)
Target Zone: 4,187 – 4,195 (Fibo 1.618 extension)
3. Expected Price Action
After rejecting the 0.786 Fibo, a corrective pullback is expected.
A retest of 4,118 or deep pullback to 4,095 is highly probable before the next bullish leg.
As long as price holds above 4,095, bullish bias remains intact.
🎯 Trading Plan — MMF Style
Primary Scenario – BUY the Retracement
BUY 1: 4,118 – 4,122
SL: 4,107
TP: 4,150 → 4,168 → 4,195
BUY 2 (safer): 4,095 – 4,100
SL: 4,082
TP: 4,150 → 4,170 → 4,195
If price clears 4,165, extended targets toward 4,19x–4,21x become possible.
Secondary Scenario – SELL only on strong rejection
Selling is not preferred in the current structure.
Only consider shorting if price forms a false breakout around 4,19x and confirms a bearish BOS on H1.
🧠 MMFLOW VIEW
Gold is showing early signals of shifting out of its medium-term downtrend and transitioning into a new bullish phase. With both technical breakout confirmation and fundamental support (rate-cut expectations) aligning, the path of least resistance is to the upside.
“In a rising market, missing the trend is far more costly than entering slightly early.”

Brian – Gold game plan for the US sessionBrian – Gold game plan for the US session
Gold’s rally yesterday shook a lot of traders out of position – the move was slow, steady and unforgiving, making it hard both to get in and to get out. For now, the short-term trend is clearer on H1, while H4 is still in transition.
Fundamental view – the Fed is confusing everyone
Fed expectations for December have been on a roller-coaster:
The market went from pricing a 25 bp cut in December at over 90%,
Then collapsed those odds to below 30%,
And has now swung sharply back again – all within about a month.
That kind of violent repricing in rate expectations usually creates two things for gold:
underlying support as soon as the market believes in easier policy again, and
choppy two-way volatility around each new data print or Fed comment.
So the macro backdrop still leans supportive for gold, but you do not want to ignore intraday whipsaws.
Technical view – H1 bullish, H4 testing the top of structure
On the H4 chart:Price is trading above the rising medium-term trendline from late October, keeping the broader structure constructive as long as 4,000 holds.
We are now pushing up towards the descending trendline and a H4 supply/FVG band between roughly 4,160 and 4,200.
Higher up sits a larger FVG / resistance block around 4,280–4,330 – if price ever accepts above the current downtrend line, that zone becomes a realistic upside magnet.
On H1:Structure is clearly bullish with higher highs and higher lows after yesterday’s impulsive move.
The current leg is extended, so I prefer to buy dips into support or a clean retest, rather than chase at the top of the candle.
Core bias: still prefer buys with the trend. Shorts are tactical, only at clear reaction zones.
Key levels
Resistance / sell zones
4,167–4,169: short-term reaction zone at the descending trendline and FVG
4,200–4,220: upper part of the same supply area
4,280–4,330: major H4 FVG / supply above
Support / buy zones
4,110–4,113: intraday support and potential retest area
4,080–4,070: minor support from recent consolidation
4,040–4,020: deeper pullback zone
4,000: key structural support; a break here would damage the bullish case
3,884: level that would confirm a medium-term bearish shift if price breaks and holds below
Trade scenarios (reference only, not financial advice)
Scenario 1 – Primary long: buy the dip into 4,110
Idea: stay with the bullish H1 structure, use the first decent pullback to get a better entry.
Entry: 4,110–4,113
Stop: 4,105
Targets: 4,125 → 4,140 → 4,180 → 4,200
I want to see price pull back into this zone after a push higher, ideally with a rejection wick or bullish candle confirming buyers are still in control.
Scenario 2 – Tactical short: fade the trendline at 4,167–4,169
Idea: counter-trend scalp from a clean confluence of resistance and FVG.
Entry: 4,167–4,169
Stop: 4,175
Targets: 4,155 → 4,140 → 4,120 → 4,105
This is not a swing short – it is a tactical trade against the intraday trend. Size should be smaller, and I would look to lock in profit or move to breakeven quickly if price reacts in our favour.
Scenario 3 – Breakout long if the trendline gives way
If gold pushes through the descending trendline and holds above the 4,170–4,180 zone:
I will shift back to a breakout-continuation mindset, looking to buy pullbacks above the broken trendline.
The next upside magnets then become 4,220 first and eventually the 4,280–4,330 FVG.
As long as 4,000 holds, I respect the upside and prefer to position with the trend, not against it. If we ever see a daily close below 4,000 and then 3,884, the whole story flips and I’ll start treating rallies as selling opportunities.
Trade the structure in front of you, not the headline noise. Manage risk around the shifting Fed expectations, and let the levels do the heavy lifting.
If this breakdown helps with your game plan, follow Brian for more gold updates during the US session and drop your own view in the comments so we can compare scenarios.

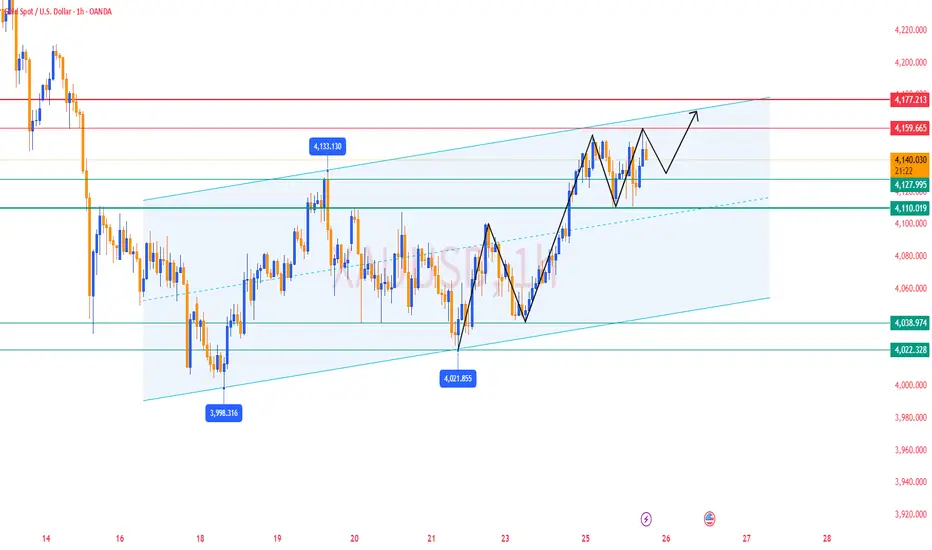
XAUUSD – TUESDAY BREAKOUT BUY SETUP, WATCH REACTIONS AT FIBO...💛 XAUUSD – TUESDAY BREAKOUT BUY SETUP, WATCH REACTIONS AT FIBO 1.618–2.618 🎯
🌤 Overview
Hello everyone, Lana here 💬
After spending several days compressed inside a triangle pattern, Gold has finally broken the descending trendline on H1, absorbed liquidity around the FVG zone, and continued to hold above the breakout area.
This shows that short-term bullish momentum is currently favored, with price targeting the higher Fibonacci extensions.
Today the market is waiting for major data releases: CPI, PPI, retail sales… These numbers can create strong volatility, especially when gold is in an “overcrowded trade” condition.
If US consumer data comes in strong, a deeper pullback may appear after a liquidity sweep.
💹 Technical Analysis (ICT Perspective)
On H1, price has:
Broken the descending trendline of the accumulation triangle.
Retested the FVG + liquidity repurchase zone around 4.101–4.105 and bounced back upward.
The 4.133–4.135 area, previously resistance, has now turned into support — a suitable zone for a buy-on-dip strategy.
Technical Targets:
Fibonacci Extension 1.618 of the current bullish leg is around 4.16xx.
Fibonacci Extension 2.618 + major liquidity pool sits around 4.23xx–4.24xx, aligning with previous highs — a zone where sellers may show strong reaction.
Overall, as long as price stays above 4.10–4.11, the short-term bullish structure remains valid.
🎯 Reference Trading Plan
💖 BUY Scenario – Priority with Trend
Buy on breakout – current price zone
Entry: 4.130–4.133
SL: 4.125
TP: 4.150 → 4.175 → 4.198 → 4.230
Buy on deeper retest
Entry: 4.100–4.103
SL: 4.095 (you may choose a tighter SL instead of 3.995 for better R:R)
TP: 4.125 → 4.150 → 4.175 → 4.198
💢 SELL Scenario – Only Short-Term Reaction at Resistance
Sell: 4.167–4.169
SL: 4.175
TP: 4.150 → 4.133 → 4.110 → 3.990
This Sell setup is only for short-term scalping against the trend — priority is to close quickly at nearby TP levels.
⚠️ Important Notes
Today includes CPI, PPI, retail sales and other US data — spreads may widen and price can spike both ways.
Gold is currently a crowded trade, so after strong rallies, deeper washout moves can occur to shake out weak positions.
Best strategy:
Prioritize Buy setups at confirmed support zones.
Reduce position size before major news; avoid holding heavy trades through data releases.
Treat Sell setups only as fast in–fast out scalps.
🌷 5. Conclusion & Interaction – With LanaM2
In summary, the breakout from the H1 triangle supports the scenario of Gold continuing upwards toward the Fibo 1.618–2.618 extension levels, as long as price stays above 4.10–4.11 💛
Today, focus on finding clean Buy entries instead of chasing price, and be cautious during CPI & PPI releases.
If you found this useful, please 💛 Like – 💬 Comment – 🔔 Follow LanaM2 to get daily Gold insights on TradingView ✨

Gold H1 – Will Economic Slowdown Trigger a Liquidity Sweep?🟡 XAUUSD – Intraday Smart Money Plan | by Ryan_TitanTrader (24/11)
📈 Market Context
Gold continues to move inside a tight compression range while markets react to new economic concerns raised by U.S. analysts.
According to today’s report, economists are increasingly worried about an unusual slowdown pattern in consumer behavior — spending remains high, but confidence and savings are weakening.
This mixed macro picture creates uncertainty:
🔹 Key takeaways from today’s news:
• U.S. consumers are still spending but confidence is deteriorating, a red flag for future growth.
• Economists warn this divergence could lead to slower economic momentum over the next quarters.
• Weakening sentiment → higher recession fears → typically supportive for gold after liquidity sweeps.
• However, short-term volatility remains high as markets reassess the sustainability of U.S. demand.
With uncertainty rising, institutions are likely engineering both-side liquidity grabs before committing to a directional move.
Gold is currently rotating between 4015–4100, respecting a clean SMC range structure.
🔎 Technical Analysis (1H / SMC Structure)
• Market Structure
Price is forming a descending compression pattern with repeated CHoCH signals, indicating engineered liquidity on both sides.
• Premium Sell Zone (1H Supply)
4100 – 4102
→ Overhead resting buy-side liquidity
→ Aligns with unmitigated internal supply + trendline liquidity
• Discount Buy Zone (1H Demand)
4015 – 4013
→ Inside the prior sweep zone
→ Confluence with ascending structure + BOS origin
• Liquidity Map
• Buy-side liquidity: above 4102 – 4110
• Sell-side liquidity: below 4013 – 4008
A sweep of either pocket is likely before real displacement.
🔴 Sell Setup (Premium Reaction Zone)
Entry: 4100 – 4102
Stop-Loss: 4110
Take-Profit Targets:
→ 4065 (imbalance fill)
→ 4040 (range midpoint)
→ 4018–4015 (discount retest)
📌 Execution Rule: Wait for liquidity sweep into the zone + bearish CHoCH on M5–M15.
🟢 Buy Setup (Discount Reaction Zone)
Entry: 4015 – 4013
Stop-Loss: 4008
Take-Profit Targets:
→ 4055 (short-term reaction)
→ 4080 (premium edge)
→ 4100 (sweep target)
📌 Valid only if price takes sell-side liquidity first and shows bullish displacement from discount.
⚠️ Risk Management Notes
• Market may react unpredictably to weakening U.S. consumer sentiment — reduce risk during spikes.
• Avoid trading inside the 4040–4070 chop zone unless a clean break or CHoCH forms.
• Treat both setups as liquidity–based plays, not trend continuation trades.
• Expect engineered manipulation during Asian session before London expansion.
📝 Summary
Gold remains trapped in a controlled SMC range as economic signals turn mixed.
With economists raising concerns about consumer–confidence divergence, gold may experience pre-breakout liquidity sweeps today.
Key Zones:
🔴 Sell Zone: 4100–4102
🟢 Buy Zone: 4015–4013
Expect the classic SMC sequence:
Accumulation → Sweep → Displacement → Retest → Target.
📍 Follow @Ryan_TitanTrader for more Smart Money updates.
