Instant BEARish Trade Any RISE above 4068 is SELL till 4072
SL at 4077.30
TP 1: 4061
TP 2: 4058
TP 3: 4053
Trade ideas

Gold H1 – Is This Just a Range or a Break Incoming?🟡 XAUUSD – Intraday Smart Money Plan | by Ryan_TitanTrader (21/11)
📈 Market Context
Gold continues to trade inside a compressed intraday range as markets react to the latest discussion on whether the Federal Reserve is likely to cut interest rates anytime soon.
According to new reports, policymakers remain cautious, and early rate-cut expectations are fading as inflation progress slows.
This shift pushes USD stronger, increases Treasury yields, and temporarily weakens gold’s bullish momentum.
Key takeaways from the news:
• Fed officials note that inflation is “still not where it needs to be,” reducing the probability of early rate cuts.
• Markets have scaled back expectations for a Q1 cut, keeping USD supported.
• Higher yields → tighter financial conditions → gold struggles to break premium levels.
• Institutions are likely engineering liquidity grabs on both sides before committing to a new directional move.
Price is currently sitting near the 4030–4045 zone, right above discount liquidity, waiting for a catalyst to break out of the short-term compression.
🔎 Technical Analysis (1H / SMC Structure)
• Market Structure:
Gold has completed a clear CHoCH + short-term bearish sequence and is now compressing into the discount zone around 4030.
• Premium Sell Zone (4H Supply):
4128–4130 aligns with unmitigated supply + buy-side liquidity resting above internal highs.
• Discount Buy Zone:
4030–4028 sits inside the last clean demand zone where a previous sweep occurred.
• Liquidity Map:
→ Buy-side liquidity: above 4128–4135
→ Sell-side liquidity: below 4028–4020
Institutions are likely to sweep one side before delivering direction.
🔴 Sell Setup (Premium Reaction Zone)
• Entry: 4128 – 4130
• Stop-Loss: 4140
• Take-Profit:
→ 4080 (minor imbalance fill)
→ 4045 (range EQ)
→ 4030–4028 (discount demand retest)
📌 Execution rule: Wait for liquidity sweep into the zone + bearish CHoCH on M5–M15 before entering.
🟢 Buy Setup (Discount Reaction Zone)
• Entry: 4030 – 4028
• Stop-Loss: 4020
• Take-Profit:
→ 4060 (short-term reaction level)
→ 4095 (inefficiency fill)
→ 4120 (premium retest)
📌 Valid only if price sweeps the 4030–4028 pocket and shows bullish displacement from discount.
⚠️ Risk Management Notes
• USD strength may spike unexpectedly as rate-cut bets fade — reduce position size during volatility.
• Avoid trading inside the 4045–4085 chop zone unless a clean structure break forms.
• Manage trades aggressively once liquidity levels are taken.
• Expect engineered manipulation during low-volume Asian hours.
📝 Summary
Gold is compressing inside a narrow intraday range as markets reassess the likelihood of Fed rate cuts.
SMC structure suggests a two-sided liquidity sweep before a decisive move:
• Sell Zone: 4128–4130 (premium supply)
• Buy Zone: 4030–4028 (discount demand)
Expect classic accumulation → sweep → displacement patterns until macro conditions create a new trend.
📍 Follow @Ryan_TitanTrader for more Smart Money updates.

XAUUSD – Where Smart Money Strikes Today🌐 MARKET CONTEXT
Gold enters today’s session after a period of controlled volatility, with price repeatedly reacting around key liquidity pockets but failing to produce a clean breakout. The M30 structure remains bearish, with price rejecting premium levels and forming consistent lower highs.
Recent Drivers
USD stays firm as markets maintain expectations of a slightly hawkish Federal Reserve
Traders await upcoming mid-week data → low conviction, cautious positioning
Overall sentiment remains neutral — no strong safe-haven pressures
Session Outlook
London Session: Likely to engineer early sweeps into premium supply zones
New York Session: Higher chance of real directional expansion
Bias: Bearish intraday until discount zones trigger a CHoCH (shift of character)
Price is currently inside mid-range, so the safest setups remain at extremes where liquidity is concentrated.
📉 TECHNICAL ANALYSIS (SMC + LIQUIDITY)
Market Structure
M30 Trend: Lower High → Lower Low sequence
Equilibrium zone: 4068–4085
Inducement layers resting above 4147 and 4081
Liquidity Levels
BSL: Above 4147 & 4081
SSL: Below 4033 & deep liquidity at 3993
Market continues printing engineered wicks, trapping impulsive traders
Imbalances
Bearish FVG: 4147–4148 → perfect for premium scalp sells
Minor imbalance: 4081
Discount inefficiencies near 4033 and 3993 → ideal buy setups
🔑 KEY PRICE ZONES (Strong Logic + Clear Explanation)
4148–4147 ▶️ Premium Liquidity Trap – High-Quality Sell Zone
This area holds an unmitigated bearish order block combined with buy-side liquidity.
Smart Money typically uses this zone to trap breakout buyers before reversing sharply.
4079–4081 ▶️ Secondary Premium Sweep Zone – Fast Rejection Expected
A mini liquidity pool just above equilibrium, designed for early-session stop hunts.
Often triggers sharp intraday reversals.
4035–4033 ▶️ Discount Reaction Zone – Clean Scalping Demand
This zone holds micro-demand + SSL resting below.
Expect low-drawdown reactions ideal for quick intraday buys.
3995–3993 ▶️ Deep Discount Liquidity Pool – High-Probability Reversal Base
A rich accumulation of Sell-Side Liquidity combined with HTF discount structure.
Strong reversal potential if price reaches this level.
⚙️ TRADE SETUPS (High-Precision SMC Execution)
✔️ SELL SETUP 1 – Premium Rejection Sell
Entry: 4148–4147
Stoploss: 4126
TP1: 4135
TP2: 4120
TP3: 4085
Logic: BSL sweep + bearish imbalance fill → sharp sell-off expected.
✔️ SELL SETUP 2 – Mid-Range Liquidity Sweep
Entry: 4079–4081
Stoploss: 4087
TP1: 4065
TP2: 4048
TP3: 4033
Logic: Quick liquidity hunt above equilibrium followed by displacement.
✔️ BUY SETUP 1 – Intraday Scalping Rebound
Entry: 4035–4033
Stoploss: 4027
TP1: 4048
TP2: 4070
Logic: SSL sweep → micro CHoCH → ideal for fast bullish reaction.
✔️ BUY SETUP 2 – Deep Discount Reversal
Entry: 3995–3993
Stoploss: 3987
TP1: 4010
TP2: 4040
TP3: 4070
Logic: Major discount zone + liquidity buildup → strong reversal potential.
🧠 NOTES / SESSION PLAN
Avoid mid-range trading — only trade at liquidity extremities
Expect London fake-outs; real movement likely in NY
Always wait for M5/M15 confirmation (CHoCH + BOS)
Avoid buying in premium areas; avoid selling in deep discount zones
Follow strict risk management — volatility may spike unexpectedly
🏁 CONCLUSION
Gold continues to hold a bearish intraday structure, favouring premium sell setups at 4147 and 4081.
Discount zones at 4033 and 3993 offer high-probability buy reactions and possible deeper reversals.
Trade with patience. Execute only at liquidity extremes.
Let Smart Money show its trap — then strike with precision.

#XAUUSDPlease stick to your strategies
Any resistance will lead to big losses
Never take revenge on the market if a loss is triggered
Close the trade if the channel ceiling is broken

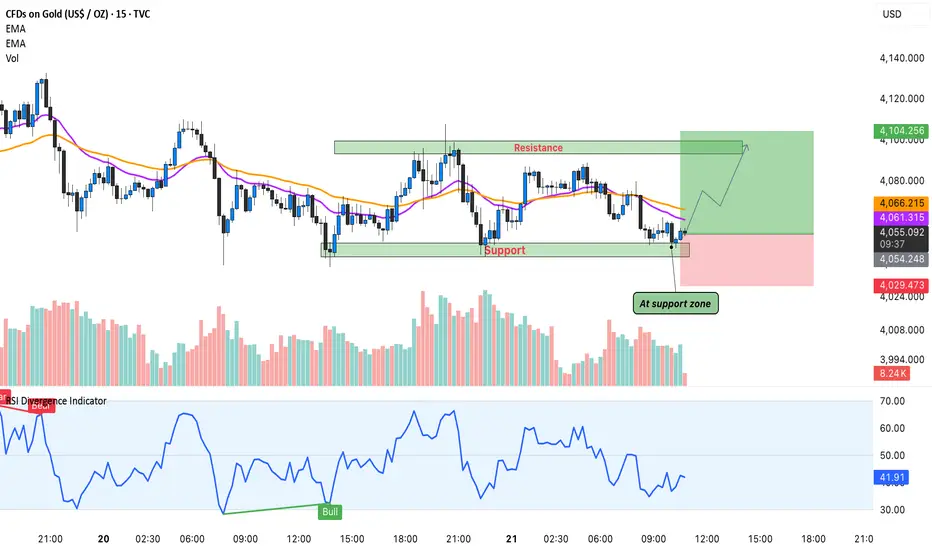
XAUUSD Bullish Retracement Setup from Support Zone Toward Key Re1. Market Structure
Price is currently trading near a major support zone (~4055–4060 area), highlighted in blue.
Multiple rejections from this zone in the past indicate strong buying interest.
The structure shows higher lows forming intraday, suggesting bullish pressure building.
2. Key Zones
🔵 Support Zone (Entry Region)
Marked around 4055–4060.
Price dipped into this zone and bounced, showing a potential demand area for long positions.
🔵 Resistance Level (First Target Region)
Around 4081–4098.
This is the first major resistance the price is likely to test after bouncing.
🔵 Final Target Zone
4120 area, the upper major resistance.
Previous highs around this level show strong selling interest historically.
3. Expected Price Movement
The chart suggests a potential bullish move:
Price bounces from the support (entry) area.
Climbs toward 4081 (minor resistance).
Retraces slightly.
Continues upward toward 4097–4100.
Final push toward 4120 target zone.
This is a classic retracement + continuation bullish structure.
4. Trade Idea
Bias: Bullish
Entry: 4055–4060 (support zone)
First TP: 4081
Second TP: 4097–4100
Final Target: 4120
Stop Loss: Below 4050 (beneath support zone)

Gold XAUUSD – Fresh Resistance Tested Twice, Bears Eye 4057 PullGold gave us a clean reaction today, rejecting the 4107–4110 supply zone not once, but twice. That double tap reinforced a fresh resistance band at 4087–4095, where sellers stepped back in with intention.
As long as 4012 holds on the upside, this resistance zone remains my short-term line in the sand. Any push back into 4087–4095 may attract renewed selling pressure, keeping the door open for a move toward 4057, with momentum potentially extending lower if sellers stay in control.
I’ll be watching how price behaves on each revisit—structure remains king.
Your feedback drives our content and keeps everyone trading smarter. Let’s make those pips together! 🚀
Happy Trading,
– The InvestPro Team

XAU/USD: Gold Set to Test Downtrend Line!⏰ Timeframe: 30m
📅 Update: 11/21/2025
🔍 Market Context
After adjusting from the 4,107 USD area, gold is moving sideways in the liquidity rebalancing zone – indicating a tug-of-war between the two sides.
The consecutive CHoCH – BOS movements forming around the 4,006 USD bottom show that buying pressure is starting to reappear.
The current decline seems to be just a correction phase, not yet showing enough signs of a complete reversal of the medium-term uptrend structure.
📊 Technical Structure
Downtrend line: continues to act as dynamic resistance – a confirmation area for the recovery trend if broken.
OB Bullish (4,006 USD): confluence with the previous liquidity bottom, is a potential BUY Zone.
Break–Resistance (4,045 USD): the first level to surpass to confirm buying pressure.
OB Bearish (4,086–4,107 USD): short-term supply zone – short-term SELL Zone, may witness profit-taking reactions if the price touches it.
🎯 Market Outlook
1️⃣ Priority Scenario:
– Price may retest the OB Bullish / BUY Zone (4,006–4,025 USD).
– When a clear upward reaction appears, gold is likely to break through the downtrend line, heading towards OB Bearish (4,086–4,107 USD).
2️⃣ Alternative Scenario:
– If the price does not hold the 4,006 USD area, the short-term structure will be invalidated, opening the possibility of retreating to a lower equilibrium area around 3,985 USD.
💎 Key Zones
BUY Zone: 4,006 – 4,025 USD → demand zone confluence OB + liquidity bottom.
SELL Zone: 4,086 – 4,107 USD → potential supply zone if the recovery trend is activated.
🧠 Analyst’s View
Gold is in a short-term accumulation state with signs of capital flow gradually leaning towards the buyers.
The retest phase of the 4,006 USD support area will be the key confirmation for a reversal – retest – continuation phase.
As long as the price stays above this area, the priority remains a buy-the-dip scenario in the short term.
🛡️ Risk Note
The market is operating in a "break or hold" zone – clear confirmation is needed before following the trend.
Analysis is for technical and educational purposes, not trading advice.

OVERVIEW GOLD CHART H1 11/21 🧭 1. CURRENT MARKET CONTEXT
Gold remains in a downtrend on the H1 timeframe, despite a minor rebound after the NFP release.
A sharp drop to 4,039 created a new low, followed by a weak recovery and sideways movement during the Asian session.
When the London session opened, price broke below the consolidation zone, confirming that sellers are still in control of the market.
Key highlights:
• The market remains bearish as long as price stays below 4,052–4,060
• Volume Profile shows VAL at 4,052 turning into a new resistance
• Intraday structure continues to form lower highs → maintaining the main downtrend
⸻
🔍 2. TECHNICAL ANALYSIS – H1
🔹 Trend overview
• H1: Clear bearish pattern with consecutive LL – LH.
Breakout from the Asian session sideways confirms the continuation of the downtrend.
🔹 Price action
• Asian session: Price consolidates after the sharp drop
• European session: Break below the sideways range → sellers continue to push
• All upward moves are just retracements – not a reversal
⸻
📌 3. IMPORTANT PRICE ZONES
🔥 Resistance zones (SELL priority)
• 4,040 – 4,052 → Strong intraday resistance
– Confluence of VAL, supply zone, and downtrend line
• 4,060 – 4,070 → For deeper pullbacks
🟩 Support zones (downside targets)
• 3,995 – 4,005 → Stronger support – extended target if selling momentum increases
⸻
🎯 4. TRADING SCENARIOS
🔻 Scenario 1 – Most important (priority)
SELL on pullback
If price retraces to 4,040 – 4,052 and shows rejection signals (M5/M15):
Sell zone: 4,040 – 4,052
TP: 4,025 → 4,010 → 3,995
SL: Above 4,060
🔻 Scenario 2 – Continuation after breaking the low
If price breaks 4,028 with a strong H1 candle close:
Sell continuation
TP: 4,010 → 3,995
SL: 4,045
🔻Scenario 3 – Only trigger on reversal structure
If price breaks & closes above 4,060, the structure weakens:
➡️Quick Buy: up to 4,075 → 4,092
(Only trade with strong signals – this is a counter-trend setup)
⸻
🥇 5. CONCLUSION
• Main trend: Down – SELL is preferred
• Best entry zone: 4,040 – 4,052 (strong confluence)
• Only Buy on a clear break above 4,060

Gold Drops to 4050 – Testing a Key Support Zone📊 Market Overview:
Gold continues to fall toward the 4050 region as the US Dollar strengthens and US bond yields edge higher, reducing safe-haven demand. The market is now awaiting clearer signals from the Fed minutes and upcoming US economic data, causing bullish momentum to weaken.
________________________________________
📉 Technical Analysis:
Key Resistance: 4072 – 4085
Stronger Resistance: 4095 – 4105
Nearest Support: 4055
Stronger Support: 4045 – 4040
EMA09: Price is trading below the EMA09 on the H1 chart → short-term bearish signal.
Candlestick / Momentum:
H1 candles continue forming lower highs, showing sellers are in control. Volume is gradually decreasing, indicating the market is waiting for a reaction at the 4050 support zone.
________________________________________
📌 Outlook:
• Gold may continue to decline in the short term if price breaks below 4045.
• Conversely, if gold bounces strongly from 4050 with a clear reversal candle, price could retrace toward 4072–4085, and may extend to 4095 if buying pressure strengthens.
________________________________________
💡 Suggested Trading Strategy:
🔻 SELL XAU/USD at: 4082 – 4085
🎯 TP: 40 / 80 / 200 pips
❌ SL: 4088
🔺 BUY XAU/USD at: 4040 – 4037
🎯 TP: 40 / 80 / 200 pips
❌ SL: 4035


LiamTrading – XAUUSD H1 | Gold breaks bullish structure...LiamTrading – XAUUSD H1 | Gold breaks bullish structure, short-term downside takes control
Gold has dropped sharply by more than $20 in a short time, losing over 1% on the day and moving close to the lower 4,030 area. The previous bullish structure has officially been broken, 4040 failed to hold, and today’s focus continues to be selling with the trend until the 4000–398x support zone shows clear reactions.
Macro Analysis
Gold prices declined as expectations for a December rate cut weakened: JPMorgan no longer forecasts a Fed rate cut in December, opposite to their earlier 25 bps cut scenario.
Some institutions still believe rising unemployment and weaker economic data may force the Fed to cut 25 bps at the upcoming meeting.
The market is currently pricing the probability of a December rate cut at nearly “50–50,” creating strong uncertainty and putting short-term pressure on gold, even though the metal still benefits in the long term if the rate-cut cycle begins.
Technical Analysis H1 – Bearish structure, price channel, and support zones
After breaking below 4040, price formed a series of Lower Highs – Lower Lows, confirming a Dow-theory bearish structure on H1.
A falling channel is forming; the channel’s upper boundary aligns with the short-term resistance zone at 4050–4060.
4000 zone: a key psychological support. If broken decisively, the medium-term structure may shift into a deeper corrective phase.
Buy Zone 3987–3989
Strong support confluence + Fibonacci extensions (1.618/2.272) of the current bearish swing
Optimal area for catching a corrective bounce if clear reversal signals appear
Key Resistance Levels Today
4052–4054: retest of former support + upper boundary of falling channel → ideal area for a pullback-sell setup.
Trading Scenarios Today (LiamTrading)
Scenario 1 – SELL with the prevailing downtrend (priority)
Entry: 4052–4054
SL: 4060
TP: 4030 → 4015 → 3990
Logic: Price retraces to resistance + channel top, suitable for trend-continuation selling. Prefer setups where M15 shows rejection candles (pin bar/bearish engulfing) around 405x.
Scenario 2 – BUY at strong support 398x (counter-trend bounce)
Entry: 3987–3989
SL: 3980
TP: 3999 → 4014 → 4040 → 4080
Logic: 398x is a high-confluence support zone; trigger only when clear price reaction appears (long lower wicks or reversal patterns on M15–H1).
This is counter-trend, so use smaller position sizes and take partial profits.
Risk Notes & Invalidation
H1 closes above 4060: short-term bearish structure weakens → pause all sell setups and reassess.
H1 closes below 3980: buy zone fails → downside could extend further; only sell setups preferred.
Always keep risk per trade at 0.5–1%, and once reaching +1R, move SL to break-even.
Are you leaning towards continuing to sell with the trend, or waiting to buy the dip at 398x?
Follow LiamTrading on TradingView for daily XAUUSD updates

XAU/USD Near Breakdown – Bears Eying Liquidity SweepGold remains under pressure after a stronger-than-expected NFP print reduced near-term Fed rate-cut expectations.
The USD stays moderately supported, while weak risk sentiment keeps gold in a cautious, defensive phase.
📊 Technical Snapshot (H1–M30)
Price continues to reject the descending trendline and the supply zone 4,054–4,078.
Lower highs structure intact → bearish momentum remains dominant.
Liquidity pockets sit at 4,013 and especially 3,989, a key downside magnet.
Any pullback toward 4,054 is likely just a retest before continuation lower.
🎯 MMF Intraday Plan
Primary Bias: SELL – follow the trend
Sell 4,054–4,078
SL: 4,090
TP: 4,013 → 3,989 → 3,975
Countertrend BUY (only at deep liquidity):
Buy 3,985–3,990
SL: 3,972
TP: 4,013 → 4,054
⚡️ MMF View
As long as price stays below the trendline and lower-high structure, gold remains in distribution.
A sweep of the 3,99x liquidity zone is highly likely before any meaningful reversal can form.

Gold’s Intraday Reversal – Buyers Stepping In!Hello Guy's Let's analyse Gold and it is once again respected the intraday support zone highlighted on the chart. This level has acted as a strong demand area multiple times, and today price reacted from the same zone with clear bullish intent.
Price is also sitting above EMA 20 & EMA 50, and the RSI bullish divergence confirms that momentum could be shifting back toward the upside.
If buyers hold this support, we can see a short-term push toward the 4,090–4,105 resistance region. A clean breakout above that may open more upside, but for now the focus remains on this bounce setup.
This is not breakout trading, this is simply reacting to a level where buyers have shown strength many times.
As long as this support holds, the risk-reward favors the bullish side.
Analysis By @TraderRahulPal | More analysis & educational content on my profile.
Elliott Wave Analysis XAUUSD – November 20, 20251. Momentum
D1:
The D1 momentum is turning upward, suggesting the market may see a mild bullish retracement or continue moving sideways within a narrow range.
H4:
H4 momentum is also preparing to turn upward. This indicates that today we may see a slight bullish push on the H4 chart, or price may continue to move sideways.
H1:
H1 momentum is preparing to turn upward, meaning we may see a small corrective bounce or continued sideways movement.
________________________________________
2. Wave Structure
D1:
Price is currently moving sideways with small candle bodies. Combined with rising momentum, this suggests the market may continue forming a short-range corrective bounce.
H4:
Our main expectation remains a 5-wave structure for wave Y (purple).
Currently, price may be:
• Entering the early phase of wave 3, or
• Still completing wave 2.
👉 A clear confirmation for wave 3 will only come when price breaks below 4001. At that point, we expect price action to turn fast and steep—characteristics of a true wave 3 decline.
H1:
I have temporarily labeled the current structure as a bearish wave sequence since our primary bias is a developing red wave 3.
In this scenario, price may already be in the early part of wave 3.
❗️If price breaks above the green wave 2 high at 4097, this wave count becomes invalid. It would mean the market is still in red wave 2, and I will update the plan if that happens.
________________________________________
3. Trade Plan
Sell Zone: 4093 – 4096
SL: 4016
TP1: 4000
TP2: 3885
TP3: 3746

XAU/USD: Gold's Final Correction Before a Strong Rebound📊 Market Structure – Elliott Wave + SMC
Gold has completed impulse wave 1–5 at the peak of 4,207 USD and is entering an Elliott correction phase in the form of ABC .
Wave A : bottomed at Demand Zone 4,008 – 4,020 USD
Wave B : retraced upwards, creating consecutive Equal Highs and small BoS but has not broken the larger structure
Wave C : is forming, may extend down to the Demand Zone if the price loses 4,030
SMC signals reinforce the scenario of a completed correction:
A series of Equal Lows → the market still has liquidity below to "sweep" towards the Demand Zone
The area BoS – 4,076 is the decisive structure: if not broken upwards, the correction trend continues
The area FVG + Resistance 4,152 USD is the target for a major retracement wave after completing wave C
=> In summary: the market is in the final phase of correction. Once wave C is completed, gold is likely to rebound strongly in the larger trend.
💎 Key Technical Zones
🔹 Demand Zone – Main BUY area
4,008 – 4,020 USD
→ Strong Demand confluence + Elliott wave C + liquidity below.
→ High probability of reversal.
🔹 Reaction Zone – Temporary reaction area
4,030 – 4,040 USD
→ If the price retraces early but hasn't swept the bottom → the correction may still continue.
🔹 Supply & FVG Zones (Strong resistance)
4,152 – 4,207 USD
→ Main target of the retracement wave after the ABC pattern is completed.
🎯 Trading Plan – Vincent’s Execution Map
1️⃣ BUY Setup – According to Wave C (top priority)
Wait for the price to complete wave C at the Demand Zone:
Entry: 4,012 – 4,020
SL: below 3,984
TP1: 4,076
TP2: 4,128
TP3: 4,152
TP4: 4,207
→ This is the main setup of the day, confluence of both SMC + Elliott.
2️⃣ BUY Aggressive – Early buy according to Break of Structure
If the price breaks BoS 4,076 before reaching Demand:
Entry: 4,070 – 4,076
SL: 4,040
TP: 4,128 – 4,152 – 4,207
→ Setup for those who want to catch the impulsive wave early.
3️⃣ SELL Scalp – Small trend (not the main trade)
Only enter when the price retraces to Fibo:
Entry: 4,092 – 4,106
SL: 4,116
TP: 4,040 → 4,020
→ Short-term scalp, aiming to complete wave C.
🧠 Vincent’s View
The overall trend still leans towards Bullish Reversal after correction.
As long as the price holds Demand Zone 4,008 – 4,020 , gold can rebound strongly back to the target of 4,152 – 4,207.
“Liquidity always shows the way – patience is the real advantage.” ⚜️
⏰ Timeframe: 1H
📅 Updated: 21/11/2025
✍️ Analyzed by: Captain Vincent

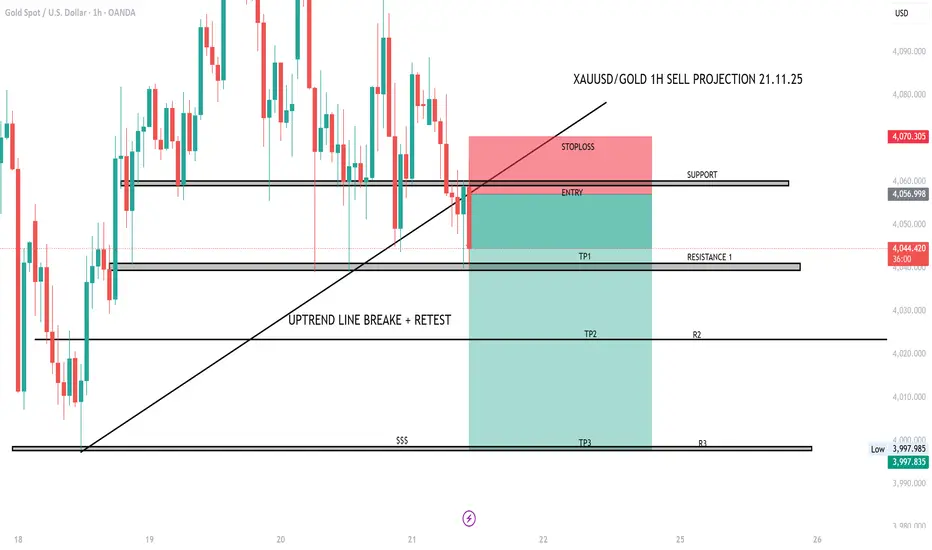
XAUUSD/GOLD 1H SELL PROJECTION 21.11.25XAUUSD / GOLD 1H SELL projection based on the chart you uploaded:
✅ Overall View
The chart shows a confirmed uptrend line break + clean retest, which is a strong bearish signal on 1H timeframe. Your setup is technically correct and follows proper structure.
📉 SELL SETUP ANALYSIS
1. Entry Zone
Your entry is placed exactly at the support → turned resistance zone after the trendline break + retest.
This is a smart location because:
Price rejected the retest
Previous support is now acting as resistance
Weak bullish candles on retest confirm sellers are active
🛑 Stop Loss
Stop loss is placed above the retest wick, which is correct.
Because:
If price moves above this, structure becomes bullish again
SL protects you from fake breakout
🎯 Targets
TP1 – Resistance 1 (Now Support Zone)
Good first target. High probability area where price may react.
TP2 – R2
This level has strong confluence:
Previous consolidation zone
Fresh liquidity area
High chance price may reach here if bearish momentum continues.
TP3 – R3 (Final Target)
This is your deep liquidity zone ($$$).
Smart money usually reaches this zone after trend reversal.
⭐ Trade Quality Rating: 9/10
Reasons:
Trendline break + retest = strong confirmation
Clean structure
Proper RR setup
Logical TP placements
SL placed safely
📌 Suggested Trade Plan
Enter only if candle closes below your entry zone again
Book partial profits at TP1
At TP1: move SL to breakeven
Let runner hit TP2 / TP3
Advanced / Premium-Level PatternsWhy Chart Patterns Work Universally
Human psychology doesn’t change.
Market cycles repeat.
Patterns reflect economic behaviour.
Institutional buying/selling creates recognizable structures.
Liquidity zones attract predictable reactions.

XAUUSD–FRIDAY BEFORE PMI: MAINTAINING HEAD AND SHOULDERS PATTERN💛 XAUUSD – FRIDAY BEFORE PMI: MAINTAINING HEAD AND SHOULDERS PATTERN, WAITING TO BREAK RANGE 4132–3998 🎯
🌤 1. Overview
Hello everyone, it's Lana here again 💬
Today is the last Friday of the week, the market is waiting for PMI and preparing to enter a phase with a lot of important data in December.
Meanwhile, BTC has been rising faster than XAU in recent weeks, indicating that speculative money is leaning towards crypto, while gold is temporarily moving sideways accumulating.
The US Department of Labor will release the November employment report on December 16, which is 6 days after the December Fed meeting. In other words, the Fed is in a "blackout" state regarding labor data for nearly another month – this forces the market to price in advance, making gold's volatility range wide but lacking a clear trend.
💹 2. Technical Analysis – Range & Head and Shoulders Pattern
On the H3/H4 frame, gold is fluctuating within the large range of 4132 – 3998.
The price wave is gradually narrowing towards the end of the triangle, represented by:
Lower highs,
Higher lows,
→ When one of the two boundaries is broken, a new trend is likely to explode in the direction of the breakout.
The inverse Head – Shoulders – Head pattern has not been broken:
Left shoulder – Head – Right shoulder are all above the rising trendline.
For the final wave of the pattern to follow the rhythm, the price needs to confirm surpassing 4109:
When closing a candle above 4109, the short-term uptrend is confirmed,
At that point, gold can aim for higher liquidity areas such as 4132 → 4145 → 4200.
Conversely, if gold breaks 3998, this will be both:
breaking the range bottom,
and negating the Head and Shoulders pattern,
→ opening the possibility of a deeper decline to the 3960–3920 area.
🎯 3. Reference Trading Scenarios
💖 BUY Scenario – following the pattern & range bottom support
1️⃣ Buy at support 3998–4000
Entry: 3998–4000
SL: below 3990 (depending on risk management)
TP: 4025 → 4040 → 4078
2️⃣ Buy when confirmed above 4109
Condition: Price closes a candle above 4109, confirming the Head and Shoulders pattern is maintained.
Entry: around 4100–4105
SL: 4090
TP: 4132 → 4145 → 4200
💢 SELL Scenario – trading the upper boundary of the range
Sell: 4130–4132
SL: 4138
TP: 4110 → 4095 → 4070 → 4045
Selling should only be considered as scalping against resistance within the range, not the main trend if the Head and Shoulders pattern is still valid.
⚠️ 4. Notes & Risk Management
Range 4132–3998 is still controlling the market:
Above 4109 → prioritize Buy according to the short-term uptrend.
Below 3998 → consider shifting bias to Sell following the breakout.
PMI, Fed expectations, and upcoming employment data may trigger unexpected volatility, therefore:
🌷Gold is at the intersection of technical patterns and macro stories 💛
Be patient and wait for reactions at 3998 and 4109, as these are the two key points that determine whether we enter a new upward wave or a deeper decline.
💛 Like – 💬 Comment – 🔔 Follow LanaM2 to follow gold with me every day ✨

XAU/USD: Gold Adjusts, Awaiting Fibo 4,092 Confirmation📊 Market Structure
Gold is moving in the ABC–D–E adjustment pattern after a strong decline from the peak. Current structure:
Wave (C) peaks at the 4,128 – 4,130 USD region and strong selling pressure appears.
The price then creates a temporary bottom (D) but does not touch the Demand Zone at 4,007 USD, indicating the BUY side still has strength.
Currently, the price is in a small upward adjustment phase to form wave (E).
Key points:
The major trend still leans towards an increase as long as the bottom at 4,007 USD is not broken.
The BUY side is looking for a complete structure to continue pushing up to the FVG region.
💎 Key Technical Zones
1. Fibo Retracement Zone — 4,092 USD
Confluence region of:
Fibo 0.5 – 0.618
Adjustment structure (small wave)
→ Suitable for light SELL scalp, according to candle reaction signals.
2. FVG Zone — 4,128 – 4,151 USD
This is a large FVG region, coinciding with the market's "loss cost."
If the price pushes up as expected in wave (E), this is the main SELL region of the day.
3. Supply Zone — 4,207 – 4,210 USD
Extremely strong region, if the price breaks the FVG, it will move to this region.
This is the extended target for the BUY side if the market rises strongly.
4. Demand Zone — 4,007 – 4,020 USD
The strongest liquidity bottom region of the session.
If the price breaks 4,092 and does not maintain structure, gold will retest this region before a major increase.
🎯 Trading Plan – According to the current chart
1️⃣ SELL Scalp – Main scenario
Wait for the price to retrace to the Fibo 4,092 USD region and observe the reaction:
Entry: 4,092
SL: 4,105
TP1: 4,075
TP2: 4,060
TP3: 4,030 (lower FVG)
→ This is a short-term scalp order, suitable for the current weak market.
2️⃣ SELL Setup – FVG Zone
If the price breaks 4,092 and runs up to FVG:
Entry: 4,126 – 4,151
SL: 4,160
TP1: 4,092
TP2: 4,060
TP3: 4,030
→ This is the best SELL region of the day.
3️⃣ BUY Setup – Demand Zone
Only activate if the market drops deeply:
Entry: 4,020 – 4,007
SL: 3,995
TP1: 4,060
TP2: 4,092
TP3: 4,128 – 4,151
→ Buy according to the major trend when the price reaches the liquidity bottom region.
🧠 Vincent’s View
The current market is in a controlled adjustment phase.
Priority:
✔ SELL scalp at 4,092
✔ Beautiful SELL at 4,126–4,151
✔ BUY only activates when reaching 4,020–4,007
The major trend is still waiting to complete the wave pattern to push up to the Supply Zone 4,207 USD.

XAUUSD 15M | MSS Break + FVG + OB + Fibonacci Retracement (FRL)
XAUUSD – 15M ICT/SMC Analysis
Price grabbed internal liquidity ($) and created a clean MSS (Market Structure Shift).
After the shift, price retraced into the discount zone, aligning perfectly with key SMC levels:
🔹 FVG – Fair Value Gap
Price filled imbalance and respected the gap.
🔹 OB – Bullish Order Block
Strong reaction from the order block confirms smart money involvement.
🔹 FRL – Fibonacci Retracement Level
FRL represents the 38.2%–50% Fibonacci retracement, the ideal ICT pullback zone after MSS.
This is where high-probability buy setups form.

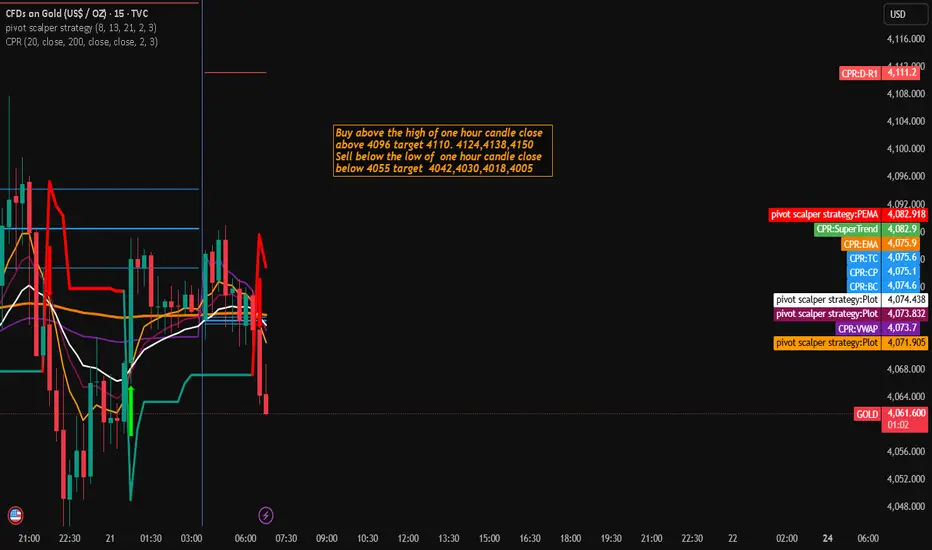
Gold Trading Strategy for 21st November 2025📈 BUY SETUP (Long Position)
➡️ Condition to Enter Buy:
Enter a BUY only if the 1-Hour candle closes above the high of 4096.
This confirms bullish momentum and reduces false breakouts.
🎯 Buy Targets:
TP1: $4,110
TP2: $4,124
TP3: $4,138
TP4: $4,150
🛑 Recommended Stop Loss:
Place SL below the breakout candle low or ≈ $4,085–4,088 based on your risk comfort.
📝 Reasoning:
A strong close above $4096 indicates buyers gaining control.
Targets move in 14–16 point intervals, ideal for intraday or short swing trades.
📉 SELL SETUP (Short Position)
➡️ Condition to Enter Sell:
Enter a SELL only if the 1-Hour candle closes below 4055.
This signals bearish continuation.
🎯 Sell Targets:
TP1: $4,042
TP2: $4,030
TP3: $4,018
TP4: $4,005
🛑 Recommended Stop Loss:
Place SL above the breakdown candle high or ≈ $4,062–4,067 depending on volatility.
📝 Reasoning:
A close below $4055 confirms downside pressure.
Targets decrease in 12–15 point steps, matching typical gold volatility on breakdowns.
🧠 TRADING TIPS
Always wait for candle close confirmation, not wick break.
Use 1–2% risk per trade to avoid major drawdowns.
Check news events (FOMC, CPI, NFP) before entering any trade.
Watch market structure on 15m for refined entries.
⚠️ DISCLAIMER
This analysis is for educational & informational purposes only.
It is NOT financial advice, and trading involves high risk.
You are responsible for your own trading decisions.
Always do your own analysis and use strict risk management.