XAUUSD DECISION POINT: hold for longs or break for shorts XAUUSD is currently retesting a major weekly level after a strong bullish push, and this area will decide the next directional move. I’m watching for price to reject this resistance zone and pull back into the trendline/structure support—if we see bullish rejection there, longs remain in play toward the 4,330 region. However, if price breaks and closes below the trendline and key support area, that would invalidate the bullish structure and open clean downside continuation into lower levels. Pure price action: reaction at this weekly level will guide whether gold continues its climb or shifts into a deeper correction.
Trade ideas

GOLD preparing for a big move. gold is trading in close consolidation range. wait for a break out or break down with price action for entry.

XAU/USD – Gold Accumulating Before Rising, Monitor BUY at📊 Market Structure
Gold is in an accumulation phase after a short-term drop creating ChoCH at lower price levels.
The current structure shows that the price has formed an Equal High (EqH) around 4,235 – a sign that the market may be holding liquidity above to support the next push.
The price returns to test the area 4,192 – 4,193 USD — this is the nearest support zone, and also the point where previous buying pressure created an upward BoS . If this area continues to hold, the short-term upward structure will be reactivated.
💎 Key Technical Zones
• Support Zone (Buy Zone): 4,192 – 4,193 USD
• Invalidation: below 4,170 USD
• Target 1: 4,237 USD
• Target 2: 4,249 USD
• Target 3: 4,264 USD
• Target 4: 4,284 USD
• Liquidity Zone: 4,323 USD
🎯 Trading Plan – BUY Priority
1️⃣ BUY Setup – Retest Support 4,192
If the price retests the area 4,192 – 4,193 and a bullish candlestick signal appears (rejection / engulfing):
• Entry: 4,192 – 4,193
• SL: 4,170
• TP1: 4,237
• TP2: 4,249
• TP3: 4,264
• TP4: 4,284
• TP5: 4,323 (sweep liquidity EqH)
→ This is a setup in line with the short-term trend, as liquidity above the EqH peak remains and is likely to be swept.
2️⃣ SELL Scalp – For Intraday Traders Only
If the price retests higher resistance zones and reacts with a strong decline:
• Waiting SELL Zone:
– 4,249
– 4,264
– 4,284
• Short TP: back to 4,225 – 4,216
→ This setup only trades against the trend when clear rejection is observed.
🧠 Vincent’s View
The current trend still supports the continuation of the upward expansion.
The 4,192 USD area is crucial: holding this area → prioritize BUY; losing this area → the market will need to sweep deeper before rising again.
⚡ “Follow the liquidity — the market always returns to collect what it left behind.”
⏰ Timeframe: 1H
📅 Update: 03/12/2025
✍️ Analysis by: Captain Vincent

XAU/USD: Buy Gold at 4,217 or FVG 4,182!📊 Market Structure
Gold continues to maintain a strong upward structure after creating a series of BoS continuously from the 4,156 USD region.
This morning's H1 breakout pushed the price above the short-term peak, confirming that the BUY side is in full control.
The price is currently returning to retest the Demand intraday 4,217 – 4,210 USD area — this is the first support area where buyers can continue to push the upward wave.
If the pullback is deeper, gold may reach the FVG 4,182 – 4,172 USD area, coinciding with fibo 0.5 – 0.618 → the most attractive discount area in this wave.
The main trend remains bullish as long as the price stays above:
• 4,217 – Demand 1
• 4,182 – FVG Discount
• 4,156 – Key Demand Zone
💎 Key Technical Zones
• Demand Zone 1: 4,217 – 4,210
• FVG Discount: 4,182 – 4,172
• Strong Demand (structure holding bottom): 4,156
• Target Zones:
– 4,285
– 4,309
– 4,321
– 4,342
– 4,369 (liquidity above peak)
🎯 Trading Plan – Prioritize BUY
1️⃣ BUY 1 – Retest Demand 4,217
When the price touches 4,217 – 4,210 with confirmation signals (long wick, H1 engulfing).
• Entry: 4,217 – 4,210
• SL: below 4,200
• TP1: 4,285
• TP2: 4,309
• TP3: 4,342
• TP4: 4,369
→ Quick setup – follow the momentum.
2️⃣ BUY 2 – Deep Pullback to FVG 4,182
In case the price shakes strongly before continuing to push the wave.
• Entry: 4,182 – 4,172
• SL: below 4,156
• TP: 4,217 → 4,285 → 4,342
→ This is the “best” price area to accumulate BUY in the session.
🧠 Vincent’s View
H1 shows a strong upward structure, clear momentum. The current adjustment is just a technical pullback before hitting the upper liquidity levels.
As long as gold stays above 4,182 – the trend remains bullish and the targets 4,285 – 4,342 are entirely feasible.
“Smart money buys the dip — not the hype.” ⚜️
⏰ Timeframe: 1H
📅 Updated: 01/12/2025
✍️ Analysis by: Captain Vincent

XAUUSD/GOLD 1H BUY PROJECTION 02.12.25“Gold is currently reacting strongly from the premium weekly support zone.
A clear bullish engulfing candle has formed at the bottom, indicating strong buying pressure.”
Next:
Price was moving inside a parallel downtrend channel, but
The bearish structure has now broken, confirming a potential trend reversal.
The market has also broken the trendline, showing strong momentum from buyers.
After breaking the trendline, price is expected to:
Retest the break level (support turning from resistance).
Continue bullish towards Resistance R1 around 4228–4232.
If momentum holds, the move may extend towards Resistance R2 at 4255–4260.
This structure aligns with a clean liquidity grab, followed by trend reversal and bullish continuation.
🎯 Key Points (Easy to Explain on YouTube)
✅ Premium Weekly Support Zone Hit – strong reversal area
✅ Bullish Engulfing Formed – confirmation of buyer strength
✅ Downtrend Channel Broken – trend reversal confirmation
✅ Expecting Retest → Buy Continuation
🎯 Target 1: Resistance R1 (4230 level)
🎯 Target 2: Resistance R2 (4260 level)
⛔ Stop Loss: Below Weekly Support Zone (around 4185)
📌 Summary for Your Video / Telegram Post
“Gold is showing a strong bullish reversal from the premium weekly support zone.
A bullish engulfing followed by a clean trendline break confirms a potential buy setup.
As long as price holds above the retest zone, we expect upside targets towards 4230 and 4260.”
If you want, I can also prepare:
✔ YouTube Title + Description
✔ Thumbnail text (big bold letters)
✔ Short-form script (30–45 sec)
✔ Hashtags
✔ PDF or PNG formatted analysis
Just tell me “make title, description & thumbnail” and I’ll generate it.

XAUUSD GOLD Analysis on (27/11/2025)#XAUUSD UPDATEDE
Current price - 4157
Best Buy Area - 4131-4129 (Stop loss -4110)
BUY TARGET - 4175-4191

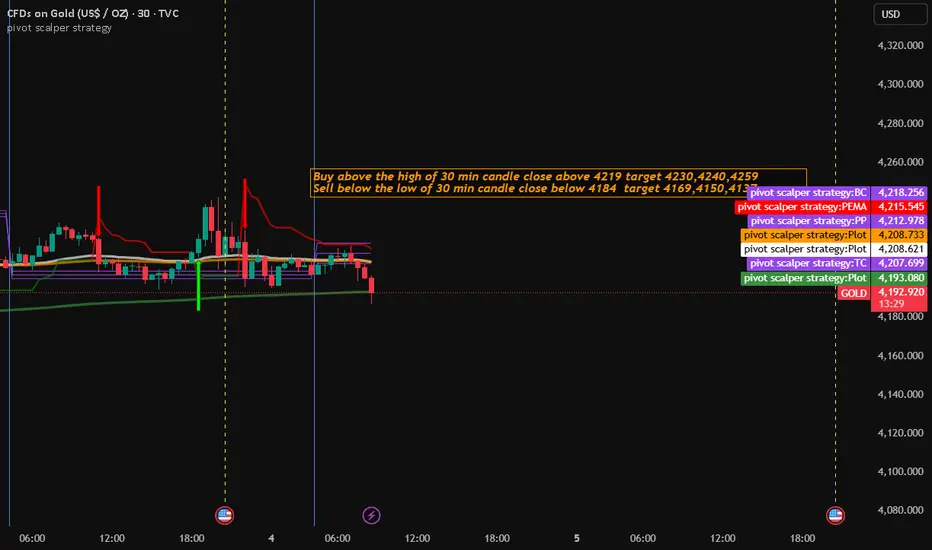
Gold Trading Strategy for 04th December 2025🟡 GOLD Trading Plan (30-Min Strategy)
📈 BUY Setup
Buy Above: High of 30-min candle closing above $4219
🎯 Targets:
TP1: $4230
TP2: $4240
TP3: $4259
🛑 Stop Loss: Below the breakout candle
🔄 Trade Management:
After TP1 is achieved, move SL → Cost + $1
📉 SELL Setup
Sell Below: Low of 30-min candle closing below $4184
🎯 Targets:
TP1: $4169
TP2: $4150
TP3: $4137
🛑 Stop Loss: Above the breakdown candle
🔄 Trade Management:
After TP1 is achieved, move SL → Cost + $1
⚠️ Disclaimer
This information is for educational purposes only and not investment advice. Trading in commodities involves risk; always use proper risk management and trade at your own discretion.
Gold Trading Strategy for 03-12-2025📈 GOLD Trading Levels – One Hour Candle Strategy
🟢 BUY Setup
Buy Above: ⬆️ Break & Close above $4229
Entry Trigger: Wait for 1H candle to close above the level
Targets:
🎯 $4240
🎯 $4252
🎯 $4265
Sentiment: Bullish continuation if price sustains above breakout zone.
🔻 SELL Setup
Sell Below: ⬇️ Break & Close below $4185
Entry Trigger: Wait for 1H candle to close below the level
Targets:
🎯 $4170
🎯 $4157
🎯 $4140
Sentiment: Bearish pressure expected if price maintains below breakdown zone.
⚠️ Disclaimer
This analysis is for educational and informational purposes only.
It is not financial advice.
Trading involves significant risk, and you should consult your financial advisor before making any investment decisions.
You are responsible for your own trades. 📉📊

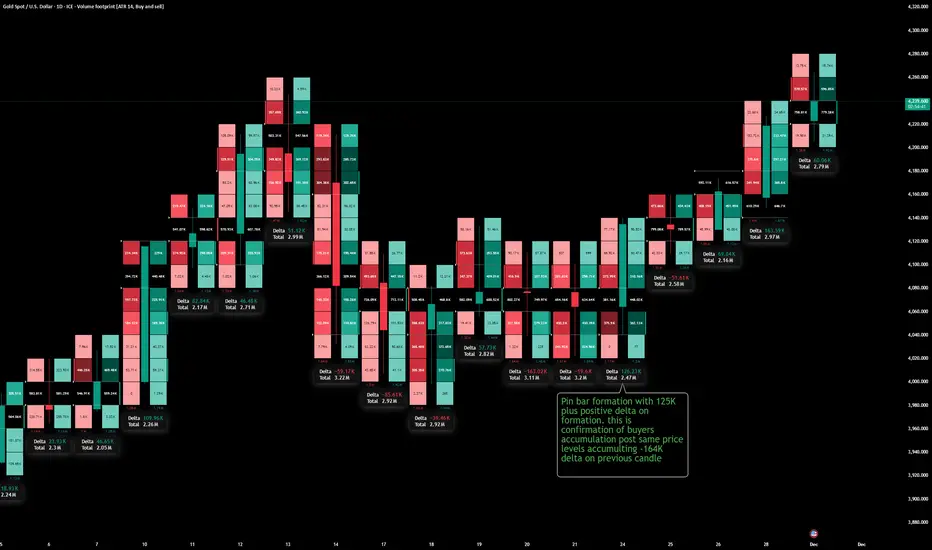
Positive Delta Formation time to buy at dips again. XAUUSDThis footprint shows aggressive sellers getting absorbed, then buyers stepping in and reversing the auction, confirmed by a change in delta and a bullish pin bar structure.
What delta is showing
- Each candle’s delta is buy volume minus sell volume, so negative delta = aggressive selling at the bid, and positive delta = aggressive buying at the offer.
- When you see a series of candles with heavy negative delta at similar prices but price is not breaking lower, it often means sellers are getting absorbed by passive buy limits sitting in the book.
Reading your highlighted zone
- The previous candle has a strongly negative delta (around −164K), meaning aggressive sellers hit the bid hard at those same price levels but could not push the market down much further, which hints at seller exhaustion or absorption.
- The next candle forms a pin bar with a long lower wick and flips to a solid positive delta (around +125K), meaning that after sellers tried again at the lows, aggressive buyers lifted the offer and reclaimed the range, trapping late shorts in the wick.
Logical order‑flow narrative
- Step 1: Into the low, repeated negative delta shows traders selling aggressively, but the lack of fresh lows means big passive buyers are absorbing that flow at the bid (large negative delta, small net progress in price).
- Step 2: On the pin bar candle, sellers again attack the same prices, but this time buyers respond even more aggressively, flipping delta positive and bidding price back above the prior traded cluster – that’s buyer accumulation at the same levels where sellers just loaded up.
- Step 3: Once price lifts, those trapped sellers must buy back to exit, adding fuel to the upside; the following candles keep printing higher with mostly positive or improving delta, confirming that control has shifted to buyers and the move is likely to continue.
How to trade this logic
- Treat “big negative delta at lows + no breakdown” as a potential trap/absorption zone, then look for the next candle to show a clear rejection wick plus a decisive flip to positive delta as entry confirmation for longs.
- Manage risk just below the pin bar low (where sellers failed), and only stay in the trade while subsequent footprints keep showing supportive or at least non‑bearish delta; if price makes new highs on weakening or negative delta, start expecting profit‑taking or a possible stall.
XAU/USD – Gold Retests Bullish OB, Preparing for a Major Recover📊 Market Structure
After the Liquidity Sweep around the 4,26x highs, Gold shifted into a short-term distribution phase and formed a series of bearish ChoCHs.
However, the entire current decline remains a corrective move, as price is now approaching the Bullish Order Block at 4,155 – 4,158 USD, which is also the primary support of the prevailing trend.
The ascending trendline has not been fully broken → buyers still have structure support.
The main scenario: price may continue sweeping deeper into the Bullish OB, or even tag the Deep OB at 4,129 – 4,130 USD, before initiating a strong bullish recovery.
💎 Key Technical Zones
Bullish OB: 4,155 – 4,158 USD → primary BUY zone
Deep OB: 4,129 – 4,130 USD → safer BUY zone (deep retest)
Bearish OB: 4,211 – 4,213 USD → short-term SELL reaction
Liquidity Above: 4,239 – 4,240 USD
🎯 Trading Plan – Two Clear Scenarios
1️⃣ BUY Setup – Trend-Following Priority
When price taps the Bullish OB 4,155 – 4,158 and prints a clear rejection candle:
Entry: 4,155 – 4,158
SL: 4,128
TP1: 4,188
TP2: 4,211
TP3: 4,239
TP4: 4,260+
→ A trend-aligned setup: low risk – high reward.
→ If price does not react at the Bullish OB, wait for a deeper BUY at the Deep OB (safer).
2️⃣ SELL Scalp – For Intraday Traders Only
If price retraces into the Bearish OB 4,211 – 4,213 and shows rejection:
Entry: 4,211 – 4,213
SL: 4,225
Short TP: 4,188 → 4,175
→ This is only a reaction play. Do NOT hold long-term since the main trend remains bullish.
🧠 Vincent’s View
Gold is likely in its final corrective phase before starting a new bullish leg.
As long as 4,129 remains intact, buyers maintain full control.
Smart money is likely accumulating around the Bullish OB before pushing price back toward 4,239 – 4,260.
⚡ “Smart money always returns to where strength began — buy where the market was born.”
⏰ Timeframe: H1
📅 Updated: 04/12/2025
✍️ Analysis by: Captain Vincent


XAUUSD – Healthy Correction, Favour Short-term Sells & Buy at...✨ XAUUSD – Healthy Correction, Favour Short-term Sells & Buy at POC
Gold has just tapped a new high around 4,264 — the highest level in six weeks — and is now entering a technical correction phase.
Liquidity on the sell side has been tested, but the medium-term uptrend remains intact, so my plan is to trade both directions:
Sell short-term when price retraces into supply
Buy again at the POC zone, where buying interest is likely to return
🎯 Scenario 1 – SELL at the POC Zone 4.236–4.238
Sell: 4.236 – 4.238
SL: 4.244
TP: 4.220 – 4.202 – 4.180 – 4.145
On the H1 chart, 4.236–4.238 is the POC area + the volume distribution top, aligning with the upper boundary of the small consolidation after the steep rally.
If price retests this region, I prioritise a scalping sell along the ongoing correction, targeting:
4.220 – 4.202: short-term support
4.180 – 4.145: deeper support, confluence with the major ascending trendline
This setup goes against the medium-term uptrend, so I keep position size small and use a firm SL at 4.244.
⭐ Scenario 2 – BUY at the POC Buy Zone 4.156–4.158
Buy: 4.156 – 4.158
SL: 4.150
TP: 4.175 – 4.190 – 4.225 – 4.250
The 4.156–4.158 zone is the POC Buy area, with:
Confluence of the ascending trendline
The accumulation zone before price broke out toward 4.26x
If gold pulls back deeply and forms a strong reaction (pin bar, long wick, rising buy volume), I consider this a good DCA opportunity following the medium-term uptrend, targeting 4.19x – 4.225, and higher toward 4.25x.
1. Fundamental Context
Gold and silver continue to benefit from expectations of upcoming Fed rate cuts, a weakening USD, and signs of a slowing US economy.
Gold has gained +6% in November, marking the 4th consecutive positive month, and is up over 60% YTD — on track for its strongest annual performance in 46 years.
Economic and geopolitical uncertainty continues to push flows into safe-haven assets, with silver additionally supported by industrial demand — indirectly strengthening sentiment toward precious metals.
Key events on 02/12:
08:00: Fed Chair Jerome Powell speaks
22:00: Fed Governor Bowman testifies before the House Financial Services Committee
Both events may trigger strong intraday volatility, especially if the Fed’s tone deviates from the market’s “dovish expectations”.
2. Technical & Market Sentiment Outlook
After the vertical rally to 4.26x, gold is sliding inside a descending channel on H1, reflecting short-term profit-taking pressure.
Sell POC 4.236–4.238 is where sellers are defending aggressively — every retest brings visible supply.
Buy Zone POC 4.156–4.158 is where buyers previously absorbed large sell orders before pushing price upward; this zone will likely be defended to protect the medium-term uptrend.
Current sentiment:
Short-term: Sellers have the edge due to profit-taking after a new high
Medium-term: Capital still prefers gold, so I avoid turning fully bearish unless 4.145 breaks decisively
3. Action Plan
Short-term Sell if price retests 4.236–4.238
SL: 4.244
TP: 4.220 – 4.202 – 4.180 – 4.145
Buy again at 4.156–4.158 if a strong reaction appears
SL: 4.150
TP: 4.175 – 4.190 – 4.225 – 4.250
Keep risk per scenario at 1–2% of your account
Never widen the SL when the market goes against your position
During Powell/Bowman speeches, reduce lot size or stay out to avoid getting hit by sudden spikes

XAUUSD Gold Long IdeaI’m expecting Gold to move toward the $4,240 level. The stop loss should be placed below the swing low at $4,162, maintaining a risk-to-reward ratio of 1:3.

Gold 1H – Can 4265 Breakout or Trap Into 4185?🟡 XAUUSD – Intraday Smart Money Plan | by Ryan_TitanTrader (02/12)
📈 Market Context
Gold continues its impressive rally as markets price in a potential rate cut by the Federal Reserve in December. Spot gold recently surged — reflecting multi-week highs — as the US Dollar Index (DXY) weakened. The backdrop is increasingly dovish: fading USD strength and rate-cut odds have kept gold bid.
From a technical perspective, price sits compressed at the channel top, signaling liquidity plays before the next institutional leg. Macro tone from Powell’s opening remarks on ForexFactory adds volatility fuel.
🔎 Technical Framework – Smart Money Structure (H1)
Current state = Accumulation / Distribution within rising channel
Liquidity zones & key triggers
• Premium liquidity zone (sell-opportunity): ~4265–4267 (upper-edge pool of liquidity)
• Discount liquidity zone (buy-origin / re-entry zone): ~4186–4184 (demand liquidity near prior displacement base)
• Equilibrium / chop zone: mid-channel compression → no blind trading unless structure validates direction
Expected Smart Money sequence
Sweep → CHoCH/MSS → BOS → Displacement → FVG/OB Retest → Expansion
Gold remains primed for a directional move only after structure confirms intent.
🎯 Trade Plans for Today
🔴 SELL GOLD 4265 – 4267 | SL 4275
• Thesis: Liquidity sweep above equal highs at premium edge, followed by engineered bearish BOS confirming institutional selling intent.
• Entry rules (must wait for confirmation):
✔ Price pokes 4266 zone → bearish CHoCH/MSS + BOS down (M5–M15)
✔ Entry on FVG fill or OB retest after BOS validation
• Targets:
1. 4245 – 4240 (first reaction)
2. 4225 – 4215 (channel EQ retest)
3. 4186 – 4184 (full delivery into discount)
🟢 BUY GOLD 4186 – 4184 | SL 4176
• Thesis: Discount liquidity tap at institutional base, buy absorption after sweep + bullish BOS signaling new intraday demand.
• Entry rules (must wait for confirmation):
✔ Price sweeps 4185 → bullish CHoCH/MSS + BOS up (M5–M15)
✔ Entry on rejection wick + FVG fill or OB retest confirmation
• Targets:
4. 4215
5. 4240
6. 4265+
⚠️ Risk Management & Notes
• Avoid trading inside mid-range without CHoCH/BOS validation — sweeps are traps until proven by MSS + BOS.
• Use SL for structure invalidation only — no averaging in compression.
• Reduce lot size during Powell’s delivery window; macro impulses can run both sides of liquidity fast.
📍 Summary
Gold is coiling at highs for liquidity. Either Powell triggers a 4266 sweep → bearish BOS → delivery, or price hunts 4185 discount → bullish BOS → continuation.
Trade the structure, not the narrative — wait for CHoCH & BOS + retest to unlock expansion.
📌 Follow @Ryan_TitanTrader for daily Smart Money updates.

XAUUSD – Potential Reversal Zone Forming After BOS & CHoCH StrucChart Analysis
Based on the structure shown in your TradingView screenshot:
1. Market Structure
The chart shows a clear bullish trend leading into the current price.
Multiple Break of Structure (BOS) marks confirm buyers have been in control.
The earlier CHoCH indicates a temporary shift, but price reclaimed bullish momentum afterward.
2. Current Zone
Price has pushed into a potential reversal or supply area, shown by the shaded region around the “ENTRY” label.
This suggests you are planning a sell (short) position from that zone.
3. Premium/Discount Logic
Price is currently in the premium zone of the swing leg.
The “50% TP” line marks the midpoint of the recent bullish impulse—typical target when expecting a corrective move.
4. Short Setup Elements
Entry: At the top of the shaded zone (likely an imbalance or order block).
Stop-Loss: Presumably above the swing high inside the grey shaded area.
Take-Profit: At the 50% retracement of the previous impulse, which aligns with structure.
5. Momentum & Candlestick Behavior
The latest candles show slowing momentum into your entry zone—wicks and smaller bodies indicate weakening buyer pressure.
This supports the idea of a potential short-term reversal.
6. What Would Invalidate the Setup?
A decisive close above the upper boundary of the shaded zone → would signal continuation upward and invalidate the short.
7. What Strengthens the Setup?
Rejection wicks
Bearish engulfing from the entry zone
Lower time-frame BOS to the downside as confirmation

What do you think about gold’s movement today?Hello traders!
What do you think about gold’s movement today?
Market Context
This morning, the Fed Chair delivered a speech without mentioning any economic updates. Despite that, gold still showed a corrective move, indicating that the SELL side remains dominant at the moment.
Main Strategy for Today
🔴 Prefer SELL setups
Stop selling only if price breaks above 4,246 — a key level defended by sellers.
Consider SELL entries at the previous high 4,265.
Additional SELL reaction zone to watch: 4,227 – 4,225.
BUY on deeper pullbacks
Ideal BUY zone: 4,194 – 4,190
BUY zone: 4,209 – 4,206
→ Only BUY if strong support reactions or reversal patterns appear.
🎯 Risk Management
Stop Loss (SL): 100 pips
Take Profit (TP): 100 pips
→ Maintain consistent risk throughout the session.
Do you think gold will continue to face bearish pressure and break lower,
or will it bounce from these deeper support zones and regain momentum?

XAUUSD – H2: The Discount Zone Is Formed, Now Waiting for ...XAUUSD – H2: The Discount Zone Is Formed, Now Waiting for Price to Retrace for Continuation Buys
On the H2 timeframe, gold has just made a strong breakout above the 4,180 zone after a period of tight consolidation. Since it is the weekend and also Thanksgiving in the US, I will only prioritise pullback buys at discounted levels — absolutely no chasing price at the highs.
🎯 PRIMARY SETUP – BUY THE DIP at Fibo & POC Zone (4.163–4.160)
Buy Entry: 4.163 – 4.160
Stop Loss: 4.155
Take Profit: 4.178 – 4.195 – 4.220
⭐ SECONDARY SETUP – DEEPER BUY at VAL + Strong Support (4.139–4.136)
Buy Entry: 4.139 – 4.136
Stop Loss: 4.130
Take Profit: 4.150 – 4.172 – 4.190 – 4.220
I always keep total risk per setup within 1–2% of the account.
Fundamental Context
Weekend + Thanksgiving → thin liquidity, more price whipsaws near the close.
Recent comments from Trump & credit data show the economic picture and the December rate path are still uncertain.
This keeps gold supported as a defensive asset, but not strong enough to expect a straight-up rally.
Therefore, I prefer trading based on technical levels and clear zones.
Technical Analysis – H2
Market Sentiment & Trading Outlook
After the breakout, buyers still hold momentum, but the sideways movement at the top suggests partial profit-taking and liquidity patience.
In thin liquidity conditions, price often makes a liquidity sweep down into support before reversing — exactly the move I aim to catch.
Plan
Prioritise Buy at 4.163–4.160.
Only consider the deeper 4.139–4.136 setup if price flushes harder.
All trades use strict Stop Losses (4.155 & 4.130) — no widening.
Take partial profits step-by-step and trail SL as price approaches TP levels.

XAUUSD Pullback Zone Buy Setup – Demand Re-Entry Toward Higher TMarket Structure & Price Action Analysis
Trend Context:
Price recently pushed into a higher-timeframe supply zone (the blue area) and rejected strongly, creating a short-term downtrend.
Pullback Behavior:
Price is currently retracing downward, breaking minor support levels and forming lower lows, but the bearish momentum appears to be slowing.
Demand Zone (Entry Area):
Your marked Entry zone (around 4177–4180) aligns with:
Previous consolidation
A prior breakout origin
A sweep of liquidity (the pin-bar wick marked with the red circle)
This makes it a high-probability demand area for a bullish reaction.
📌 Trade Idea Breakdown
Entry
Around 4177–4180 where price may retest the demand zone.
Confirmation
Look for:
Bullish engulfing
Strong rejection wick
Break of short-term structure (e.g., break above 4198)
Target
Re-test of the upper supply zone (around 4208–4215).
This aligns well with your green projection arrow.
🎯 Bias
Bullish from demand → Targeting supply, as long as price holds above 4177 and shows bullish confirmation.
If price breaks below this zone with momentum, bullish setup becomes invalid.

XAUUSD – LANA’S CORRECTION OUTLOOK FOR 02/12✨ XAUUSD – LANA’S CORRECTION OUTLOOK FOR 02/12
1. Quick Update
Today, Lana views gold as being in a short-term corrective phase, mainly forming Wave 4 in Elliott Wave, after a strong upward move earlier.
The goal is to take advantage of this technical pullback to:
Sell short toward lower price zones
Then buy again at a strong support area in line with the main trend
2. Technical Analysis
The 4250–4260 Liquidity Zone on the weekly timeframe is a very strong liquidity region based on Market Profile.
Lana considers this an area prone to a “fake break” — price may push up to grab liquidity before pulling back.
Based on Session data, Lana prioritises the scenario where:
Price gets rejected around that upper liquidity region
Then forms a downward move toward 418x, completing the Wave 4 correction
Once Wave 4 is complete, the medium-term uptrend can still continue.
3. Key Price Zones
Liquidity / Strong Resistance:
4250 – 4260
Short-term Sell Zone:
4236 – 4241
Buy Zone (Trend-follow Buy):
4180 – 4175
4. Trading Scenarios
⭐ Scenario 1 – Sell with the correction
Sell: 4236 – 4241
SL: Above 4245
Target: 418x (can take partial profits around 4180)
⭐ Scenario 2 – Buy with the trend after correction
Buy: 4180 – 4175
SL: 4170
TP: Minimum 20 dollars (you may take profit gradually at nearby resistance levels)
Lana’s Priority Approach
Avoid buying directly at the Liquidity Zone 4250–4260
Be patient and wait for:
✔ Sell at 4236–4241
✔ Buy at 4180–4175 following the main trend
This is Lana’s personal view for the correction phase on 02/12.
Please evaluate carefully and manage your risk before entering any trade. 💛

Resistance Rejection → Bearish Pullback Toward Support🟡 GOLD (XAU/USD) – Bearish Rejection from Major Resistance 🟥📉
🔍 Key Technical Insights
Price rejected the major resistance zone around 4,245 – 4,255
Rising Support Line has been broken → signals weakening bullish momentum ❌
Current structure favors a pullback toward demand area
Market seeking liquidity below recent swing lows 💰
🎯 Suggested Targets (with stickers)
Target Type Price Area Sticker
TP1 → Support Retest 4,210 – 4,215 🎯
TP2 → Demand Zone 4,195 – 4,205 📉💰
📌 TP1 is your high-probability target
📌 TP2 is for extended move if bearish momentum continues ⬇️
📌 Trade Setup Idea
📍 Sell Entry Zone:
➤ 4,238 – 4,245 (after failed breakout)
🎯 Take Profit:
➤ TP1: 4,215 🎯
➤ TP2: 4,200 📉💸
🧭 Overall Market Outlook
Factor Bias
Short-term Trend Bearish Pullback 🔻
Liquidity Downside targets in focus 💧
Resistance Reaction Strong rejection 🚫

Elliott Wave Analysis XAUUSD – 28/11/2025Hello my friends, let’s update the Elliott Wave analysis on Gold together to see how the wave development may unfold today.
1. Momentum
Momentum D1
D1 momentum is currently contracting. We need to wait for a strong bearish daily close to confirm a momentum reversal. Once confirmed, the market may enter a downward phase lasting 4–5 days.
Momentum H4
H4 momentum is also narrowing, suggesting a potential short-term downside reversal. However, note the following:
• Price highs and momentum highs are forming higher highs and higher lows, which still supports the bullish structure.
• If H4 momentum truly reverses and moves into the oversold zone, price must break below 4142 to confirm a structural break and signal a genuine trend reversal.
Momentum H1
H1 momentum is turning downward and is aligned with H4. I expect the current price area to be the potential wave top.
________________________________________
2. Wave Structure
Wave Structure D1
The D1 wave structure remains unchanged. With D1 momentum still converging, price action continues to show slow upward movement.
• If price breaks above 4243, the 5-wave structure of the purple Y wave is invalidated.
• In that case, a different wave structure will be triggered (as mentioned in the previous plan), and I will update you when it occurs.
Wave Structure H4
We continue to follow the green ABC corrective structure, with price currently in wave C (green).
• As H4 momentum is in the overbought zone, I expect the current region to be the top of wave C.
• If H4 momentum dips into the oversold zone and price breaks below 4142, this will confirm a structural breakdown.
• However, if momentum enters oversold while price stays above 4142, we must be prepared for a continued bullish move.
Wave Structure H1
Yesterday, the RSI on H1 showed divergence, suggesting a possible completion of wave C. However, with the additional push during the Asian session, wave C likely extended further. Price is now at the target zone calculated earlier.
• With D1, H4, and H1 momentum all preparing to reverse, I expect the current price zone to be the top of wave C.
________________________________________
3. Trading Plan
The current price region remains our preferred SELL zone.
During the next H4 momentum cycle:
• If momentum enters the oversold zone but price fails to break below 4142, we should consider exiting early to protect capital.
Trade Setup
• Sell Zone: 4187 – 4190
• Stop Loss (SL): 4210
• TP1: 4158
• TP2: 4112
• TP3: 4081

XAUUSD MULTI TIMEFRAME ANALYSIS Watching this long setup on XAUUSD. Price is rejecting a d1 flip zone where the 1H 50 EMA and the 61.8% retracement align — a solid multi-confluence level. If my entry conditions fire, I’ll take the long targeting a new weekly high.
Setup quality : ⭐⭐⭐⭐⭐

GOLD EXPLOSION: XAUUSD READY TO ACCELERATE!📰 BASIC SUMMARY (FA): PRESSURE ON USD AND SAFE HAVEN DEMAND
Gold is receiving strong support thanks to:
FED DOVISH: Recent comments from FED Governors (Waller, Williams) and information about Kevin Hassett potentially taking the position of FED Chairman (supporting strong rate cuts) are boosting expectations for rate cuts, weakening the US Dollar (USD).
GEOPOLITICS/ECONOMICS: News about conflicts in the Black Sea and weakening Chinese manufacturing data (PMI decline) reinforce Gold's safe haven role, pushing prices to a 6-week high.
📈 TECHNICAL ANALYSIS (TA): MAINTAINING UPWARD STRUCTURE
The 2H chart shows Gold in a clear UPWARD trend (with multiple BOS). The optimal strategy is to wait for price adjustments to the key demand zone:
Action: ENTRY (BUY)
Price Range: $4,185 – $4,192 (Breakout/Demand zone established. Wait for confirmation here.)
STOP LOSS (SL): Below $4,160.9 (Invalidates upward structure if price breaks.)
TARGET 1 (TP): $4,244.8 (Nearest resistance.)
TARGET 2 (TP): $4,270.1 – $4,276.1 (Main growth target.)
Strategy: Patiently wait for a Pullback to the $4,185 – $4,192 zone to enter a LONG position following the trend.
⚠️ IMPORTANT ECONOMIC CALENDAR:
Pay attention to the US ISM Manufacturing PMI data and other macro reports this week to assess USD momentum.
#XAUUSD #GOLD #GoldAnalysis #FED #Dovish #Uptrend #MarketStructure #TradingView #Forex
