Gold upside breakout?After a brief phase of consolidation, is gold facing another minor rally. Given the current levels chances of a big rally is limited but the upside bias was confirmed as soon as the recent profit booking was arrested at 3900 levels. With central banks like PBoC piling up on Gold, a minor rally is not out of question. Target should be previous high. SL at 4050.
Trade ideas

XAUUSD – LANA TRACKS MID-TERM WAVE 5 TOWARDS THE ATH ZONE AT ...XAUUSD – LANA TRACKS MID-TERM WAVE 5 TOWARDS THE ATH ZONE AT 4360
1. Fundamental Analysis
On the geopolitical front, President Putin has once again reiterated the conditions for a ceasefire between Russia and Ukraine. While the possibility of a peace agreement remains uncertain, his firm stance suggests the conflict is unlikely to end soon. This keeps gold supported as a mid-term safe-haven asset.
On the US side, Donald Trump continues to emphasise that the stock market will keep making new all-time highs, and even mentioned the potential removal of most income taxes, replacing them with tariff-based revenue. These comments fuel “risk-on” sentiment for equities and the USD, creating short-term fluctuations for gold.
Overall, Lana expects gold to maintain a mid-term bullish bias over the next 1–2 weeks, though short-term volatility is likely as the market constantly re-prices geopolitical risks and US policy expectations.
2. Technical Analysis
On the D1 timeframe, gold is forming a mid-term Elliott Wave 5 structure. Wave (4) has completed at a key support region, accompanied by a bullish market structure shift (MSS), signalling the start of Wave (5).
Using the Fibonacci extension tool, the theoretical target for Wave (5) lies around the 2.618 extension at 4360 — a strong psychological level and close to the potential ATH zone, where significant profit-taking from buyers may appear.
On the way up, the 4246 level is a major resistance zone:
If price breaks this level decisively and closes above it on D1, the bullish trend strengthens, confirming buyers are willing to push price to new highs.
The descending trendline has already been broken. After the breakout, price retested the line and bounced, showing buyers have regained control. A pullback towards the trendline zone at 4133–4139 would give Lana a clean opportunity to join Wave 5 with a better risk-to-reward ratio.
3. Key Price Levels to Watch
Major Resistance / Mid-term Take-Profit Zones:
4240 – 4246: Intermediate resistance; needs a clear breakout to reinforce the bullish trend.
4360: Fibonacci 2.618 extension & potential ATH target for Wave 5.
Support / Potential Buy Zones:
4133 – 4139: Near the trendline; Lana’s preferred buy zone if price pulls back.
4124: Technical stop-loss level; a break below may weaken the short-term bullish wave structure.
4. Trade Setup
BUY: 4133 – 4139
SL: 4124
TP: 4240 – 4280 – 4350
👉 Follow Lana on TradingView for the earliest gold analysis updates. 💛

XAU @4204Not a SEBI registered, just sharing idea. XAU @ 4204, if sustain above 4240 then target-4600 in 10-15 days.

Gold Faces Critical Resistance: Will Bulls Break Through or FadeGold is currently trading around 4,217, , as bulls continue to struggle with a persistent resistance zone that has proven difficult to crack. .
The $4,240-4,250 level has emerged as a significant ceiling for gold price, repeatedly rejecting bullish advances over recent sessions. Multiple attempts by buyers to establish a foothold above this area have been met with aggressive selling pressure, creating major resistance for the current rally.
The repeated failures at this level suggest strong conviction from bears defending this zone.
Today's Central Pivot Range (CPR) formation presents a narrow range, which historically signals an imminent volatility expansion.
A narrow CPR often acts as a coiled spring the tighter the compression, the more explosive the eventual breakout. This technical setup demands heightened attention to risk management and position sizing.
Key Technical Levels to Watch
The ascending trendline (black diagonal) provides dynamic support
Bullish Order Block: $4,170-4,200 zone
Bullish Case:
A convincing breakout and close above 4,250 would invalidate the recent resistance and likely trigger stops from short sellers, potentially fueling a rapid move toward the R2 level at $4,290. The key word here is "sustain" we need to see buyers hold gains above resistance, not just spike through momentarily.
Bearish/Consolidation Case:
Failure to breach 4,250 could lead to profit-taking and a drift back toward the $4,200 level. A break below the ascending trendline would be a more significant warning sign, potentially opening the door to a test of the $4,170-4,200 order block. Loss of this support zone could accelerate selling toward $4,150.
Breakout traders: Wait for a decisive close above $4,250 with strong volume before entering long positions, targeting $4,275-4,300
Range traders: Look for mean reversion plays within the $4,200-4,240 range
Trend followers: Watch for trendline support holds for continuation long entries

GOLD EXPLOSION: READY TO CONQUER NEW HEIGHTS?I. HOT NEWS 💥
Gold is experiencing its 4th consecutive monthly increase, reaching $4,192.78/oz (closing on 11/28) thanks to significant changes from the Fed.
Interest Rate Reversal: Recent statements from the Fed Governor have increased the probability of a rate cut in December 2025 to 89% (up from 50% last week).
Gold Connection: A low-interest-rate environment is a paradise for Gold, propelling it to become a safe-haven asset. The fundamental momentum is EXTREMELY STRONG.
II. TECHNICAL ANALYSIS 📊
The price is approaching a critical supply zone. The current strategy is Buy on Dip with higher targets.
Short-term Resistance Target (PDI):
Price Range: $4,210 – $4,235
Strategy: Short-term resistance, requires a decisive Breakout to continue the upward momentum.
Ultimate Target (FVG):
Price Range: $4,260 – $4,330
Strategy: The next potential profit-taking target for Smart Money. Main Long target.
Strong Demand Zone (OB - Order Block):
Price Range: $4,046 – $4,064
Strategy: Strategic support (Demand Zone). A safe buying area if the price corrects deeply.
III. CONCLUSION & RISKS 🎯
Market Sentiment: Strongly BULLISH thanks to momentum from the Fed.
Focus: Monitor price action around $4,235. If surpassed, $4,330 is not far off.
Warning: Always manage risk (SL) tightly. Do not trade without Price Action confirmation!
#XAUUSD #GOLD #FOREX #FedDovish #RateCuts #SMC #OrderBlock #FVG #BullishTrend #TradingView

Divergence Secrets How Volatility Affects Profits
Volatility (VIX or IV) is another major factor.
You profit when:
IV goes up after you buy options
IV goes down after you sell options
High volatility = high premium
Low volatility = low premium
This is why buying options ahead of big events (Budget, elections, results) is riskier—IV may crash afterward.

Elliott Wave Analysis XAUUSD – 27/11/20251. Momentum
D1:
D1 momentum is contracting and preparing to reverse. We need to wait for today’s daily candle to close to confirm the reversal signal. If confirmed, the market may enter a downward phase lasting around 4–5 days.
H4:
H4 momentum continues to decline and is approaching the oversold zone. This indicates that the current downward move is weakening, and a corrective bounce is likely once H4 momentum reverses in the oversold area.
H1:
H1 momentum is also decreasing and moving toward the oversold zone. Therefore, we expect a mild bounce once H1 momentum turns upward.
________________________________________
2. Wave Structure
D1:
The wave structure on H4 remains unchanged from previous analysis. The key difference is that D1 momentum has now contracted and shows signs of reversal, strengthening the scenario of a continuation of the purple Y wave. The completion of this Y wave will likely align with the moment D1 momentum descends into the oversold zone and reverses.
H4:
On the H4 timeframe, the blue ABC corrective structure is close to completion, and the market is currently in the final stage of wave C.
Based on H4 momentum reversal cycles, a series of lower highs and lower lows suggests that the ABC structure is likely complete and price is in the final phase of wave Y.
H1:
On H1, a 5-wave black structure is forming. In yesterday’s analysis, I presented two scenarios and explained the characteristics of each. With D1 momentum now reversing, I am leaning toward the scenario where the 5 black waves represent the C wave of the blue structure.
Yesterday’s targets for wave 5 (black) and wave C (blue) were truncated — price only reached 4173.8 and failed to touch 4184. Since then, the market has been moving sideways within a wide range.
Key observations:
• Price rose but failed to break the 4173.8 high.
• Price later dropped near 4137.
• RSI showed bearish divergence from wave 3 (black): price made higher highs while RSI made lower highs → suggesting wave 5 likely completed as an Ending Diagonal.
At this stage, I want to see price break below 4137 before H4 momentum reverses upward. This would provide additional confirmation that the ABC corrective structure has completed.
The 4058 zone continues to be a strong liquidity area to look for sell entries under the assumption that wave 5 has finished.
________________________________________
3. Trading Plan
Sell Zone: 4158 – 4160
SL: 4178
TP1: 4081
TP2: 4020
TP3: 3958

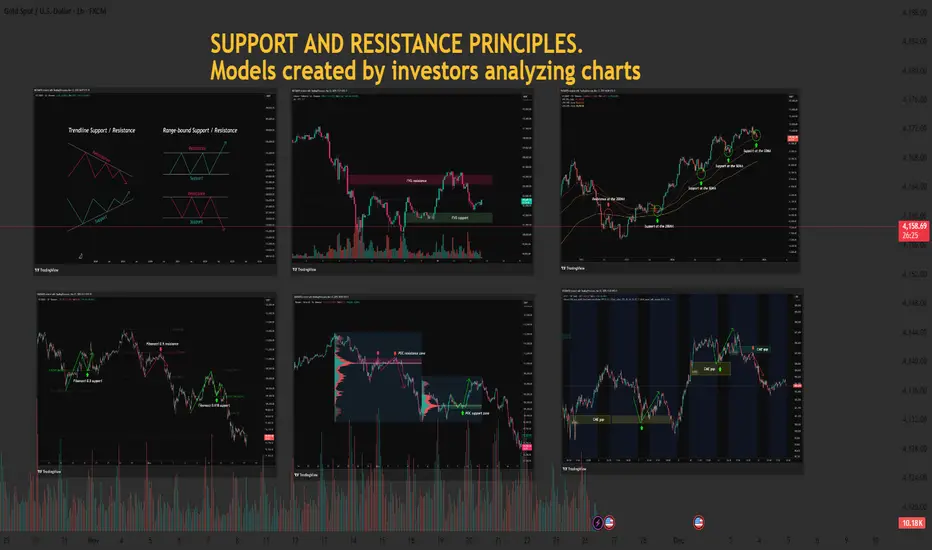
Essential Guide to Support and Resistance 1️⃣ The Importance of Support and Resistance in the Highly Volatile Crypto Market
- The cryptocurrency market operates 24/7/365 and shows significantly higher volatility than traditional financial markets. This volatility creates exceptional profit opportunities but also triggers intense fear and greed, placing substantial psychological pressure on traders.
- Support and resistance act as critical reference points within this chaos, highlighting areas where price is likely to react. Beyond technical analysis, they reflect the collective psychology of traders. Understanding them is essential for long-term success in crypto trading.
2️⃣ The Nature of Support and Resistance and Their Psychological Foundation
Support and resistance form where buying and selling pressures clash strongly enough to slow down or halt price movement.
Support:
At this level, buyers perceive the asset as “cheap enough” and are willing to enter, forming a psychological and structural barrier against further decline. Traders previously stuck in losing positions may sell at breakeven, adding layered reactions around these levels.
Resistance:
At this level, sellers believe the asset is “expensive enough” and reduce exposure, while trapped traders near the top may sell with a “better late than never” mentality, limiting further upward movement.
※ The Meaning of Breakouts and Fakeouts
- When support breaks, active buyers may panic and trigger stop-loss selling. Conversely, breaking resistance often invites aggressive buyers, accelerating the trend.
- However, many breakouts turn into fakeouts, designed to exploit trader psychology. Avoid jumping in too early without confirmation.
3️⃣ Key Support and Resistance Models Explained
📈 Trendlines & Accumulation Zones: Market Structure and Trader Expectations
- Trendlines visually represent collective expectations of future price direction.
- Touching an uptrend line triggers “buy the dip” psychology.
- Touching a downtrend line reinforces the belief that price “cannot move higher.”
- Accumulation Boxes mark areas where buying and selling pressures stabilize. Traders plan around these zones, driven by the mindset of “waiting for the breakout” to catch meaningful moves.
drive.google.com
📈 FVG (Fair Value Gap): Market Inefficiency & Smart Money Footprints
An FVG forms when price moves too quickly through a zone, leaving an unfilled “price gap.” These gaps often represent sudden activity from Smart Money (institutions, whales).
Gap Filling:
Markets naturally avoid leaving inefficiencies unresolved. When price returns to an FVG, the entities responsible for the original move may adjust or reopen positions, creating support or resistance.
Newer traders can observe FVGs as footprints of Smart Money and plan reactions accordingly.
drive.google.com
📈 Moving Averages (MA): Collective Sentiment & Trend Direction
MAs reflect the average price the market perceives over time. Because MAs are widely monitored, they naturally form psychological support and resistance.
Short-term MA (e.g., 50MA): Tracks short-term sentiment.
Price below → worry about trend weakening.
Price above → renewed optimism.
Long-term MA (e.g., 200MA): Represents long-term sentiment.
Price below 200MA → fear of prolonged downtrend.
Price above 200MA → hope for sustained bullishness.
When acting as support/resistance, MAs reflect strong collective agreement.
drive.google.com
📈 POC (Point of Control) – Volume Profile: Market Consensus & Volume Strength
POC is the price level with the highest trading volume within a given range — the market’s strongest consensus level.
Price below POC:
POC becomes strong resistance.
Buyers stuck in losing positions may sell at breakeven, strengthening resistance.
Price above POC:
POC turns into solid support.
Buyers believe price should not fall below this level.
POC often reflects the market’s “expected value” and the area where loss-aversion psychology is strongest.
drive.google.com
📈 Fibonacci: Natural Order & Human Expectations
- Fibonacci retracement applies golden ratio mathematics to charts, reflecting where traders expect reversals and forming support/resistance.
- These levels work not by magic but because many traders plan trades around them — collective behavior creates real reactions.
- Levels like 0.5 and 0.618 carry psychological significance, often seen as optimal buying or selling opportunities.
drive.google.com
📈 CME Gap: Institutional Movement & Mean Reversion Behavior
CME gaps occur in Bitcoin futures due to institutional trading hours. When spot price moves over the weekend while futures are closed, gaps form.
Gap Filling:
These gaps represent time periods without institutional activity, encouraging the market to “normalize” abnormal price areas.
Traders commonly expect gaps to be filled eventually, turning them into potential support/resistance zones.
drive.google.com
4️⃣ Managing Trading Psychology Through Support and Resistance
Even the best tools are useless without psychological discipline.
Confirmation Bias & Stop-Loss Discipline
- Ignoring losses due to selective perception leads to failure.
- When support breaks, accept the invalidation and exit decisively.
Overbought/Oversold Psychology & FOMO
- Avoid chasing price upward out of fear of missing out.
- In crashes, resist panic-selling at the bottom.
- Rely on your structured support/resistance rules.
Scaling Into Trades
- Avoid buying everything at one support level—or selling everything at one resistance level.
- Scaling entries across multiple levels increases psychological stability and reduces the impact of misjudgment.
5️⃣ Building a Complete Strategy & Practical Application Tips
Confluence Creates Strongest Levels
When multiple support/resistance signals overlap
(e.g., Fibonacci 0.618 + 200MA + POC + FVG),
these zones become significantly stronger because they reflect collective trader agreement.
Volume Confirms Support/Resistance Strength
High volume validates a level's importance.
A reliable breakout requires strong volume, showing clear market participation and intent.
Develop Your Own Trading Plan
Do not follow every model blindly.
Choose indicators and methods that fit your style, and create clear trading rules.
Discipline with your own system leads to psychological stability and long-term success.
Don’t forget to like and share your thoughts in the comments! ❤️
XAUUSD/GOLD 1H BUY PROJECTION 24.11.25(XAUUSD/GOLD 1H BUY PROJECTION – 24.11.25).
🔍 What the Chart Shows
Your chart displays a buy setup on the 1-hour timeframe with the following key elements:
🟦 1. Support Zone (S1)
Price is reacting from the horizontal support zone.
This zone aligns with the 1H uptrend line, adding confluence.
Good demand area.
📉 2. Trendline Support (1H Uptrend)
The price is touching the ascending trendline, indicating continuation of the uptrend.
🔦 3. Hammer Candle Confirmation
A bullish hammer candle is highlighted (yellow box).
This indicates seller exhaustion and possible reversal to upside.
This candle gives confidence for a buy entry.
🎯 4. Entry, SL, TP
Entry: At the hammer candle close near 4043–4045 zone.
Stop Loss: Below support zone and trendline (~4020–4025 zone).
Target: Back to Resistance R2, around 4100+ zone.
Risk/Reward: 1:4 shown — good reward potential.
🟪 5. Resistance Levels
Resistance R1: Mid chart area.
Resistance R2: Strong resistance zone near 4100+.
📌 Overall Summary
Your setup is logically structured with:
Support + Trendline confluence
Hammer reversal confirmation
Clean R:R
Uptrend continuation expectation
This is a valid 1H buy setup based on price action and structure.

Swing Trading Secrets1. The Secret of Trend Recognition
The biggest secret of profitable swing trading is identifying the dominant trend of the market. Most novices try to pick tops and bottoms, but professionals follow the path of least resistance. Trend recognition means:
Uptrend: Higher highs (HH) + higher lows (HL)
Downtrend: Lower highs (LH) + lower lows (LL)
Range: Price oscillates between support and resistance
Swing traders do not predict; they react. They align trades with the existing trend.
For example:
In an uptrend, they wait for pullbacks to key levels.
In a downtrend, they short the rallies.
In a range, they buy at support and sell at resistance.
Knowing the trend keeps traders on the right side of probability.
2. The Secret of Patience and Timing
Effective swing traders don’t enter randomly. They wait for specific conditions:
A. The market must be near a key level
Trendline touch
Moving average support (e.g., 20-EMA, 50-EMA)
Fibonacci retracement (38.2%, 50%, 61.8%)
Previous swing high/low
Volume clusters
B. Price must confirm the reversal or continuation
Patience allows the market to “show its hand” before entering.
The secret: wait for the candle close, not the candle forming.
Many traders lose because they enter too early. Timing matters more than direction.
3. The Secret of Multi-Timeframe Confluence
Professional swing traders use multiple timeframes:
Higher timeframe (HTF): 1-week or 1-day → Trend direction
Trading timeframe (TTF): 4-hour or 1-day → Entry zones
Lower timeframe (LTF): 1-hour or 15-min → Entry trigger refinement
This is called top-down analysis.
If the weekly chart shows an uptrend, the daily chart shows a pullback, and the 4-hour chart shows a bullish reversal pattern, the probability of success becomes extremely strong.
Multi-timeframe alignment is a powerful edge.
4. The Secret of High-Probability Patterns
Swing traders rely on chart patterns—not lots of patterns, just a handful of powerful ones that repeat reliably.
A. Continuation Patterns
Bull flag
Bear flag
Ascending triangle
Descending channel
These indicate that the trend is likely to continue.
B. Reversal Patterns
Double top / double bottom
Head and shoulders
Morning star / evening star
Hammer / shooting star
C. Breakout Patterns
Cup and handle
Range breakout
Consolidation breakout
Professional traders focus on clean patterns. If the pattern is messy, overlapping, or unclear, they move on.
5. The Secret of Volume Analysis
Price shows direction; volume shows conviction.
High-probability swing trades usually show:
High volume on breakouts
Low volume on pullbacks
High volume on reversal candles
Volume spikes at support/resistance
Volume acts like a lie detector. If a breakout happens on weak volume, it is often a trap.
Understanding volume helps traders avoid false signals.
6. The Secret of Risk Management
Most swing traders fail not because their strategy is bad but because their risk management is weak.
Professionals follow these golden rules:
Risk only 1–2% of capital per trade
Always place a stop-loss
Size positions based on volatility
Avoid overtrading
Never increase lot size after a loss
The greatest secret:
Protecting capital is more important than making profits.
A trader who avoids major losses can survive long enough to catch big winning swings.
7. The Secret of Support & Resistance Mastery
Swing traders obsess over support and resistance levels.
These levels act as price magnets and turning zones.
Key levels include:
Previous swing highs/lows
Daily, weekly, and monthly levels
Psychological numbers (100, 500, 1000)
Fibonacci retracement levels
Supply and demand zones
Swing traders wait for price reactions at these levels and only trade when confirmation appears.
8. The Secret of Using Indicators the Right Way
Professional swing traders use indicators as confirmation, not decision-making tools.
Popular indicator combinations:
A. Trend + Momentum
50-EMA or 200-EMA + RSI
20-EMA + MACD
B. Pullback Identification
Bollinger Bands
Stochastic RSI
C. Breakout Confirmation
Volume + MACD
RSI breakout
The secret:
Use indicators sparingly—2 or 3 maximum.
Clear charts produce clearer decisions.
9. The Secret of Trading Psychology
Swing trading rewards emotional control.
Professionals master:
A. Discipline
Follow the plan strictly.
B. Patience
Wait for the best setups.
C. Emotional Detachment
React to charts, not feelings.
D. Consistency
A few high-quality trades outperform dozens of random trades.
The less emotionally involved a trader is, the better they perform.
10. The Secret of Journaling Every Trade
This is one of the most underrated secrets.
A trade journal includes:
Entry and exit
Stop loss
Chart screenshots
Reason for trade
Mistakes
Market context
Journaling forces self-reflection and dramatically improves discipline and performance.
11. The Secret of Avoiding News-Based Noise
Swing traders avoid making decisions during:
Major economic announcements
Earnings reports
Policy changes
High volatility events
News can create unpredictable spikes that damage swing positions.
Professionals stay defensive during such periods.
12. The Secret of Letting Winners Run
One of the greatest swing trading secrets is knowing when not to exit early.
Successful traders:
Trail their stop-loss
Add positions in trend continuation
Hold until target zones are met
Small losses and big wins create long-term profitability.
Conclusion
Swing trading appears simple but demands mastery of multiple elements—trend recognition, timing, patience, volume interpretation, chart patterns, risk management, and psychology. The real secrets lie not in magical indicators but in disciplined execution and consistent behavior. When traders combine technical analysis with emotional control, they unlock the ability to capture market swings with confidence and accuracy.

XAUUSD is skyrocketing after the Adam & Eve pattern!OANDA:XAUUSD is really interesting right now. The price seems likely to rise further after the formation of the Adam & Eve pattern. With such an easy-to-remember name, the Adam & Eve pattern is one of the most memorable. Below, I’ll explain the reasons and how to easily recognize it.
The Adam pattern is characterized by a sharp drop, followed by a quick recovery, forming a "V" on the chart. High, sharp, and aggressive! You could say it's more "masculine."
On the other hand, the Eve pattern develops more slowly. The price becomes more rounded, forming a wider and smoother base before rising again, creating a shape similar to the letter "U." Softer, more curved, and more "feminine."
Combining these two elements gives us the Adam & Eve pattern, which often signals a potential trend reversal. Especially when accompanied by fundamental analysis or other strong technical indicators.
This pattern will stick in your mind when you connect its shapes to the male and female aspects. A pattern that's truly hard to forget.

XAU/USD – Gold Holds Above Key Support as Pullback Stays LimitedGold remains capped below its two-week high during the Asian session, but the downside is clearly limited.
Market sentiment is shaped by:
A weaker USD as dovish Fed expectations gain traction
Rising probability of rate cuts in upcoming meetings
Improving global risk sentiment amid hopes of progress in Russia–Ukraine negotiations
Even though Gold is retracing, the bigger picture remains bullish as long as price holds above key support zones.
📊 Technical Outlook – MMF Trading Style (M30/H1)
Price is currently consolidating below the resistance cluster 4,156 – 4,170, retracing into multiple demand zones.
Key Levels to Watch
Support 1: 4,131 – 4,137
Support 2: 4,115 – 4,118
Support 3 (major liquidity): 4,083 – 4,090
Main Resistance: 4,170 – 4,193
Market structure shows a clean zigzag pullback, suggesting a potential bullish continuation once liquidity is collected below.
🎯 MMF Intraday Trading Plan
Scenario 1 – Buy the Dip (Primary Bias)
Best trade today: Buying retracements into demand.
BUY: 4,115 – 4,118
SL: 4,103
TP: 4,131 → 4,156 → 4,170
BUY (extended liquidity sweep): 4,083 – 4,090
SL: 4,070
TP: 4,118 → 4,145 → 4,170 – 4,193
Reason: Fibo confluence + strong demand + liquidity zone = high-probability reversal area.
Scenario 2 – Short-Term SELL (Scalp Only)
Only valid if price rejects strongly at resistance.
SELL: 4,156 – 4,170
SL: 4,177
TP: 4,145 → 4,131
This is not the main bias today.
⚜️ MMF Trading View
Gold is forming a healthy pullback—not, at this stage, a bearish reversal.
As long as price stays above 4,08x, the bullish structure remains intact.
“In Gold, the goal isn’t chasing the breakout — it’s waiting for price to return to value.”
Today’s focus: Prefer BUY setups on retracement – SELL only for quick scalps.

Brian – Gold game plan for the US sessionBrian – Gold game plan for the US session
Gold’s rally yesterday shook a lot of traders out of position – the move was slow, steady and unforgiving, making it hard both to get in and to get out. For now, the short-term trend is clearer on H1, while H4 is still in transition.
Fundamental view – the Fed is confusing everyone
Fed expectations for December have been on a roller-coaster:
The market went from pricing a 25 bp cut in December at over 90%,
Then collapsed those odds to below 30%,
And has now swung sharply back again – all within about a month.
That kind of violent repricing in rate expectations usually creates two things for gold:
underlying support as soon as the market believes in easier policy again, and
choppy two-way volatility around each new data print or Fed comment.
So the macro backdrop still leans supportive for gold, but you do not want to ignore intraday whipsaws.
Technical view – H1 bullish, H4 testing the top of structure
On the H4 chart:Price is trading above the rising medium-term trendline from late October, keeping the broader structure constructive as long as 4,000 holds.
We are now pushing up towards the descending trendline and a H4 supply/FVG band between roughly 4,160 and 4,200.
Higher up sits a larger FVG / resistance block around 4,280–4,330 – if price ever accepts above the current downtrend line, that zone becomes a realistic upside magnet.
On H1:Structure is clearly bullish with higher highs and higher lows after yesterday’s impulsive move.
The current leg is extended, so I prefer to buy dips into support or a clean retest, rather than chase at the top of the candle.
Core bias: still prefer buys with the trend. Shorts are tactical, only at clear reaction zones.
Key levels
Resistance / sell zones
4,167–4,169: short-term reaction zone at the descending trendline and FVG
4,200–4,220: upper part of the same supply area
4,280–4,330: major H4 FVG / supply above
Support / buy zones
4,110–4,113: intraday support and potential retest area
4,080–4,070: minor support from recent consolidation
4,040–4,020: deeper pullback zone
4,000: key structural support; a break here would damage the bullish case
3,884: level that would confirm a medium-term bearish shift if price breaks and holds below
Trade scenarios (reference only, not financial advice)
Scenario 1 – Primary long: buy the dip into 4,110
Idea: stay with the bullish H1 structure, use the first decent pullback to get a better entry.
Entry: 4,110–4,113
Stop: 4,105
Targets: 4,125 → 4,140 → 4,180 → 4,200
I want to see price pull back into this zone after a push higher, ideally with a rejection wick or bullish candle confirming buyers are still in control.
Scenario 2 – Tactical short: fade the trendline at 4,167–4,169
Idea: counter-trend scalp from a clean confluence of resistance and FVG.
Entry: 4,167–4,169
Stop: 4,175
Targets: 4,155 → 4,140 → 4,120 → 4,105
This is not a swing short – it is a tactical trade against the intraday trend. Size should be smaller, and I would look to lock in profit or move to breakeven quickly if price reacts in our favour.
Scenario 3 – Breakout long if the trendline gives way
If gold pushes through the descending trendline and holds above the 4,170–4,180 zone:
I will shift back to a breakout-continuation mindset, looking to buy pullbacks above the broken trendline.
The next upside magnets then become 4,220 first and eventually the 4,280–4,330 FVG.
As long as 4,000 holds, I respect the upside and prefer to position with the trend, not against it. If we ever see a daily close below 4,000 and then 3,884, the whole story flips and I’ll start treating rallies as selling opportunities.
Trade the structure in front of you, not the headline noise. Manage risk around the shifting Fed expectations, and let the levels do the heavy lifting.
If this breakdown helps with your game plan, follow Brian for more gold updates during the US session and drop your own view in the comments so we can compare scenarios.

XAUUSD – Waiting for Trend Confirmation Around the 4,160–4,170..XAUUSD – Waiting for Trend Confirmation Around the 4,160–4,170 Zone
At the moment, gold has not shown a clearly defined medium-term trend. Price is moving around an important resistance zone, so instead of predicting direction early, I prefer waiting for price reaction at key levels before taking action.
The main focus today is the 4,160–4,170 area – where the market will decide whether to continue the uptrend or start a deeper correction.
🎯 Scenario 1 – SELL at 4,162–4,165 (Priority if No Clear Breakout)
Sell: 4.162 – 4.165
SL: 4.173
TP: 4.140 – 4.122 – 4.110 – 4.100
The 4.162–4.165 zone on H1 is a strong resistance area combining Fibonacci confluence, previous supply, and proximity to the short-term rising trendline.
If price taps this zone and shows weakness (upper-wick rejection, reversal candle, low volume confirmation), I prefer taking a short-term sell toward 4.140, with deeper targets at the liquidity cluster around 4.110–4.100.
Risk for this scenario is capped at 1–2% per trade. Do NOT hold the position if price closes above 4.173.
⭐ Scenario 2 – BUY on Break Above 4,170 (Trend Continuation Confirmation)
Buy: 4.171 – 4.173 (only after a clean breakout)
SL: 4.163
TP: 4.188 – 4.200 – 4.215
If price breaks decisively above 4.170 and sustains above it, that confirms buyers are still in control.
In this case, I switch my bias to buying the breakout, targeting the next resistance zones around 4.200–4.215, and possibly higher if momentum remains strong.
Note: Only buy if the breakout is genuine — strong candle body closing above 4.170, not a stop-hunt wick that pulls back immediately.
1. Fundamental Outlook
The DXY continues slipping below 99.50, now near 99.45, showing sustained weakness as markets increase expectations for a December Fed rate cut.
Easier monetary conditions generally support gold because the opportunity cost of holding gold is reduced.
However, U.S. initial jobless claims have dropped to the lowest level since April, showing the labour market is still resilient.
This creates a mixed environment: rate-cut expectations support gold, but strong economic data may cause sudden volatility around news releases.
Overall, fundamentals lean slightly bullish for gold, but not strongly enough to ignore potential technical pullbacks.
2. Technical Structure
On the H1 chart, after a strong rally, gold is now consolidating right below the 4.160–4.170 resistance.
The 4.162–4.165 region is a confluence zone:
• horizontal resistance
• previous supply
• area where strong selling pressure appeared earlier
The 4.140 level is the “correction confirmation level” — if price breaks and closes below it, the market will likely aim for the major liquidity area around 4.110–4.100, where many Buy-side stop losses are clustered.
The current structure allows for both long and short setups, but each scenario requires clear price confirmation at the 4.160–4.170 zone.
3. Market Sentiment & Action Plan
Both buyers and sellers are watching the same price zone — 4.160–4.170.
This makes it a high-liquidity area where stops for both sides may get swept before the market shows its real direction.
If price rejects strongly from this zone, it could be a sign of late buyers being flushed out.
If buyers hold price above 4.170, trapped short positions may fuel a short squeeze toward higher resistance zones.
My plan: I do not enter mid-range. I wait for clear signals:
• Sell at 4.162–4.165 if reversal confirmation appears.
• Buy at 4.171–4.173 after a confirmed breakout and hold above the zone.
• Always use a hard stop-loss. No widening stops if price goes against the trade.
If price breaks both zones without giving clear signals, I stay out and wait for a new structure instead of forcing a prediction.
I always read feedback to improve how I share these analyses in future posts.

XAUUSD – H1 uptrend channel, short-term downside risk increasingXAUUSD – H1 uptrend channel, short-term downside risk increasing Brian – Prioritize short selling at the channel peak, wait to buy back at lower support
I. Strategy Summary Gold is trading in an uptrend channel on H1, but the rise around 4.160 shows signs of weakening, increasing short-term correction risk.
Preferred Scenario: Short sell at the channel peak 4.162–4.164, targeting support areas 4.145 – 4.130 – 4.115 – 4.100.
After the correction, the 4.100–4.080 area may become the foundation for the next rise in the larger trend.
Important price areas to watch: 4.139 – 4.127 – 4.110 – 4.088.
II. Macro Context & News 27/11
02:00 – Fed releases Beige Book This document updates the Fed branches' assessment of the US economic situation.
Describing slower growth, cooling price pressures will further reinforce expectations that the Fed will soon cut interest rates → supporting gold.
Conversely, if the Beige Book describes the economy as still “resilient,” the market may temporarily slow down pricing in rate cuts → causing a short-term adjustment for gold.
19:30 – ECB releases October meeting minutes
If the minutes lean towards the scenario of keeping high interest rates longer, the EUR may be supported, indirectly affecting the USD and gold inflows.
However, the impact is usually not as strong as US data, mainly affecting the overall risk-on/risk-off sentiment.
General Context: Gold has surpassed 4.160 USD/oz as the market increasingly expects the Fed to cut interest rates as early as December, reducing the appeal of interest-bearing assets and increasing the allure of gold – a non-yielding asset. This creates a support foundation for the medium-term uptrend, but after a hot rise, technical adjustments on H1 are normal.
III. Technical Structure – H1 uptrend channel
The price is within the H1 uptrend channel, with rising peaks and troughs, but the upper area near 4.160 coincides with:
The upper boundary of the price channel. The “Sell POC” area on the chart – where liquidity and sell orders are concentrated.
Preferred scenario on the chart: The price may slightly rebound to the POC area 4.162–4.164, then be rejected and slide to the important support area around 4.110 before extending the adjustment down to 4.100–4.080.
The lower trendline of the uptrend channel also acts as a short-term buy area if a clear candle reaction appears.
Notable price areas on H1: Resistance: 4.162–4.164 (channel peak + POC). Intermediate support: 4.139 – 4.127 – 4.110. Deep support: 4.088 – 4.080 – 4.100 (area that may form the bottom for the next rise).
IV. Trading Plan 1. Preferred Scenario – Short sell at the channel peak Idea: Short sell when the price rebounds to the upper boundary of the H1 uptrend channel and POC 4.162–4.164, expecting a correction to support.
Sell: 4.162–4.164 SL: 4.168 TP targets: TP1: 4.145 TP2: 4.130 TP3: 4.115 TP4: 4.100
This is a counter-move order in the uptrend channel, only targeting a short-term correction, not a major trend reversal scenario.
2. Supplementary Scenario – Short buy at support trendline Idea: When the price hits the lower trendline of the H1 uptrend channel and a nice candle reaction appears, consider a short-term buy according to the channel, prioritizing areas:
4.139 – 4.127 – 4.110 – 4.088
Specific Entry/SL levels will depend on the actual price reaction at the trendline, but the general principle:
Buy close to the trendline,
SL placed below the immediate support area,
TP aimed at the middle of the channel or the nearest resistance.
V. Risk Management & Notes
Do not open new positions right before or at the time of the Beige Book and ECB minutes release, as volatility may suddenly increase, widening spreads.
The sell order at 4.162–4.164 is a short-term counter-trend order in the uptrend channel, requiring moderate volume and strict adherence to SL 4.168.
If the price clearly breaks and holds above the 4.170 area, the H1 correction scenario weakens – in that case, stay out, wait for a new structure instead of trying to maintain a sell view.

Gold Trding Strategy for 27th November 2025📈 GOLD Trading Plan
🟢 BUY Setup
Enter Buy Position above the High of 15-min Candle
Trigger Level: $4181 (only after a 15-min candle close above this level)
Targets 🎯
$4195
$4205
$4218
SL 🔻: Below recent swing low / candle low
🔻 SELL Setup
Enter Sell Position below the Low of 1-Hour Candle
Trigger Level: $4148 (only after a 1-hour candle closes below this level)
Targets 🎯
$4137
$4125
$4110
SL 🛡: Above recent swing high
⛳ Notes
Wait for confirmed candle close, not wick breakout
Position risk suggestion: 1–2% of capital
Trail SL as targets hit for safety
Avoid trades during major news spikes
⚠ Disclaimer:
This is only for educational purpose.
This is not financial advice. Market conditions may change anytime. Trade at your own risk. Always use Stop-Loss and proper position sizing.

U.S. data storm ahead – Gold awaits its next breakout🟡 XAU/USD – Timing Reversal at 4188, FVG Retest Expected
🔍 Market Context
Gold is approaching a key timing zone near 4188–4190, which aligns with previous supply and structural rejection.
After a strong impulsive leg, liquidity resting above recent highs may be targeted before a deeper pullback into the Fair Value Gap (FVG) zone.
The structure remains bullish in the medium term, but short-term corrective moves are expected before continuation toward the 4212 liquidity objective.
📈 Key Trading Zones
🔻 SELL Setup
Entry: 4188 – 4190
Stop Loss: 4192
Target 1: 4090
Target 2: 4020
Expect rejection at timing zone — short-term bearish retracement into FVG.
🟢 BUY Setups
BUY GOLD 4090 – 4088 | SL 4085
→ Scalp long targeting 4140–4160 if price reacts strongly within FVG.
BUY GOLD 4022 – 4020 | SL 4017
→ Ideal deeper retracement buy zone aligning with structural liquidity & prior demand.
🧠 Trading Plan Logic
Wait for price sweep & rejection at 4188–4190 before confirming short.
Monitor FVG zone (~4090) for reaction to flip back long.
The higher-timeframe target sits near 4212, aligning with liquidity above prior highs.
⚙️ Bias
Short-term: Bearish correction from 4190 toward 4090.
Medium-term: Bullish continuation toward 4212 after retracement.

GOLD REVERSAL AREA GOLD will reverse from this area for sure if you see any CHoCH in these level in 5MIn hold it till bottom

Building a Quarterly Results Trading Checklist1. Pre-Earnings Preparation: Setting the Foundation
Before any earnings are announced, traders must prepare. Preparation removes guesswork and gives clarity. Key factors include:
a. Identify High-Impact Companies
Not all results move the market equally. Focus on:
Large-cap companies
Sector leaders
Companies with a history of large earnings-day volatility
Stocks with heavy FII/DII ownership
Companies with recent major news (M&A, regulatory changes, product launches)
These stocks typically see stronger price reactions.
b. Know the Earnings Date
Many traders get caught off guard because they miss the exact results-announcement timing. Check:
Whether results are announced before market, during market, or after market close
If management commentary or concall is on the same day or the next day
Timing helps you plan intraday or positional trades better.
c. Study the Previous Quarter’s Performance
Review the last 2–3 earnings releases. Note:
Revenue growth trends
Margins (EBITDA, PAT)
Management guidance accuracy
Market reaction to previous results
Surprise elements (positive or negative)
This helps form expectations about whether the upcoming result can challenge or follow historical patterns.
d. Analyze Expectations (Street Estimates)
Quarterly results trading is more about expectations vs. reality than actual performance. Expectations come from:
Analyst projections
Bloomberg/Refinitiv consensus
News flow
Channel checks
Management guidance
If expectations are too high, even decent results can cause the stock to fall.
2. Fundamental Metrics to Watch in Results
Quarterly results contain dozens of data points, but traders should focus on the most high-impact ones. These include:
a. Revenue Growth
Shows overall demand. Compare YoY and QoQ growth:
YoY reveals long-term momentum
QoQ signals near-term growth consistency
b. Profit Margins
Margins show operational efficiency. Key margins:
Gross margin
EBITDA margin
PAT margin
Expanding margins often result in bullish moves.
c. Profit After Tax (PAT)
A company may show revenue growth but shrinking profits due to higher costs. Such divergences significantly impact stock direction.
d. Guidance and Commentary
Often more important than the numbers themselves. Traders watch:
Next quarter revenue outlook
Margin guidance
CapEx plans
Industry demand expectations
Management tone (optimistic, neutral, cautious)
Negative guidance can tank the stock even if the reported numbers are strong.
e. Segment-Wise Performance
Multi-segment companies like Reliance, Tata Motors, or IT companies require detailed segment analysis:
Which segment grew/dropped?
Is the core business performing well?
Are new initiatives gaining traction?
This helps identify future revenue drivers.
3. Technical Checklist Before Trading Results
Fundamentals show what happened; technicals show how traders positioned themselves before results.
a. Identify Key Support and Resistance Levels
Mark:
Major swing high and low
20-, 50-, 200-day moving averages
Trendline support
Supply zones
These levels help shape entry and exit plans.
b. Assess Pre-Earnings Momentum
Check if the stock is:
Running up before results (a sign of high expectations)
Consolidating (indecision)
Selling off (low investor confidence)
Stocks that run too fast ahead of earnings often correct even on good results.
c. Volume Analysis
Higher volumes before results indicate:
Institutional positioning
Potential for large post-earnings moves
Smart money activity
d. Volatility Check
Recent volatility helps determine:
Lot sizes
Stop-loss width
Position sizing
Whether to take a trade at all
If volatility is extreme, avoid leveraged positions.
4. Crafting the Trading Strategy
Once fundamentals and technicals are studied, create actionable trade plans using this checklist.
a. Decide Your Trading Style
You can trade quarterly results in three ways:
Pre-Earnings Positional Trade
Based on expectation buildup
Suitable only for high-conviction setups
Post-Results Intraday Trade
Safer
Trade only after numbers are out
Post-Results Positional Trade
Based on guidance
Ideal for capturing multi-week moves
Choose one based on risk tolerance.
b. Define Entry Trigger
Triggers can include:
Breakout above resistance
Breakdown below support
High-volume candle
Reversal candle after a knee-jerk reaction
A rule-based entry prevents emotional decisions.
c. Set Stop-Loss and Target Levels
Risk management is the spine of the checklist. For results trading:
Keep wider stops due to volatility
Use position sizing to manage risk
Avoid averaging down
Use ATR-based stops for best results.
d. Avoid Trading Immediately at Results Time
The first 5–10 minutes after results are volatile and full of fake moves. Let the market:
Absorb data
Form a stable direction
Build volume confirmation
Then act.
5. Psychology and Behavior Checklist
Earnings trading requires strong emotional control.
a. Don’t Chase the First Spike
The initial price spike is often wrong. Wait for confirmation.
b. Avoid Bias
If you "like" the company, you may misread the results. Let the data dictate the trade.
c. Stick to the Plan
Do not:
Increase position size impulsively
Trade without stop-loss
Overtrade because of excitement
A structured checklist reduces psychological stress.
6. Risk Management Checklist
Earnings trading can flip sharply. Risk control is crucial.
a. Never Trade Full Capital
Limit exposure to:
2–5% of total capital for intraday
5–10% for positional
b. Use Hedging When Needed
Hedging tools:
Options (buying calls/puts)
Straddles/strangles
Futures for protection
For unpredictable companies, hedge or avoid.
c. Avoid Illiquid Stocks
Low-volume stocks widen spreads and increase slippage.
7. Post-Results Evaluation Checklist
After the trade, analyze performance to refine your strategy.
a. Review What Happened
Document:
Were expectations correct?
Did the stock reaction match your analysis?
Was your entry/exit well-timed?
b. Update Your Earnings Database
Maintain a simple log:
Company name
Estimate vs. actual results
Market reaction
Volatility levels
Over time, this builds pattern recognition.
c. Identify Mistakes
Mistakes commonly include:
Entering too early
Ignoring guidance
Trading on gut feeling
Correct them in the next cycle.
Conclusion: Why a Quarterly Results Checklist Matters
Quarterly results bring both opportunity and chaos. Without a checklist, traders rely on emotions and incomplete information, leading to inconsistent outcomes. A well-designed checklist—combining fundamentals, technicals, psychology, and risk management—creates a structured, rule-based approach. It helps identify winning trades, avoid traps, and build long-term trading consistency.
By following this 1000-word guide, you can build a reliable earnings-season trading framework that maximizes profit potential while protecting your capital.
xauusd has seeped swing lowprice has seeped swing low, although structure on 15m if bearish but price has seeped low and give us engulfing candle+fvg, so entering here is good idea, sl woud be at $4040.080 and tp would be at $4069.500. price can face resistance at 4058.300, but if it breaks this zone and manages to close above $4069.300, it can blast upside. OANDA:XAUUSD


Strong news chain could push gold to retest 4300🟡 XAU/USD – Weekly Trading Plan (Nov 23–29)
SMC – FVG – Supply/Demand – High-Impact News Week
1. Market Context
Gold is sideways in the H4 accumulation structure, forming higher lows along the trendline.
Above are 3 important supply layers:
OLD FVG 1
OLD FVG 2
Large FVG 4220–4300
the price needs to sweep liquidity & hit the supply zone before creating a new direction.
2. Strong News Schedule for the Week
This week has a lot of USD news directly affecting gold:
Tuesday (Nov 25)
Core PPI – Retail Sales – PPI (4 consecutive red news) → strong volatility.
Wednesday (Nov 26)
Unemployment Claims
Durable Goods → Core Durable Goods
GDP q/q – GDP Price Index
Core PCE (most important inflation news of the week)
➡️ This is the decisive day for the trend for the rest of the week.
Friday (Nov 28)
German CPI (affects EUR → USD indirectly)
🎯 News Conclusion:
→ Gold likely to fake move – sweep liquidity before running correctly.
→ Thin SL zones will be continuously hunted.
3. Key Levels (from the chart you sent)
🔻 SELL Zone (Supply – FVG)
4189 – 4191 (Main Sell)
SL: 4195
This is a strong reaction zone for the week.
4132 – 4134 (Sell scalp)
SL: 4138
🔵 BUY Zone (Demand – Trendline – SMC)
4906 – 4904 (main BUY scalp zone in the chart)
SL: 3999
→ This is the only zone clearly marked as BUY in the chart.
Psychological level: 4000 – 3985
If the price falls → strong reaction to form the weekly low.
4. Weekly Trading Scenarios
🅰️ Scenario 1 – Price retraces to supply zone before dropping (most likely)
Price is forecasted to retest 4132–4134 → 4189–4191
After hitting 4190 ± → potential appearance of:
Bearish BOS H1/H4
Strong reversal to 4050 – 4000
🔻 SELL Plan
Sell 4132–4134 (scalp) SL 4138
Main Sell 4189–4191 SL 4195
TP targets:
TP1: 4090
TP2: 4050
TP3: 4000
🅱️ Scenario 2 – Price dips before news then surges (kill liquidity)
If gold is pushed down before PPI/GDP news:
Best BUY zone: 4000 – 3985
Form a low → surge back up to test supply.
🔵 BUY Plan
BUY 4000–3985
SL: 3975
TP:
4050
4100
4130
🅾️ Scenario 3 – If 4200 breaks
If 4200 is broken by a large-bodied H4 candle:
➡️ High probability gold will move up to test large FVG 4250–4300
→ At that point, only look for BUY pullbacks, no more SELL.

XAUUSD – Inverse Head and Shoulders Pattern Still Active...XAUUSD – Inverse Head and Shoulders Pattern Still Active, Continue to Prioritise Buying at POC
I maintain the view that the current dominant trend is buying based on the inverse head–and–shoulders structure, and the bullish wave is not yet complete. The plan is to wait for price to retrace into the POC zone to re-enter with the trend, avoiding chasing buys at the highs.
🎯 Main Scenario – BUY THE DIP AT POC
Buy: 4,133 – 4,130
SL: 4,123
TP: 4,155 – 4,178 – 4,200 – 4,250 – extended targets if momentum remains strong
For me, total risk per trade never exceeds 1–2% of the account. A good setup with poor risk management is still a bad trade.
1. Fundamental Context
Gold is maintaining its upward momentum, trading near its highest levels in about two weeks.
The US Dollar is weakening as markets increase bets on the Fed cutting rates soon, following data showing continued cooling in inflation.
Lower yields and a softer USD reduce the opportunity cost of holding gold, supporting the flow back into safe-haven assets.
With this backdrop, I do not prioritise large sell setups. Most pullbacks are mainly opportunities for me to accumulate long positions.
2. Technical Analysis & Market Sentiment
On the H1 timeframe, gold has formed and activated an inverse head–and–shoulders pattern, confirming a bullish reversal phase.
Price is retracing to retest the POC zone around 4,133–4,130, overlapping the previous accumulation area where heavy sell orders were absorbed. This is the zone I prioritise for buying.
Below this lies a deeper FVG acting as secondary support; however, I’m not waiting for price to drop too far to avoid missing the core move of the pattern.
Regarding price behavior, recent pullbacks have been absorbed quickly, with multiple long-wick candles showing buyers are still in control. I’m waiting for a clean pullback into POC with a strong bullish reaction to trigger the entry.
3. Action Plan
Only enter positions when price returns to the 4,133–4,130 zone — absolutely no FOMO buying at higher levels.
Take partial profits at 4,155 – 4,178 – 4,200 – 4,250, leaving the remaining position open if gold continues to extend its bullish leg.
If price breaks below 4,123 and closes under that level, I will cut the trade immediately and reassess the structure — never hold on to a bias when the market has changed.
If this analysis is helpful, follow my TradingView channel and leave your comments. I always read feedback to improve and refine my future posts.
