Support and Resistance with Volume ProfileWe generally say that Support and Resistance are the levels from where price reacts sharply. But have you ever imagined why price takes support and resistance from specific levels?
That's where Volume Profile comes into play.
Normally I use FRVP which can work on a Fixed Range (wave) instead of a session or visible range (we also have Session Volume profile and Visible Range Volume profiles in Tradingview).
After drawing VP for a fixed range, I look for high volume nodes (HVN). You can simply find those levels through long rectangular areas visible on the profiles. Large rectangles mean high volume activity at particular level.
Huge volume activity means big boys were interested in there and large number of contracts changed hands at that level. These levels act as a magnet and price often tests these levels and take support or resistance (as the case may be) and reacts.
In the above chart, notice when the price reacted from 4380 highs, it took support at HVN and reacted, forming a structure support, to form a new high 4381.
It is best to look for buying selling opportunities on the first touch of HVN areas. The second or third touch may be low probability. Always look for signs of strength (Bullish candle) before taking trade at these levels. I don't use limit orders for such a trade.
Currently the price is taking support near 4000 psychological level (also a structure support) and trading above a HVN (4130) zone of the recent sharp sell off.
Next resistance on the chart would be the structure resistance near 4200 and then the HVN at 4265.
How do you find support and resistance on the chart?
Have you ever used Volume profiles?
Comment your views.
Trade ideas

Gold Whats Next??gold rally lasted 4 years everytime in the past , and are trapped for years
Disclaimer- Just my view and opinion trade at your own risk not an investment advice these are only for educational purposes

Gold (XAU/USD) Sell Trade Analysis1. Technical Rationale for a Sell (Short) Setup
Rejection from All-Time Highs (ATH): Gold recently printed an all-time high around $4380. The sharp, rapid reversal from this level is a classic sign of profit-taking and potential exhaustion in the immediate uptrend, often forming a possible Double Top on the higher timeframes (e.g., 4-Hour, Daily).
Trendline Break: The recent sell-off broke below a significant ascending trendline/channel on intraday and possibly 4-hour charts, signaling a near-term shift in market structure from bullish to bearish.
Key Resistance Test: The price is currently finding resistance near the previous key support and psychological round numbers that were broken during the recent sharp drop. This zone is a likely area for sellers to re-enter the market.
2. Trade Setup Details
Parameter Recommended Zone (Approx.) Rationale
Entry Zone (Sell Limit/Market) $4200 - $4225 This is a major psychological and former support area. It also aligns with the "Neckline" of the potential Double Top pattern and key structural resistance from which the previous drop initiated.
Stop Loss (SL) $4240 - $4250 Placing the SL safely above the main short-term resistance and the high of the current pullback, which would invalidate the immediate bearish outlook.
Target 1 (TP1) $4100 - $4095 This level represents the low of the initial sharp sell-off (the Double Top's neckline) and a key psychological round number, which is a common immediate target for profit-taking.
Target 2 (TP2) $4020 - $4000 A break below TP1 clears the path to the major psychological support at $4000. This also aligns with the typical "Measured Move" target of the Double Top pattern.
Export to Sheets
3. Key Levels to Watch
Level Type Significance
Immediate Resistance $4225 High of the current bounce/re-test area.
Critical Resistance $4380 All-Time High (ATH) and top of the potential Double Top. A close above this invalidates all bearish structure.
Immediate Support $4100 Key psychological and structural support (Neckline).
Major Support $4000 Major psychological round number, a long-term anchor.
Export to Sheets
4. Risk Management Note
The overarching long-term trend for Gold is still considered bullish due to global economic uncertainty and central bank rate cut expectations. This Sell Trade is a counter-trend or short-term correctional trade.
Only enter with confirmation (e.g., a bearish candlestick rejection on a lower timeframe like 1-Hour or 4-Hour once the price hits the entry zone).
Risk Management is paramount: Do not risk more than 1-2% of your capital on this single trade\
Disclaimer: Trading is highly risky. This analysis is for informational purposes and is not financial advice. Always use a Stop Loss and manage your risk.

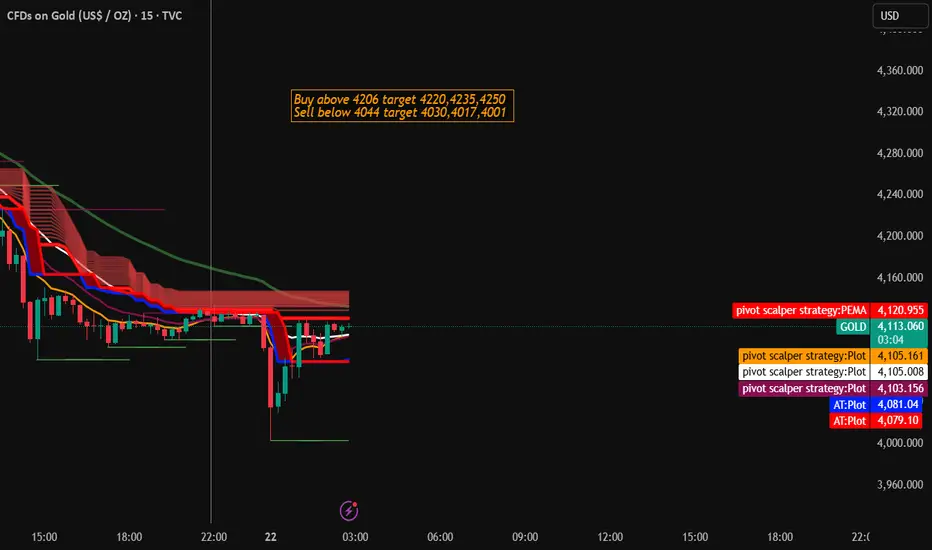
Gold Trading Strategy for 22nd October 2025🌟 GOLD INTRADAY LEVELS (22 OCT 2025) 🌟
📊 Buy Setup:
🟢 Buy Above: High of 15-min candle (Close above ₹4206)
🎯 Targets:
➡️ 1️⃣ ₹4220
➡️ 2️⃣ ₹4235
➡️ 3️⃣ ₹4250
🛑 Stop Loss: Below ₹4190 (or as per your risk appetite)
📉 Sell Setup:
🔴 Sell Below: Low of 15-min candle (Close below ₹4044)
🎯 Targets:
➡️ 1️⃣ ₹4030
➡️ 2️⃣ ₹4017
➡️ 3️⃣ ₹4001
🛑 Stop Loss: Above ₹4060 (or as per your risk tolerance)
💡 Trade Logic:
The levels are based on 15-minute candle confirmation — enter only after candle closes above or below the breakout level for better reliability. Avoid impulsive entries during volatile spikes.
⚠️ Disclaimer:
📘 This analysis is for educational and informational purposes only. It is not investment advice.
💰 Trading in commodities or derivatives involves significant risk. Please consult your financial advisor before taking any trades.
📉 Trade at your own risk.
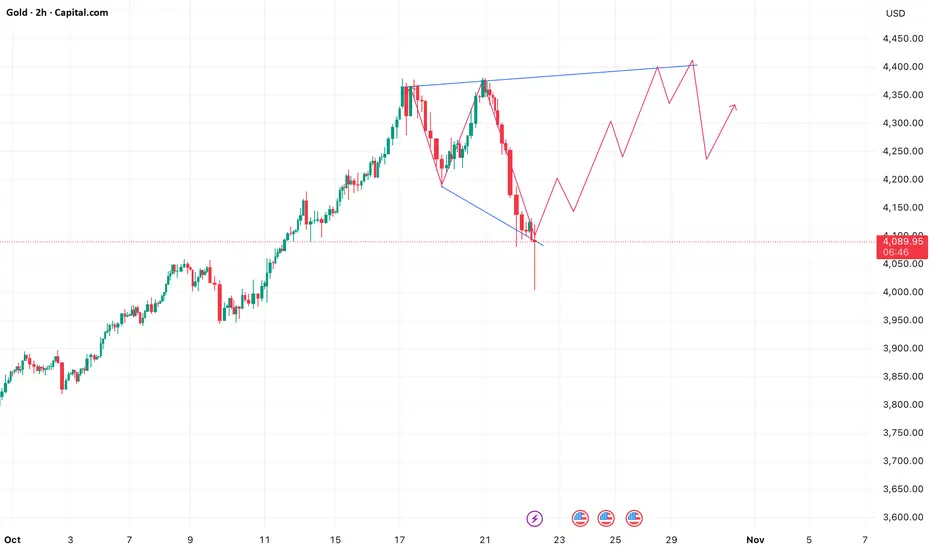
GOLD is in it’s early pattern formation Gold expecting to go up from its current levels. Presently it is early pattern formation. Pattern may be either expanding triangle or complex diamond formation etc. need to closely watch current movement in gold.
XAUUSD Forms a Cup and Handle PatternOANDA:XAUUSD has been steadily rising, maintaining strong and consistent upward momentum. If you’ve been following my previous analyses, you’ll notice a familiar pattern developing on the chart — the classic Cup and Handle formation.
Looking closer, the left side of the chart reveals a strong supply zone, forming the cup. Then, we see the market building a potential handle on the right, indicating that the price is accumulating strength for the next move.
Now, here’s where things get interesting: if buying pressure aligns with Dow Theory waves and the Fibonacci retracement levels at 0.786 and 0.618 hold steady, with the price breaking through the neckline, this setup could push gold to 4500 USD.
However, if selling pressure comes in stronger than expected, the pattern may fail, and we could see a price pullback.

Gold (XAU/USD) Potential Bullish Reversal Setup – Entry Zone For**Analysis:**
The chart illustrates a possible bullish reversal scenario after a recent downward move in Gold (XAU/USD). The marked *Change of Character (ChoCH)* indicates an early sign of a trend shift from bearish to bullish momentum.
Price has entered a **consolidation zone** near the support area, where the **entry level** is highlighted. This zone suggests accumulation and potential preparation for an upward move.
The setup shows:
* **ENTRY:** Around current support, within the highlighted range.
* **STOP:** Below the recent low, providing risk control if the reversal fails.
* **TARGET:** The projection points to a **100% measured move**, aligning with a strong bullish continuation potential toward 4,700 levels.
If price maintains structure and confirms a breakout above the short-term resistance, it may initiate a new **bullish impulse phase**.

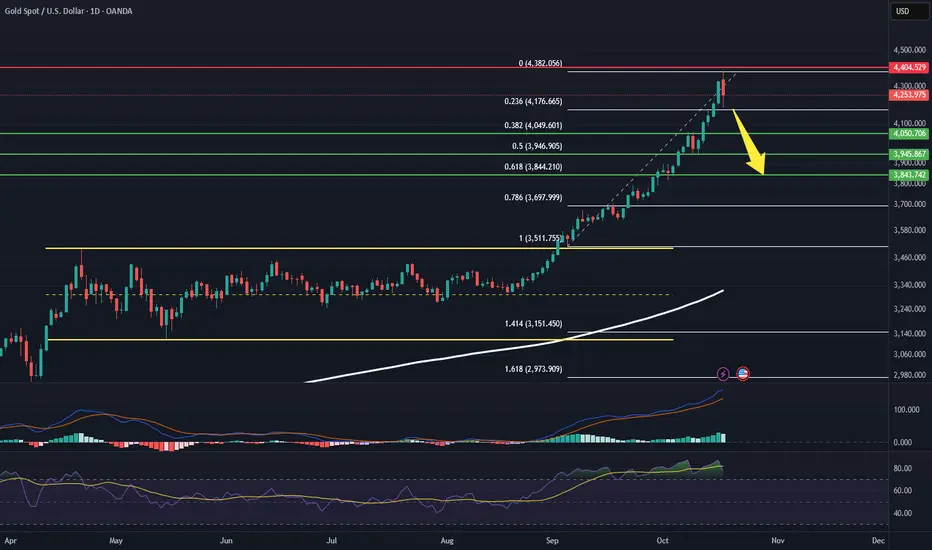
Is Gold (XAUUSD) Set for a Major Pullback? Short Below 4185!Gold has been in a massive range between 3500 and 3120 (a 320-point base). Following the breakout, we witnessed an explosive rally up to 4380 —an 880-point surge, nearly 2.5x the previous range!
But now, caution is warranted. Gold has formed a bearish reversal candle at the peak, and the RSI is deeply overbought . Despite the strong bullish trend, a confirmed short signal will trigger only if Gold breaks below 4185 .
Trade Setup:
Entry: Sell Gold (XAUUSD) below 4185
Sell on Rallies: Add to shorts near 4280
Targets:
1st target: 4050 - 4000
2nd target: 3850
Stop Loss / Invalidation: Close shorts if price moves above 4402
Why this setup matters:
With Gold’s momentum stalling at key resistance and technical indicators signaling overextension, a well-timed short could capture a strong corrective move.
Do you agree with this bearish outlook?
👍 Like if you’re ready to short!
💬 Comment your take or questions below — let’s build a powerful, informed trading community!
Your feedback drives our content and keeps everyone trading smarter. Let’s make those pips together! 🚀
Happy Trading,
– The InvestPro Team
Trading strategy for GOLD after 6.8% fall: 21/10/25Increase in profit booking volume, easing of the US-China trade war, strengthening of the USD, contributing to the decline of XAUUSD.
Technical levels and trading strategies are the main topics of this video analysis.

Selling in GoldGood has mede M pattern in 4 hour time frame.
Entry, SL and target is mentioned in the chart.
A good Risk Reward Ratio is there 1:2.
An entry after retracement in 1 hour time frame will be much better. And will better make the trade efficiency and Risk.
For more such content, subscribe to my channel given in bio.
Note: This analysis is for Educational Purpose Only. Please invest after consulting a professional financial advisor.

Bullish Scenario (Primary Setup): Entry (Buy Zone): 4,180 – 4,2Technical Overview:
Gold is currently in a retracement phase, testing a strong BUY ZONE between 4,180 – 4,200.
This zone has previously acted as a major support area, where buyers stepped in.
The chart shows a possible bullish reversal pattern forming near this zone, suggesting a potential rebound.
🟩 Bullish Scenario (Primary Setup):
Entry (Buy Zone): 4,180 – 4,200 LME:ZS1! LME:CA1! LME:AH1! LME:NI1! LME:HC1! LME:MC1! LME:PB1! LME:SN1! LME:MZ1! LME:MA1! LME:SR1! LME:AN1!
Target: 4,384
Stop-Loss: Below 4,160
Rationale:
The buy zone aligns with previous price reactions, confirming strong demand.
Wick rejections around 4,190 indicate buyer interest.
Price action suggests a possible V-shaped recovery or higher-low formation before continuation upward.
🟥 Bearish Scenario (Alternative):
If price closes below 4,160, the support zone will be invalidated.
In that case, expect further downside toward 4,120 – 4,100.
⚙️ Summary Table:
Parameter Value
Trend Bias (Short-Term) Neutral to Bullish
Key Support (Buy Zone) 4,180 – 4,200
Target 4,384
Stop-Loss Below 4,160
Risk–Reward Ratio ≈ 1:3
📊 Conclusion:
Gold (XAU/USD) is approaching a critical support zone. As long as the price holds above 4,160, a bullish rebound toward 4,384 remains likely. However, a confirmed break below this level could trigger a deeper correction.

Gold analysis /future move Gold today has fallen 150 $ roughly from day high .
if it breaks the support line and goes below 4187 it has a chance to fall further towards 4108 an 4046 .Double top pattern breakdown can be seen
if 4087 holds then gold can go high again.

XAU USD SELL OFF Good sell off in Xau USD from top level .it's falling from 4331. Now at support near 4200. If crossed below 4200 then again good sell off . Or may take support here and then fall again after taking retracement. Let us see what may happen further. Support 4200 Round level . If fall then 4167 possible.
For more visit my Tradingview Profile

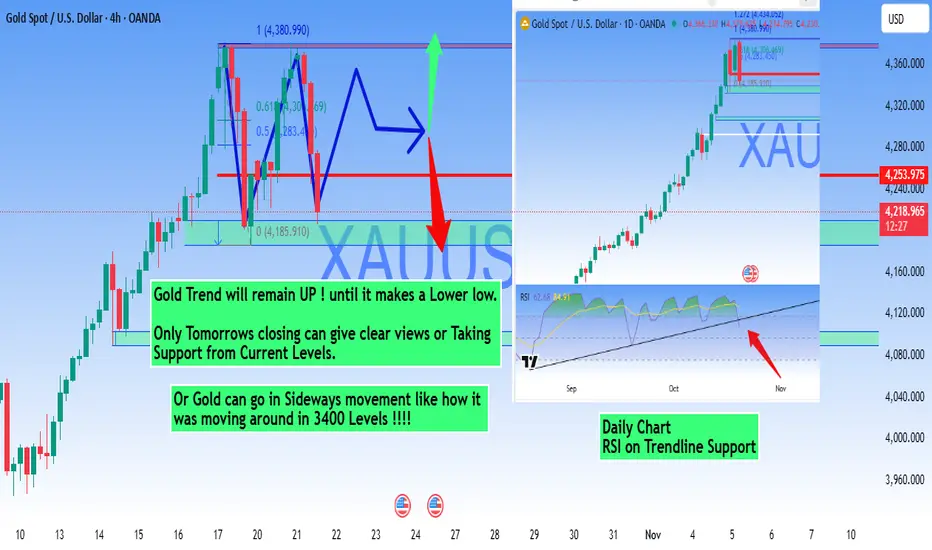
#xuausd Make or Break - Gold Analysis🥇 GOLD (XAU/USD) - Technical Analysis & Outlook
Timeframe: 4H & Daily Charts
Current Price: 2,718.99
Market Structure Analysis
Gold is currently in a **strong uptrend** and will maintain its bullish bias until it forms a clear lower low. The recent consolidation near all-time highs suggests a potential for either continuation or a sideways movement phase.
Key Price Levels
Support Zones
- Immediate Support: 4,218.99 - 4,240.00
- Major Support: 4,185.91 (0 Fibonacci - Recent Low)
- Critical Support: 4,160.00 - 4,180.00 zone
Resistance Zones
- Immediate Resistance: 4,253.97 (Current High)
- Next Resistance: 4,280.00 - 4,300.00
- Target Extension: 4,320.00 - 4,360.00
- Major Target: 4,380.99 (Fibonacci Extension)
Technical Scenarios
- Continuation of the current uptrend expected
- Any pullback to support zones presents buying opportunities
- Target: 4,280 - 4,360 zone
- Extended Target: 4,380+ levels
Consolidation Scenario (Secondary)
Condition: Sideways movement similar to the 3,400 consolidation phase
- Gold may enter a ranging phase at current elevated levels
- Watch for sideways movement between 4,200 - 4,280
- Accumulation pattern before next leg up
- Patience required during this phase
🔴 Bearish Scenario (Alternative)
Condition: Only if price breaks and closes below 4,185
- Bearish only on confirmed break of structure
- Potential retracement to $4,160 or lower
- Wait for clear reversal signals before shorting
RSI Analysis (Daily Chart)
- RSI Position: Near trendline support (around 62)
- Signal: RSI holding above trendline support indicates continued bullish momentum
- Watch For: RSI breakdown below trendline would signal weakening momentum
- Strength: RSI still in bullish territory, no divergence observed
Key Observations
1. **Strong Uptrend Intact:** No lower lows formed yet, trend remains bullish
2. **Fibonacci Levels:** Price respecting key Fibonacci retracement zones
3. **Consolidation Pattern:** Similar behavior to previous $3,400 consolidation
4. **Volume Profile:** Accumulation visible near support zones
5. **Daily RSI:** Holding trendline support, maintaining bullish structure
Critical Points to Monitor
🔸 22/10/2025 Close: Will provide clearer direction
🔸 Support Level: 4,218 - Must hold for bullish continuation
🔸 RSI Trendline: Break would signal momentum shift
🔸 Volume: Watch for increasing volume on moves
🔸 Global Events: Fed policy, geopolitical tensions, USD strength
🎓 #Trading Wisdom
"The #trend is your friend until it bends. #Gold will remain #bullish until it makes a #lowerlow. Stay patient, follow the structure, and let the market show its hand."*
Risk Disclaimer
This analysis is for educational purposes only and should not be considered financial advice. Always manage your risk appropriately, use stop losses, and never risk more than you can afford to lose. Past performance does not guarantee future results.
Like and Follow for Daily Gold Analysis!
#Gold #XAUUSD #GoldTrading #TechnicalAnalysis #ForexTrading #PreciousMetals #TradingView #MarketAnalysis
Gold 1H – Can Gold Hold Above 4247 as Powell Takes the Stage?XAUUSD – Intraday Trading Plan | by Ryan_TitanTrader
📈 Market Context
Gold holds firm near ₹4,230, with traders cautiously awaiting U.S. Retail Sales data and Fed Chair Powell’s remarks later today.
After a series of softer inflation reports, market sentiment has tilted mildly dovish — yet the U.S. dollar remains steady as investors hesitate to price in early rate cuts.
The Fed’s tone today will be critical: a hawkish Powell could trigger short-term profit-taking on gold, while any dovish signals may reignite safe-haven bids.
Expect choppy intraday movement with liquidity sweeps around key zones before a confirmed directional move emerges.
🔎 Technical Analysis (1H / SMC Style)
• The structure remains bullish, confirmed by previous Breaks of Structure (BOS) and a Change of Character (ChoCH) earlier in the week.
• Price is now approaching a premium supply zone at 4247–4249, where potential short-term sell reactions could appear before retracement.
• Below, the discount demand zone at 4184–4186 aligns with prior BOS support and acts as a high-probability reaccumulation area.
• If price revisits the buy zone and forms bullish confirmation on M15, continuation toward new highs around 4260+ is favored.
🔴 Sell Setup: 4247 – 4249
SL: 4255 – 4257
TP targets: 4210 → 4195
🟢 Buy Setup: 4184 – 4186
SL: 4174
TP targets: 4210 → 4245 → 4260+
⚠️ Risk Management Tips
• Wait for M15 BOS/ChoCH confirmation before executing either setup.
• Watch for volatility spikes around Powell’s speech and U.S. Retail Sales release — spreads may widen.
• Consider partial profits at intra-day liquidity points and trail stops once structure confirms.
✅ Summary
XAUUSD maintains its bullish structure but may face a liquidity sweep above 4247–4249 before a deeper retracement into 4184–4186.
Institutional activity could drive accumulation near the discount zone if macro data supports dovish sentiment.
The intraday bias remains “Buy the Dip”, with tactical sells possible at premium resistance for short-term scalps.

Gold 1H – Slight Correction or Bullish Reaccumulation Ahead?XAUUSD – Intraday Trading Plan | by Ryan_TitanTrader
📈 Market Context
Gold extends its rebound near ₹4 250 as traders weigh the recent uptick in U.S. Treasury yields against growing expectations of a softer Federal Reserve stance.
After the latest mixed U.S. economic data, markets are leaning toward a mildly dovish outlook — rate-cut bets for early 2026 are gaining traction, while the dollar remains steady.
Today’s focus centers on U.S. housing-starts and jobless-claims data, which could steer short-term volatility.
A stronger-than-expected report may trigger temporary selling pressure on gold, while weaker figures could revive safe-haven demand and extend the rally toward ₹4 380 +.
Expect liquidity hunts before any clear directional move, as institutional players refine positions near the week’s range extremes.
🔎 Technical Analysis (1H / SMC Style)
• Market structure remains bullish, with previous Breaks of Structure (BOS) confirming continuation after the earlier accumulation phase.
• A short-term Change of Character (ChoCH) signals corrective movement — likely a liquidity sweep before the next bullish leg.
• Liquidity resting below ₹4 200 has already been taken, aligning with the discount zone around ₹4 196 – ₹4 198.
• A potential re-accumulation is forming; buyers may look for confirmation (M15 BOS/ChoCH) inside this demand zone.
• Upside liquidity targets cluster near ₹4 375 – ₹4 380, coinciding with a premium supply zone where sellers might re-enter.
🔴 Sell Setup
Entry: 4378 – 4376
Stop-Loss: 4386
Take-Profit Targets: 4325 → 4260
🟢 Buy Setup
Entry: 4196 – 4198
Stop-Loss: 4190
Take-Profit Targets: 4250 → 4370 → 4380 +
⚠️ Risk Management Tips
• Wait for lower-timeframe BOS/ChoCH confirmation before execution.
• Be cautious around U.S. macro data releases — spreads and volatility can widen temporarily.
• Use partial take-profits at nearby liquidity zones and trail stops once market structure confirms continuation.
✅ Summary
Gold maintains its bullish bias above ₹4 200 after sweeping liquidity.
A short-term correction could retest ₹4 196 – ₹4 198 for fresh buy entries, while the broader trend remains upward.
Only a clean structural break below ₹4 190 would invalidate the bullish continuation scenario.
FOLLOW RYAN FOR MORE USEFUL TRADING IDEAS!!!

Part 2 Intraday Master ClassHedging and Risk Management with Options
One of the main uses of options is hedging, or protecting against adverse price movements. For example, a portfolio manager might buy put options on stocks to guard against potential losses during market declines. This acts like insurance—limiting downside while keeping upside potential. Options can also hedge currency, interest rate, or commodity exposure. However, hedging isn’t free; the premium cost reduces overall returns. Smart traders use hedging selectively, balancing risk and cost. In volatile markets, effective hedging with options can prevent significant capital erosion and ensure stability in long-term investment strategies.

XAUUSD – Bearish scenario activatedXAUUSD – Bearish scenario activated: watch for sell retest at 4,303–4,305, deep buy at 4,208–4,210 🟡
Gold just hit a historic peak at 4,381 but the subsequent sharp drop opens up the risk of a short-term correction. On H1, the price is blocked by the descending trendline and the sell zone cluster at 4,30x; below are liquidity zones and the bottom trendline waiting to be retested.
Quick chart insights
The structure shifts to a descending triangle pullback after breaking the upward momentum.
Sell zone 4,303–4,305 coincides with the descending trendline + thick volume (VP).
Below 4,26x is Liquidity Buy; deeper is the 4,208–4,210 mark near FE 4.236 and the trendline base — the final “shakeout” zone before recovery.
Trading plan (if–then)
Sell retest (priority in weak rebound)
Entry: 4,305–4,303
SL: 4,310
TP: 4,287 → 4,260 → 4,242 → 4,220
Condition: rebound to 4,30x and appearance of rejection/engulfing candle on H1 below the descending trendline.
Deep buy (liquidity sweep + bounce back)
Entry: 4,210–4,208
SL: 4,204
TP: 4,225 → 4,242 → 4,270 → 4,298
Condition: deep shakeout to 4,21x, appearance of pin bar/absorbing volume at the bottom trendline.
Invalidation
Sell scenario invalidated if H1 closes above 4,310.
Buy scenario invalidated if H1 closes below 4,204 (risk of deeper trendline range).
Key levels to watch (easy to view on mobile)
Resistance: 4,303–4,305 • 4,320–4,325 (descending trendline)
Support: 4,260–4,255 • 4,242 • 4,210–4,208 • 4,200
Expected move: rebound to 4,30x → sell down to 4,26x/4,24x; sweep 4,21x → bounce back to 4,27x–4,29x.
Quick context (macro)
Expectations of Fed rate cuts + geopolitical risks keep the major trend upward, but post-ATH often sees short-term sell-offs to rebalance positions.
Monitor USD/yield fluctuations: a strong USD will support the sell retest scenario; a cooling USD creates opportunities for rebounds from buy zones.

XAU/USD (Gold) chart: Timeframe: 30 minutes...XAU/USD (Gold) chart:
Timeframe: 30 minutes
Price action: Price bounced strongly from an ascending trendline (blue line).
The green zone above represents resistance (previous swing highs).
There’s a red arrow showing an expected upward move to a target point.
🔍 Analysis
Current price: around $4,269
The target point line my marked is near $4,365–$4,375 region.
That corresponds to the previous resistance zone (green box).
🎯 Target summary
Entry zone: around $4,260–$4,270 (near the trendline bounce)
Target: $4,365 – $4,375
Upside potential: roughly +100 to +110 points (~2.5%)
Stop-loss suggestion: below the trendline, around $4,230 (to protect against breakdown)

GOLD: BUY $4235, TARGET $4450! (FED RATE CUT PLAY📰 MACRO PUSH: Low-Interest Rate Tailwinds
Gold is getting a huge boost from the fundamentals:
Fed Rate Cuts: Market is pricing 99% probability of a Fed rate cut next week. This is spot on for Gold. Low rates = Gold will fly!
Safe-Haven: Political instability (US Govt shutdown extending) and trade tensions are pushing safe-haven demand higher.
Key Data: Watch for the delayed CPI data on October 24th. It will be a major trigger!
Summary: The fundamental conviction for upside is max to max. We are ready for the breakout.
📈 TECHNICAL ANALYSIS: The Perfect LONG Setup!
The chart shows Gold is correcting back to the main Demand Zone—a confluence of the Uptrend Line and a crucial structural low. This zone is our go-to for a perfect entry.
🎯 Detailed Trading Strategy
We are activating a long position as price revisits our key zone:
Position: LONG (BUY) - With full conviction on the primary trend.
BUY ZONE (Entry):
$4,237
$4,235 (The most critical Demand Zone)
SL (Stop Loss):
$4,227 (Must protect this level!)
TP (Take Profit Targets):
TP1: $4,245
TP2: $4,255
TP3: $4,265
TP4: $4,275
Final TP: Open (Expecting a New ATH around $4,450+)
DISCLAIMER: This opportunity at the Demand Zone is strongly backed by the macro picture (Fed & Instability). Please use proper risk management!
#GOLD #XAUUSD #Fed #ATH #TechnicalAnalysis #IntradaySetup

GOLD PULLBACK: $4330 SLIDE! Sniping the Fibo BUY Zone🎯 Macro Summary & Bias: USD Stability Triggers Profit-Taking
Gold is extending its corrective slide from the all-time high zone, hitting around $4,331 - $4,330.
Primary Headwind: The US Dollar (USD) attracted buyers for three consecutive days, causing stability which triggered profit-taking in the overbought Gold market.
Long-Term Support: DXY trades slightly negatively due to the US government shutdown and trade tensions, keeping the long-term bullish outlook intact.
Technical Bias: The market is in a deep correction/profit-taking phase. Our focus is strictly on finding the FIBO BUY REACT ZONES to join the underlying bullish trend. DO NOT CHASE THE SELL MOVE.
📊 In-Depth Technical Analysis (H1): Pinpointing the FIBO Reaction Levels
Based on the current corrective structure and the Fibo/Volume zones defined on image_ddd575.png, we have our strategic levels:
1. Strategic SELL Zones (FIBO SELL REACT ZONES):
These are current resistance areas for short-term rejection or supply zone testing:
REACTION FIBO SELL ZONE 4340 - 4320: Current resistance. Look for a SCALP SELL opportunity if the price rejects this zone.
REACTION SELL ZONE - Big Volume for Sell Side 435x: Major supply/liquidity zone if price attempts a deeper retracement.
2. Strategic BUY Zones (FIBO BUY REACT ZONE):
These are the most critical Fibo support zones for initiating Long entries:
REACTION FIBO BUY ZONE 4270 - 4265: The first crucial Fibo Retracement support.
REACTION BUY ZONE - Big Volume For Buy Side 4230 - 4220: The high-volume demand zone and optimal entry point for the major Long trade.
📈 TODAY'S ACTION PLAN
Primary Action (Prioritize BUY): Wait for the price to correct to the REACTION FIBO BUY ZONE 4270 - 4265 or 4230 - 4220.
Long Entry: Execute the BUY entry only upon confirmed reversal candles (H1/M30/M15).
Scalp SELL Action: If the price strongly rejects the 4340 - 4320 zone, a quick SCALP SELL targeting the nearest BUY ZONE can be considered.
Targets (TP): Aim for the highs and the 435x Sell Zone for the Longs.
⚠️ Risk Warning
Risk Management: Always place a safe Stop Loss (SL) below the nearest active BUY ZONE. DO NOT OVERLEVERAGE in this corrective phase.
Wishing all FranCi$$_FiboMatrix traders a disciplined and victorious day!

XAUUSD UPDATE / WE SMASHED BUY TRADEOur Friday buy setup smashed TP exactly as planned ✅
After grabbing liquidity from the lows, gold delivered cleanly into premium zones — and now we’ve flipped short from supply.
Market structure shifted bearish with confirmation — liquidity taken above highs, fib golden zone tapped, and distribution phase active.
Current play: scaling in on retraces between 4348–4358 with next downside targets sitting around 4310, 4280, and extended 4250.
SL above 4360, partials already booked, risk-free on the remaining positions.
Structure clean, bias clear — bears taking over after a textbook liquidity grab.
#XAUUSD #GoldAnalysis #SmartMoneyConcepts #LiquiditySweep #MarketStructure #OrderBlocks #FVG #SwingTrade #PriceAction #ForexSetup #ValhallaFX #TradingViewCommunity

Entry: Near $4,320 – $4,325 (Buy Zone) Stop-Loss: Below $4,310 Market Structure Overview
The price is currently moving inside a descending channel (marked as TRADE LINE).
A Buy Zone is identified between $4,315 – $4,325, which acts as a strong support area.
Price has touched the lower channel line and rebounded upward, indicating buyer interest around that zone.
📉 Short-Term Trend
The short-term trend is bearish due to lower highs and lower lows inside the channel.
However, momentum shows weakening selling pressure near the buy zone.
🟢 Bullish Scenario
If price holds above the Buy Zone and forms bullish candles, expect a potential reversal toward the upper channel line.
A breakout above the upper channel would signal a trend shift, targeting:
Target: $4,381 – $4,385 (as marked on your chart).
🔴 Bearish Scenario
If price breaks below $4,315, it would invalidate the buy zone setup.
Next potential support could be around $4,300 or lower.
📊 Trade Plan Example
Entry: Near $4,320 – $4,325 (Buy Zone)
Stop-Loss: Below $4,310
Take-Profit: $4,380 – $4,385
Risk-to-Reward: Approximately 1:4
⚙️ Summary
Gold is currently consolidating within a descending channel.
A bullish breakout from this structure could open the path toward the $4,381 target zone, confirming short-term bullish reversal momentum. LME:SC1! TMX:SXF1! TMX:CGB1! TMX:CGZ1! TMX:CGF1! TMX:LGB1! TMX:BSF1! TMX:FBA1! TMX:FCN1! TMX:FDO1! TMX:FEB1! TMX:FER1! TMX:FEB1! TMX:FHO1!
