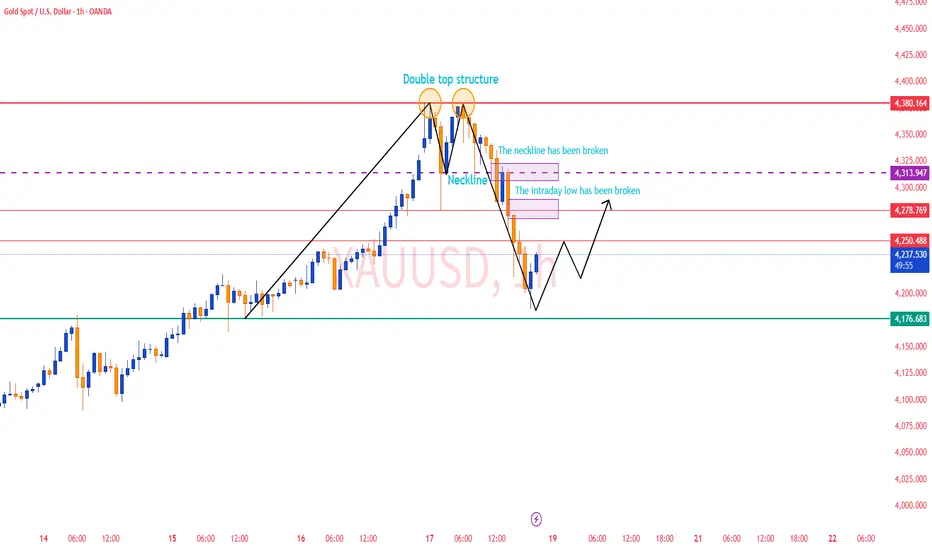
Gold Analysis and Trading Strategy | October 17✅ 4-Hour Chart Analysis:
Gold has entered a clear correction phase after a prolonged rally, with a recent high near 4379.52 followed by a sharp drop to around 4215.
Currently, the price is trading above the Bollinger middle band (around 4111), while MA5, MA10, and MA20 are all turning downward — indicating that short-term bullish momentum is weakening.
The Bollinger Bands are beginning to narrow, suggesting that volatility is calming. As long as the price holds above MA20 (around 4110), the medium-term bullish structure remains intact.
In the short term, gold may continue to consolidate between 4210–4280. If it breaks below 4200, a further correction toward 4150–4170 is possible.
✅ 1-Hour Chart Analysis:
On the 1-hour timeframe, gold has shown a steady decline after peaking near 4379, confirming a short-term bearish shift.
MA5, MA10, and MA20 have formed a bearish crossover, and the Bollinger Bands are opening downward — indicating that bears currently dominate the market.
The price is hovering near the lower Bollinger Band (around 4210), suggesting a potential for a short-term rebound, but resistance lies at 4240–4250.
If the rebound fails to hold, gold is likely to remain in a weak consolidation range between 4200–4250.
🔴 Resistance Levels: 4240–4250 / 4280–4290 / 4320
🟢 Support Levels: 4200–4190 / 4170–4150
✅ Trading Strategy Reference:
🔰 If the price rebounds to 4240–4250 and faces resistance, consider light short positions.
🎯 Targets: 4210 / 4190
🔰 If gold retraces to the 4170–4190 zone and holds steady, consider entering long positions in batches.
🎯 Targets: 4230 / 4250
📊 Summary:
Gold has entered a high-level correction phase after an extended rally. The medium-term bullish trend is still valid, but momentum has slowed.
Traders are advised to control position size, stay flexible, and wait for clearer direction before making larger commitments.
Trade ideas
XAUUSD (Gold/USD) chart (1-hour timeframe)... XAUUSD (Gold/USD) chart (1-hour timeframe), here’s a breakdown of what’s visible:
Price has broken below an ascending trendline and dropped into the Ichimoku Cloud.
My marked target point below, around the 4,100–4,120 zone.
Current price: ≈ 4,217 USD.
Cloud support seems to extend down to roughly 4,100–4,080, and the horizontal support line drawn near the bottom confirms that area as the next target/support level.
✅ Technical Summary (from chart):
Trend: Short-term bearish correction.
Immediate support/target: ≈ 4,100–4,080.
Resistance: Around 4,260–4,285 (top of cloud / broken trendline retest).
📉 Target:
> 🎯 4,100 – 4,080 zone
That’s my likely downside target if price continues following the bearish momentum and cloud support break setup.

XAUUSD (Gold Spot vs. USD) Long Positioney Trade Details
Entry Price: Likely around $4,221.90 (aligned with the SELL marker, but interpreted as a long entry point post-dip).
Stop Loss (Risk Management): Potentially $4,211.12 (below the recent low, ~10.78 pips risk, based on the stop level marked).
Take Profit Target: Possibly $4,374.3 (extrapolating from the upward trend and prior high, ~152.4 pips reward; 3.6% move).
Risk-Reward Ratio: Approximately 1:14 (highly favorable if targeting the recent peak).
Position Size/Amount: 40.263 units (moderate exposure, adjust per risk tolerance).
Trade Direction: Long (BUY), anticipating a continuation of the bullish trend after a minor pullback.
Chart Context
Timeframe: 15-minute intraday (covering ~09:00 to 19:30 UTC).
Price Action: Gold rallied to ~$4,310 earlier (green box marking the breakout), with a dip to $4,221–$4,226. The long setup likely targets a bounce from this support zone, supported by a bullish engulfing candle or momentum resumption.
Indicators: ATR ~5.3 pips suggests low volatility; the trade leverages the broader uptrend (up 18% monthly, 58% YOY) driven by geopolitical tensions (e.g., US-China trade tariffs).
Trend: Strongly bullish, with analysts eyeing $4,100–$4,125 short-term support and potential highs beyond $4,374 if momentum holds.

XAUUSDIf you look at this chart of gold, in the last two years no cycle has given a return more than 19 % ago. Today gold has generated a return of 21% in this cycle and the candle that has formed today, according to me, is a sign of a reversal. What I mean to say is that we should book some profit the time . What do you say?

GOLD Awaiting Sell Reaction at Peak & Buy Pullback Support🔍 Market Context
After a series of strong Break of Structure (BoS) , gold has reached a new ATH at 4,385 USD – marking a sustainable uptrend over the past 3 sessions.
However, this peak area is currently acting as a significant psychological and technical barrier . Buying momentum is temporarily slowing as the price reacts to the Liquidity Zone around 4,351 – 4,385 USD .
The market is in a phase of liquidity rebalancing .
The major trend remains upward, but the current price area may see a short-term correction before further wave expansion.
💎 Technical Analysis
ATH GOLD: 4,385 USD
Sell Liquidity Zone: 4,430 – 4,435 USD → high liquidity resistance zone, potential for short-term sell reactions.
Liquidity Zone $$$: 4,284 – 4,282 USD → nearby support zone, confluence with trendline.
Order Block | Fibonacci Zone: 4,226 – 4,230 USD → deep discount zone confluencing with Fibo 0.618, high reversal potential.
Overall Structure: remains bullish , but showing short-term signs of weakness as the price fails to hold above 4,360.
📈 Trading Scenarios
1️⃣ SELL Setup – Rejection at peak area 4,385 – 4,433 USD
Entry: 4,430 - 4,435
SL: 4,440
TP: 4,425 → 4,420 →4,415→4,410→4405
✅ Condition: Appearance of rejection or strong bearish engulfing candles at high Liquidity zone.
➡️ This is a liquidity reaction setup – sell when the price sweeps the peak and clear sell signals from major players appear.
2️⃣ BUY Setup #1 – Pullback at 4,284 – 4,282 USD
Entry: 4,284 – 4,282
SL: 4,272
TP: 4,290 → 4,300 → 4,310/Open
✅ Condition: Strong H1 candle reaction at support or minor reversal structure.
➡️ Buy with the main trend, taking advantage of a slight pullback around the support Liquidity zone.
3️⃣ BUY Setup #2 – OB Deep Zone 4,226 – 4,230 USD
Entry: 4,226 – 4,230
SL: 4,190
TP: 4,235 → 4,240 → 4,250/Open
✅ Condition: Appearance of bullish BoS or confirming bullish engulfing candle.
➡️ This is a deep discount zone, suitable for swing orders following the main trend.
⚠️ Risk Management
Avoid FOMO buying at high zones (4,360+).
Prioritize observing price behavior at 4,284 and 4,226 before entering orders.
Sell orders at 4,385–4,430 are only triggered if there is a clear confirmation signal.
Maintain moderate volume, avoid averaging down without confirmation.
💬 Conclusion
Gold is accumulating after reaching the peak of 4,385 USD , this is a crucial phase to determine the correction before the new upward wave.
The most effective strategy now is sell reaction at the high peak area 4,385 – 4,430 and buy with the trend at 4,284 – 4,226 USD when confirmation appears.
👉 Reasonable Strategy:
Sell Reaction: 4,385 – 4,430 → TP 4,284 – 4,226
Buy Pullback: 4,284 – 4,282
Buy OB Deep: 4,226 – 4,230

Gold trend - 15 min on range-bound low. A buying opportunity.On 15 min chart, gold is showing a range bound. Also as the weekly candle is a big body green candle, price will hit the high again next week. So on 15 min, we can enter at the bottom of the range bound and exit at the top.

Elliott Wave Analysis – XAUUSD (17/10/2025)🔹 1. Momentum
D1 Timeframe:
The D1 momentum is now fully in the overbought zone → the probability of a reversal is very high.
A corrective move could occur either today or on Monday next week.
H4 Timeframe:
H4 momentum has been sticking together in the overbought zone.
Currently, there are about 5 candles holding the oscillator at this level — typically, 5 to 8 candles mark a potential reversal cycle.
H1 Timeframe:
H1 momentum is still rising → price may extend slightly higher or move sideways to accumulate before a clearer signal appears.
________________________________________
🔹 2. Wave Structure
D1 Chart:
The recent D1 candles are steep and impulsive, showing strong bullish pressure — indicating we are likely in Wave 3 (yellow).
I’ve adjusted the wave labels for better accuracy with current price structure.
Once D1 momentum reverses, we can expect the start of Wave 4 (yellow) correction.
H4 Chart:
• Waves (1) and (3) in blue are similar in length → suggesting Wave (5) blue may become an extended wave.
• Since price has broken above the Elliott channel, we should wait for a strong downward reaction together with momentum reversal on H4 to confirm:
✅ Wave (5) blue is complete,
✅ and Wave (3) purple has also finished.
⇒ Then, the market would begin Wave (4) purple correction.
💡 Note: During an extended Wave (5), avoid selling against the trend.
Be patient and wait for the first downward move — if it’s not deep, then buying from the next pullback would be a more reasonable strategy.
H1 Chart:
Within the blue Wave (5) on H1, we can see a five-wave red structure developing, and price is now in red Wave (3).
Inside red Wave (3), there’s another five-wave black sub-structure, currently in black Wave (4).
By drawing the Elliott channel, we can see that black Wave (4) is likely forming a flat correction, and one final small drop may still occur to complete the structure.
🎯 Ideal Target Zone:
• The high-liquidity area around 4297.
• This is a likely completion zone for the current flat pattern.
• If price doesn’t reach that level, we’ll use channel support confluence to identify the next valid entry area.
________________________________________
🔹 3. Trading Plan
Buy Zone: 4298 – 4296
Stop Loss: 4276
Take Profit 1: 4363

GOLD / XAUUSD – DAILY PLAN (Oct 17, 2025)🧭 MARKET CONTEXT
Main timeframe: M30 / H1
Current structure remains bullish, forming clear HH – HL sequences.
After a strong rally, price is now in a retracement phase toward a nearby demand zone aligned with the ascending trendline.
No sign of structure break yet (no BOS below the previous HL).
📈 PRIMARY SCENARIO (BUY SETUP)
➤ Entry Zone 1:
BUY GOLD 4280 – 4278
Stop Loss: 4275
Target 1: 4335
Target 2: 4350 (new HH)
Reason: This is a Bullish Order Block (OB) and BOS retest zone, aligned with the rising trendline.
Expecting a strong bullish reaction (rejection candle or engulfing bar) before triggering the buy limit.
➤ Entry Zone 2 (CP Setup – Confirmation Point)
BUY 4247 – 4245
Stop Loss: 4239
Target: 4300 / 4330 / 4350
Reason: This is the final demand zone near the main trendline, confluence of prior BOS + SSS (Structure Shift Support).
If price breaks below 4280 without reaction, patiently wait for confirmation around CP zone.
⚠️ ALTERNATIVE SCENARIO (STRUCTURE FAILURE)
If price closes below 4235 on M30, the bullish structure is invalidated.
→ The buy plan is canceled — wait for a pullback sell setup from 4280–4300 resistance.
If the buy stop loss is hit at 4239, monitor 4200 zone as the next H4 demand area.

Gold sweeps SL, wait for BUY LIMIT at Demand Zone 4,223-4,225Timeframe analysis: H4/30M
Logic: Trend Continuation after liquidity sweep.
MARKET STRUCTURE ANALYSIS (SMC Analysis)
Main Trend: Bullish (Price is moving within a parallel channel).
Structure Confirmation (BOS): The chart has confirmed an upward Break of Structure (BOS), indicating that buyers are controlling the market.
Liquidity Sweep/Fake: The strong bearish candle (marked as "Fake") is a move to sweep Stop Losses of early buyers and gather liquidity before Smart Money pushes the price in the main direction. This is an Inducement action.
Key Demand Zone (POI/Demand Zone/Order Block): The TIMING BUY area (4,223.154 - 4,225.000) is a potential Demand Zone/Order Block identified by Smart Money. The price is expected to retest this area before continuing to rise.
MAIN TRADING SCENARIO (LONG SETUP)
SCENARIO: Wait for the price to Pullback to the POI area to enter a buy order, continuing the main bullish trend.
Parameter
Value
SMC Description
Action
BUY LIMIT
Place a pending buy order
Entry Zone (POI)
4,225.000 - 4,223.150
Demand Zone/Order Block after liquidity sweep.
Stop Loss (SL)
4,214.390
Place below the low of the liquidity sweep candle ("Fake Low"), ensuring safety.
Take Profit 1 (TP1)
4,240.000
Target the nearest Swing High.
Take Profit 2 (TP2)
4,250.000
Target psychological resistance and mid-channel.
Take Profit 3 (TP3)
4,260.000+
Target the upper boundary of the parallel channel.
R:R Ratio
Approximately 1:2.5 to 1:3.5 (Depending on TP)
Good R:R ratio for a trend-following trade.
RISK MANAGEMENT
Risk: Only risk a maximum of 1-2% of the account for this trade.
Breakeven: When the price hits TP1, move SL to the Entry point (Breakeven) to protect capital.
Invalidation: If the price closes the D1/H4 candle below the SL level (4,214.390), the buy plan will be invalidated.

Part 2 Ride The Big Moves Call Options Explained
A call option gives the holder the right to buy an asset at a predetermined price, known as the strike price, before the contract expires. Traders buy call options when they expect the asset’s price to rise. For example, if a stock trades at ₹100 and you buy a call with a ₹105 strike, you profit if the price surpasses ₹105 plus the premium cost. Call options are commonly used to leverage bullish expectations, offering high potential returns with limited risk exposure compared to directly purchasing the stock.

Fibo BUY Zone Mandatory for Trend Continuation.🎯 Macro Summary & Bias: The Bulls Are Unstoppable!
Gold is the most sought-after asset as XAU/USD aims directly for the $4,300 mark and further.
Primary Catalyst: Financial markets remain cautious amidst the ongoing US government shutdown.
Driving Force: Widespread USD weakness—fueled by the funding battle in the US government—strengthens the bullish case for Gold.
Record Strength: XAU/USD is maintaining positive upward momentum despite extreme overbought conditions.
Technical Focus: In this continuous Bull market, FIBO is the paramount tool for identifying the critical pullback points to initiate BUY entries.
📊 In-Depth Technical Analysis (H1): Pinpointing the FIBO Reaction Levels
Our core strategy remains BUY ON DIPS at the most precise Fibo levels, leveraging the strong Parabolic structure.
1. Strategic BUY Zone (FIBO BUY REACT ZONE):
This is the most crucial Fibo support zone where we anticipate a high-probability pullback:
4,321.332 The REACTION FIBO BUY ZONE 0.5.
This is the most vital retracement point to catch the next growth wave.
2. Sell/Take-Profit Targets (FIBO SELL TARGETS):
These are the Fibo extension targets where the Longs are aiming:
TP Target 1 (Extension) 4,436.179 The REACTION FIBO SELL ZONE 1.5 - 1.618. The next immediate target for the rally.
TP Target 2 (Deep Extension) 4,538.394 The REACTION FIBO SELL ZONE 2.5 - 2.618. The long-term target if momentum remains unchecked.
📈 TODAY'S ACTION PLAN
Primary Action (Prioritize BUY): Patiently wait for the price to correct to the REACTION FIBO BUY ZONE 0.5 at 4,321.332.
Upon confirmation (H1/M30/M15 reversal candles), confidently activate the Long (BUY) entry.
Targets (TP): Aim for TP Target 1 (4,436.179) and further to TP Target 2 (4,538.394).
⚠️ Risk Warning
Risk Warning: Given the extreme overbought conditions, always place a safe Stop Loss (SL) below the Fibo BUY ZONE and maintain stringent risk management!
Wishing all FranCi$$_FiboMatrix traders a disciplined and victorious day!

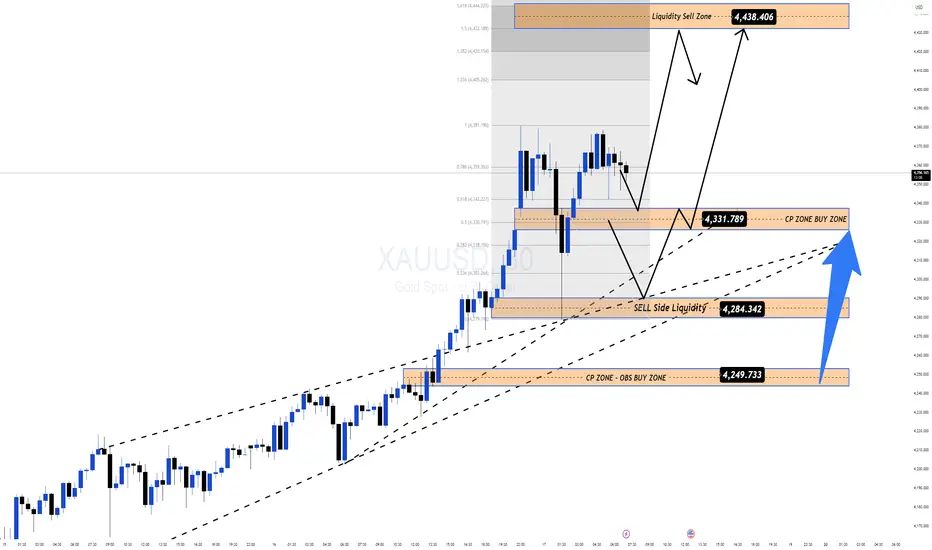
Gold Retests All-Time Highs – Bulls Still in Full Control📊 Market Overview
Gold experienced a sharp intraday drop during the Asian session, testing the 4,280 – 4,279 USD zone before quickly recovering. Despite short-term volatility, it continues to close the week in green for the ninth consecutive time — confirming the strength of the ongoing bullish cycle.
The broader fundamentals remain supportive:
💥 Persistent geopolitical tensions keep safe-haven demand high.
⚖️ US–China trade uncertainty and the risk of a prolonged US government shutdown weaken risk appetite.
💵 Fed rate-cut expectations and USD softness continue to favor gold upside.
In short — Smart Money remains positioned long, and every dip still looks like a liquidity grab for re-accumulation.
🧠 Technical Structure (MMFLOW View)
On the M30 timeframe, gold continues to respect an ascending channel, currently forming a liquidity trap and breakout setup around 4,280 – 4,330.
Price action suggests gold may be completing a short-term corrective wave (B) before resuming the larger bullish impulse.
The structure remains technically bullish, with all pullbacks showing strong rejections from demand zones.
🔑 Key Levels to Watch
🟢 BUY ZONE (Primary Setup)
Zone: 4,230 – 4,228
SL: 4,220
TP: 4,240 – 4,250 – 4,260 – 4,270 – ???
🔵 CP ZONE BUY (Secondary Support)
Zone: 4,284 – 4,285
SL: 4,275
TP: 4,300 – 4,315 – 4,330 – 4,340 – ???
🔴 SCALP SELL (Liquidity Reaction Zone)
Zone: 4,438 – 4,440
SL: 4,448
TP: 4,420 – 4,410 – 4,390 – ???
⚙️ MMFLOW Scenarios
1️⃣ Primary Bullish Scenario:
If gold holds above 4,280 – 4,284, expect continuation toward 4,380 – 4,438 (Liquidity Sell Zone).
The 4,284 level is the key control point where Smart Money may look to re-enter long positions.
2️⃣ Alternative Correction Scenario:
A clean break below 4,280 could drive price toward 4,249 – 4,243 (CP Buy Zone) before another bullish push higher.
This structure still aligns with a Healthy Correction Pattern within a broader uptrend.
⚡️ MMFLOW Insights
Gold remains in a mid-term expansion phase, with both macro and technical alignment favoring continued upside.
The 4,280 – 4,330 range acts as a Smart Money accumulation zone, preparing for a liquidity sweep higher.
Medium-term upside target: 4,438 – 4,445 USD/oz (Liquidity Sell Zone).
⚠️ Trading Notes
✅ Always use a protective Stop Loss — volatility can spike during liquidity hunts.
✅ Avoid chasing entries at highs; wait for reaction around BUY ZONES.
✅ Focus on liquidity confluence zones (Fibo + CP Zone + Order Block) for the highest-probability setups.
🧭 Quick Summary
Gold remains resilient despite early-session volatility.
Watch BUY ZONES at 4,230 – 4,228 and 4,284 – 4,285 for possible long re-entries.
Short-term target: 4,380 – 4,438 USD/oz.
Bias: Bullish – Buy the dips, not the breakouts.
October 17 Gold AnalysisOctober 17 Gold Analysis
Viewpoint: Spot gold has surged strongly, hitting new all-time highs on the back of multiple positive factors, fueling an extremely bullish market sentiment. Technical indicators suggest the market has entered a severely overbought zone, sharply increasing the risk of a short-term correction. This has resulted in significant fluctuations in the current market's upward and downward trajectory. Strategically, we should adhere to the principle of buying on dips and avoid blindly chasing highs. We must set stop-loss orders, manage our positions, and protect our principal.
Gold's strength is primarily driven by the following core factors:
1. Rising expectations of a Fed rate cut: The market currently anticipates a 25 basis point rate cut in October and hopes for another 50 basis point cut in December. These early and aggressive rate cut expectations are putting pressure on the US dollar and reducing the opportunity cost of holding non-interest-bearing gold, becoming the primary driver of gold's price increases.
2. Continued safe-haven demand: The ongoing US government shutdown and international trade tensions continue to attract global safe-haven funds into the gold market, seeking safe haven assets. 3. Structural Buying Support: Continued gold purchases by major global central banks and the long-term trend of de-dollarization provide a solid underlying demand for gold. Furthermore, a significant increase in holdings by the world's largest gold-holding ETF (ETF) further boosted market confidence.
Technical Analysis: Overbought Warning Amidst Extreme Strength
From a technical perspective, the gold market is in a peak bullish phase, but this also sows the seeds for a correction.
Long-Term and Daily Charts:
Unbeatable Trend: The daily chart has closed positive for five consecutive trading days, the TRIX indicator has formed a golden cross, and the MACD indicator's red bullish momentum bar continues to increase, clearly demonstrating that bulls remain firmly in control of the long-term and medium-term trends.
Significant Gains: Since this bullish rally began at $3,311, the price has risen by over $1,000, a significant increase.
Severely Overbought: The daily KDJ indicator is trading in the severely overbought zone, a strong technical warning signal. Historical experience shows that under such extreme overbought conditions, the market is highly likely to experience a significant technical correction within the next 1-3 trading days.
Short-Term (Hourly Chart):
High-Level Fluctuation: After reaching $4,379, gold prices quickly retreated to $4,279 before rebounding to around $4,350, demonstrating significant volatility and divergence between bulls and bears at high levels.
Short-Term Weakness Signal: The hourly KDJ indicator has formed a high-level death crossover after reaching overbought levels, and the MACD red momentum bar has shrunk, indicating a weakening of short-term upward momentum. The trend is relatively bearish and requires consolidation or a pullback to absorb profit-taking.
Trading Strategy
1. Main Strategy:
In the current environment, "buying on dips" is the only reasonable core strategy. Going short against the trend and anticipating a top is extremely risky. The key to trading is patience, waiting for the price to pull back to key support levels before intervening, rather than chasing the price at intermediate levels or after reaching new highs.
2. Key Levels:
Important Support Zone: Focus on $4,280-4,300, particularly around the morning low of $4,279. This area represents a crucial defensive line for bulls in the near term and serves as an ideal area for buying on dips.
Upward Resistance: $4,380 is currently the primary psychological and technical resistance level.
3. Major Risk Warning:
Extreme Volatility Risk: The market has entered a period of historically high volatility, with intraday swings exceeding hundreds of dollars becoming the norm. Traders must manage their positions carefully to avoid being wiped out by excessive volatility.
Technical Pullback Risk: Severe overbought conditions on the daily chart are currently the greatest risk. Any disturbance could trigger large-scale profit-taking, leading to a rapid and significant decline in gold prices. Investors must be fully prepared mentally and strategically for this.
Summary: Gold still has medium-term upside potential, but the short-term path is likely to precede a period of significant volatility or technical correction. Traders should maintain confidence in the long-term trend while remaining cautious of potential short-term fluctuations. It is recommended to participate in the market with a small position, enter the market in batches, and at key support levels. Always set a stop-loss to mitigate the risk of a sudden reversal.
Please be cautious when trading and control the risks! I wish you a smooth transaction!

Introduction to MCX Commodity Trading1. What is Commodity Trading?
Commodity trading refers to the buying and selling of raw materials or primary products, typically classified into two broad categories:
Hard Commodities: Natural resources that are mined or extracted, such as gold, silver, crude oil, and copper.
Soft Commodities: Agricultural products or livestock, including sugar, cotton, wheat, and coffee.
Unlike equities, commodities are traded for their intrinsic value and are influenced by supply-demand dynamics, geopolitical factors, and global economic trends. Trading commodities allows investors not only to profit from price movements but also to hedge against inflation and currency fluctuations.
2. Overview of MCX (Multi Commodity Exchange)
The Multi Commodity Exchange of India Limited (MCX) is the largest commodity derivatives exchange in India. Established in 2003, MCX provides a platform for trading commodity futures, ensuring transparency, liquidity, and regulatory oversight. Key features of MCX include:
Diverse Commodity Offerings: MCX trades in bullion, metals, energy, and agricultural commodities.
Futures Contracts: Investors primarily trade in futures contracts, which are standardized agreements to buy or sell a specific quantity of a commodity at a predetermined price on a future date.
Regulated Environment: MCX is regulated by the Securities and Exchange Board of India (SEBI), ensuring market integrity and investor protection.
Efficient Settlement System: MCX employs secure clearing and settlement mechanisms, reducing counterparty risk.
By providing a robust marketplace, MCX has played a critical role in bringing Indian commodity trading in line with global standards.
3. Understanding Commodity Futures
Unlike spot trading, where commodities are bought or sold for immediate delivery, futures contracts allow traders to speculate on price movements without necessarily owning the physical commodity. Key components of a futures contract include:
Contract Size: Defines the quantity of the commodity covered.
Expiry Date: The date on which the contract is settled.
Lot Size: Standardized unit of trading to maintain market uniformity.
Margin Requirement: Traders must deposit a percentage of the contract value as margin, which ensures commitment and reduces default risk.
Example:
If a trader buys a gold futures contract at ₹50,000 per 10 grams for delivery in June, the trader is obligated to purchase 10 grams of gold at that price in June. However, most traders close their positions before expiry to avoid physical delivery.
4. Categories of Commodities on MCX
MCX offers trading in several categories:
4.1 Bullion
Gold and Silver are the most traded commodities.
Prices are influenced by global demand, currency fluctuations, inflation, and geopolitical tensions.
4.2 Base Metals
Commodities such as copper, aluminum, zinc, and nickel.
Prices are affected by industrial demand, mining output, and global economic conditions.
4.3 Energy
Includes crude oil, natural gas, and other petroleum products.
Heavily influenced by global supply-demand, OPEC policies, and geopolitical factors.
4.4 Agricultural Commodities
Examples: Cotton, cardamom, chana, and sugar.
Influenced by monsoon patterns, crop yields, government policies, and international trade.
5. Participants in MCX Commodity Trading
Understanding the key players helps in interpreting market movements:
Hedgers: Typically producers or consumers of commodities who aim to reduce the risk of price fluctuations.
Example: A gold jeweler hedging against rising gold prices.
Speculators: Traders who seek to profit from price changes without intending to take physical delivery.
Arbitrageurs: Exploit price differences between commodities on different exchanges or in spot versus futures markets.
Institutional Investors: Banks, mutual funds, and hedge funds often participate to diversify portfolios.
6. Advantages of Trading on MCX
Trading on MCX provides multiple benefits:
Transparency: Prices and volumes are publicly available, reducing market manipulation.
Liquidity: High trading volumes make entering and exiting positions easier.
Hedging Opportunities: Producers and consumers can lock in prices, mitigating risk.
Leverage: Traders can control large contract values with relatively small margin deposits.
Diversification: Exposure to commodities reduces portfolio dependency on equities and bonds.
Price Discovery: MCX plays a key role in determining fair market prices through supply-demand mechanisms.
7. Risks in Commodity Trading
Despite its opportunities, commodity trading involves significant risks:
Market Risk: Prices can fluctuate sharply due to global events, weather, or policy changes.
Leverage Risk: While margin trading amplifies profits, it also magnifies losses.
Liquidity Risk: Some commodities may have lower trading volumes, making it difficult to exit positions.
Regulatory Risk: Changes in government policies, taxes, or import/export duties can impact prices.
Operational Risk: Technical glitches, delays, or errors in trading platforms may affect execution.
A prudent trader combines technical, fundamental, and geopolitical analysis to navigate these risks.
8. How to Start Trading on MCX
Step 1: Open a Trading Account
Investors need to open a commodity trading account with a registered broker. Required documents include PAN card, Aadhaar, bank proof, and KYC verification.
Step 2: Choose Commodities
Select commodities based on market research, risk appetite, and trading strategies.
Step 3: Deposit Margin
A minimum margin, defined as a percentage of the contract value, must be deposited to initiate trades.
Step 4: Place Orders
Orders can be placed using online trading platforms, specifying the quantity, contract month, and price.
Step 5: Monitor Positions
Regularly track market movements, news, and global events that influence commodity prices.
Step 6: Close Positions
Traders can either settle at contract expiry or close positions early to book profits or limit losses.
9. Trading Strategies for MCX Commodities
Successful trading involves strategy and discipline. Common approaches include:
9.1 Technical Analysis
Uses historical price patterns, charts, and indicators like moving averages, RSI, and MACD.
Helps identify entry and exit points.
9.2 Fundamental Analysis
Examines supply-demand factors, geopolitical events, government policies, and global trends.
Particularly important for agricultural commodities and energy markets.
9.3 Hedging
Aims to minimize potential losses for businesses exposed to commodity price fluctuations.
Example: A farmer selling wheat futures to secure prices before harvest.
9.4 Arbitrage
Exploits price differences between spot and futures markets or across exchanges.
Requires quick execution and access to multiple trading venues.
10. Factors Influencing Commodity Prices
Commodity prices are driven by multiple interrelated factors:
Global Economic Conditions: Growth or slowdown impacts industrial metals, energy, and demand for commodities.
Currency Movements: Commodities priced in USD are sensitive to exchange rate fluctuations.
Geopolitical Events: Wars, sanctions, and political instability can create volatility.
Weather and Climate: Agricultural commodities are heavily dependent on rainfall, monsoons, and climate change.
Government Policies: Subsidies, import/export restrictions, and price controls affect domestic prices.
Market Speculation: Traders’ sentiment and speculative positions can influence short-term price movements.
11. Regulatory Framework
MCX operates under SEBI regulations and follows strict compliance norms:
Position Limits: Prevent market manipulation by limiting maximum allowable contracts.
Margin Requirements: Ensure traders have sufficient funds to cover potential losses.
Contract Specifications: Standardize trading to maintain uniformity.
Dispute Resolution: Provides mechanisms for grievances and market disputes.
This robust framework enhances investor confidence and promotes fair trading.
12. Technology in MCX Trading
Modern commodity trading relies heavily on technology:
Online Trading Platforms: Allow seamless access to live market data and order execution.
Algorithmic Trading: High-frequency and automated trading based on pre-set rules.
Risk Management Systems: Track margin requirements, position limits, and real-time exposure.
Mobile Applications: Provide flexibility to trade and monitor positions on the go.
Technology has made MCX accessible to both retail and institutional traders.
13. Conclusion
MCX commodity trading offers an exciting avenue for diversification, profit-making, and hedging against market uncertainties. By understanding the nuances of futures contracts, market dynamics, and trading strategies, investors can navigate the complex world of commodities effectively. While risks exist, informed decision-making, disciplined strategies, and continuous learning can make commodity trading a rewarding endeavor.
For beginners, it is recommended to start with smaller positions, focus on learning market patterns, and gradually expand exposure. For professionals, leveraging advanced analytical tools and global insights can enhance profitability. Ultimately, MCX trading embodies a blend of knowledge, strategy, and market acumen, opening doors to opportunities that extend beyond traditional investment avenues.
How AI Predicts Market Moves1. Introduction to AI in Financial Markets
Artificial Intelligence refers to machines and algorithms that simulate human intelligence. In financial markets, AI systems process vast amounts of structured and unstructured data to identify patterns, detect trends, and make predictions. Unlike traditional statistical models, AI can learn from data, adapt to new information, and handle complex non-linear relationships that are often invisible to humans.
AI in finance is broadly used in three areas:
Algorithmic trading: Automated buying and selling of securities based on pre-defined rules.
Risk management: Forecasting potential losses, market shocks, or portfolio volatility.
Market prediction: Anticipating stock price movements, market trends, and economic events.
Market prediction is the most dynamic application because it requires analyzing constantly changing data from multiple sources simultaneously.
2. Types of Data Used by AI
The accuracy of AI predictions largely depends on the data it processes. Financial markets generate enormous amounts of data, which AI leverages to make informed decisions. The main types of data include:
2.1 Structured Data
Structured data refers to organized data that fits into rows and columns, such as:
Historical stock prices
Trading volumes
Earnings reports
Economic indicators (GDP, unemployment rates, inflation)
AI models analyze this data to identify trends and correlations. For example, historical price movements can reveal patterns of bullish or bearish behavior.
2.2 Unstructured Data
Unstructured data is information that does not fit neatly into spreadsheets but holds critical insights, such as:
News articles
Social media posts
Financial blogs
Company press releases
Natural Language Processing (NLP), a subset of AI, allows machines to read, interpret, and extract sentiment from this type of data. Market sentiment analysis is particularly powerful in predicting short-term price movements, as it gauges public opinion and investor psychology.
2.3 Alternative Data
Alternative data refers to unconventional sources that provide indirect market insights, including:
Satellite images (e.g., estimating retail sales from parking lot activity)
Web traffic and search trends
Weather patterns affecting commodities
These data points, when integrated with traditional financial metrics, enhance prediction accuracy.
3. AI Techniques Used for Market Prediction
Several AI techniques are used in predicting market moves. Each method has unique advantages, and many successful systems combine multiple approaches.
3.1 Machine Learning
Machine learning (ML) enables systems to learn patterns from data without being explicitly programmed. Some common ML methods include:
Supervised Learning: Uses historical labeled data (e.g., past stock movements) to predict future prices. Algorithms like Random Forests, Support Vector Machines, and Gradient Boosting are common.
Unsupervised Learning: Identifies hidden patterns without predefined labels, useful for market clustering and anomaly detection.
Reinforcement Learning: AI agents learn trading strategies by interacting with the market environment, receiving rewards for profitable actions.
3.2 Deep Learning
Deep learning is a subset of ML that uses neural networks to model complex relationships. Applications in market prediction include:
Recurrent Neural Networks (RNNs): Effective for sequential data like stock prices over time.
Long Short-Term Memory (LSTM): A type of RNN that remembers long-term dependencies, useful for predicting future trends based on historical sequences.
Convolutional Neural Networks (CNNs): Surprisingly, CNNs can process financial charts as images to detect technical patterns.
3.3 Natural Language Processing (NLP)
NLP allows AI to understand human language. In market prediction, NLP is used to:
Analyze news sentiment to anticipate market reactions
Detect insider rumors or earnings reports before they impact prices
Monitor social media for trends, fear, or hype
For example, a sudden surge in negative sentiment about a company on social media might trigger AI algorithms to predict a stock price decline.
3.4 Hybrid Models
Many sophisticated AI systems combine multiple techniques. For instance, an AI model might use deep learning to analyze historical prices, NLP for sentiment analysis, and reinforcement learning to execute trading decisions.
4. The Prediction Process
The process of AI-driven market prediction typically involves the following steps:
4.1 Data Collection
Data is gathered from multiple sources, including stock exchanges, financial news portals, social media, and alternative data providers.
4.2 Data Preprocessing
Raw data often contains noise, missing values, or inconsistencies. AI systems clean, normalize, and structure the data for analysis.
4.3 Feature Engineering
Key attributes (features) are extracted from the data that may influence market movements, such as price-to-earnings ratios, sentiment scores, or trading volume spikes.
4.4 Model Training
AI models are trained on historical data to learn patterns. For supervised learning, the model learns the relationship between features and outcomes, such as predicting a stock’s next-day price.
4.5 Prediction and Validation
Once trained, the model makes predictions on new, unseen data. Performance is validated using metrics like accuracy, precision, or mean squared error. Continuous retraining is often necessary as markets evolve.
4.6 Decision Execution
In trading applications, AI predictions can automatically trigger buy or sell orders. In advisory contexts, the output guides human traders’ decisions.
5. Advantages of AI in Market Prediction
AI offers several advantages over traditional analysis:
Speed: AI processes vast datasets faster than humans.
Accuracy: It identifies complex patterns and non-linear relationships.
Adaptability: Machine learning models evolve with new data, reducing reliance on static rules.
24/7 Monitoring: AI can continuously monitor global markets, news, and social media.
Emotion-Free Trading: Unlike humans, AI is not influenced by fear or greed, which often drive irrational decisions.
6. Challenges and Limitations
Despite its promise, AI in market prediction faces challenges:
Data Quality: Poor or biased data can lead to inaccurate predictions.
Overfitting: Models may perform well on historical data but fail in real-world conditions.
Market Complexity: Sudden geopolitical events or natural disasters can defy even the best AI models.
Interpretability: Deep learning models can be “black boxes,” making it hard to explain why a certain prediction was made.
Ethical Concerns: AI-driven trading can lead to market manipulation or flash crashes if misused.
7. Real-World Applications
AI is already transforming trading floors and investment strategies:
High-Frequency Trading (HFT): Firms use AI to execute thousands of trades per second based on micro-market trends.
Robo-Advisors: AI-driven platforms recommend personalized investment portfolios based on user goals and risk tolerance.
Sentiment-Based Trading: Hedge funds use NLP to predict stock movements based on news sentiment or social media trends.
Risk Management: Banks employ AI to forecast potential market shocks and manage portfolio exposure.
8. The Future of AI in Market Prediction
AI’s role in financial markets is expected to grow, driven by:
Integration of more alternative data: Incorporating satellite data, IoT sensors, and real-time analytics.
Explainable AI: Developing models that provide clear reasoning for predictions.
Hybrid human-AI decision-making: Combining AI speed with human judgment for better outcomes.
Regulatory oversight: As AI-driven trading becomes dominant, regulators are increasingly focusing on risk mitigation and transparency.
The synergy between AI and human expertise promises a future where market predictions are faster, smarter, and more adaptive than ever before.
9. Conclusion
Artificial Intelligence is revolutionizing how market moves are predicted. By processing massive datasets, identifying hidden patterns, and continuously learning, AI empowers investors and traders to make informed decisions. While it is not infallible and carries inherent risks, its ability to analyze complex market dynamics far exceeds traditional methods. As AI technology continues to advance, its predictive capabilities will become an indispensable tool for navigating the fast-paced, unpredictable world of financial markets.

XAUUSD: Prioritise Buying, Is the $5000 Target Still Far?XAUUSD: "No More Gold to Sell" - Prioritise Buying, Is the $5000 Target Still Far?
Hello trading community,
The Gold market (XAUUSD) is in a state of "extreme euphoria", continuously setting new highs. The upward momentum is not only driven by technical charts but also bolstered by extremely strong macro factors.
This article will analyse why the strategy "Prioritise Buying on Dips" is optimal, and the $4400 mark, though seemingly high, may not be the final stop.
📰 Macro Analysis: "No More Gold to Sell!"
The market is witnessing a physical supply shock that we cannot ignore:
Supply Shock: Japan's largest gold retailer had to temporarily halt gold bar sales due to overwhelming buying demand. This is a clear signal that physical gold demand is far outstripping available supply. When physical gold is scarce, the paper market price must rise to reflect true value.
Falling Bond Yields: The 10-year German government bond yield (representing Europe) has fallen to its lowest since June. Lower yields make Gold (a non-yielding asset) significantly more attractive compared to holding bonds.
Both these factors are creating a "perfect storm" supporting the price rise of XAUUSD.
📊 Technical Analysis
The M30/H1 chart shows a very sustainable parabolic uptrend structure:
Trend: The uptrend is undeniable. The price is moving within a steep upward channel, with all selling efforts quickly absorbed by buyers.
Fibonacci Extension: The Fibonacci extension levels are acting as the next price targets:
Zone $4382 (Fib 2.273): Conquered.
Zone $4407 - $4410 (Fib 2.407): This is a potential "Sell Scalping" zone, where a short correction might occur.
Zone $4480 - $4483 (Fib 2.618): This is a strong resistance "Sell Zone", the next target for buyers.
Volume Profile (VPVR):
Support "Buy Retest" ($4290 - $4300): This is an extremely important liquidity zone, a broken old peak and also an area with large accumulated trading volume. Buyers will strongly defend this zone.
🎯 Detailed Trading Strategy
The main trend is to Buy. All sell orders (Sell) at this time carry high risk and should only be considered for short-term scalping to catch corrections.
Scenario 1: Buy the Dip 📈
Entry Zone: Wait for a price correction to the "Buy retest" zone $4290.
Stop Loss: $4280.
Take Profit: $4312 - $4334 - $4372 - $4390.
Scenario 2: Sell Scalping ⚡️
Entry Zone: Look to sell at the Fibo $4410 zone.
Stop Loss: $4420.
Take Profit: $4393 - $4380 - $4370. (Note: Counter-trend order, go small volume and take quick profit).
Scenario 3: Sell at Strong Resistance Zone 📉
Entry Zone: $4480.
Stop Loss: $4490.
Take Profit: $4463 - $4442 - $4410.
Summary
The combination of a strong technical uptrend and a fundamental supply shock is pushing Gold into a new price cycle. The $4400 mark has been conquered, and with this momentum, the long-term target of $5000 is no longer a fantasy.
The wisest strategy is to "go with the flow", looking to Buy at key support zones.
Wishing traders a successful week!

gold chart prediction(don't predict) after thoroghly analysing and using all the tools that i could use. I have made this chart putting everything in it so according to me gold wil go to maximum of 230700 in rs
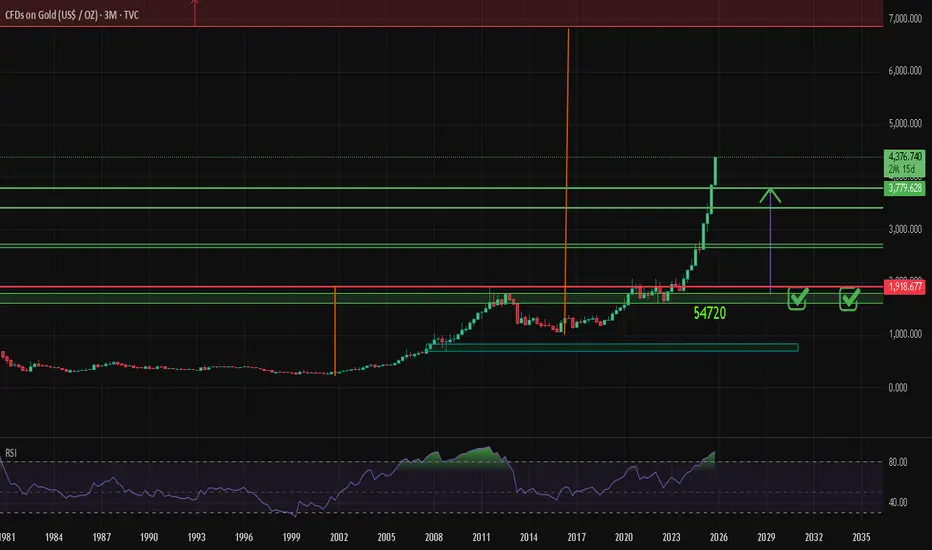
Pause for the Gold Rally#Gold Technical Analysis Report - USD
**Chart Analysis: Gold Spot / U.S. Dollar - 3M**
**Current Price Level:** $2,618 USD
Key Observations:
Gold is currently testing a critical resistance level at 4380.399, which aligns with major Fibonacci extension levels identified on yearly and quarterly charts. The price action shows a consolidation phase after the recent rally, with the market displaying indecision around this significant technical barrier.
Technical Levels:
The Fibonacci retracement structure reveals multiple support zones below the current resistance. Should price face rejection at 4380.399, technical analysis suggests potential pullback zones at 3743, 3403, and 3166 based on the proportional PA (Price Action) alignment on higher timeframe charts.
Market Sentiment:
The long-term uptrend remains intact, with the price structure maintaining higher lows and higher highs from the 1999-2026 timeframe. Current momentum appears to be consolidating before the next directional move, typical of markets approaching significant resistance levels.
Trading Considerations:
Traders should monitor how price responds at the 4380.399 resistance. A break above this level could signal continuation toward 5410 (2.618 Fibonacci extension). Conversely, a rejection could lead to a retest of the identified support zones. Risk management is essential given the proximity to resistance and current consolidation phase.
Disclaimer:
This analysis is for educational purposes only and should not be considered financial advice. Always conduct your own due diligence and consult a financial advisor before making trading decisions.

Gold Trading Strategy for 17th October 2025💰 GOLD INTRADAY TRADE PLAN 💰
🟢 BUY SETUP
📈 Buy Above: The high of the 15-minute candle that closes above $4372
🎯 Targets:
1️⃣ $4383
2️⃣ $4395
3️⃣ $4410
💪 Momentum confirmation required — wait for a strong bullish close above $4372 before entering.
🔴 SELL SETUP
📉 Sell Below: The low of the 15-minute candle that closes below $4278
🎯 Targets:
1️⃣ $4265
2️⃣ $4250
3️⃣ $4235
⚡ Wait for a decisive bearish candle close below $4278 to confirm breakdown.
⚙️ TRADE MANAGEMENT TIPS
💼 Always use a Stop Loss to protect your capital.
📊 Avoid over-leveraging — risk only 1–2% per trade.
🧭 Confirm entries with volume and trend direction before execution.
⚠️ DISCLAIMER ⚠️
This analysis is for educational and informational purposes only.
📉 Trading in commodities and derivatives involves substantial risk and may not be suitable for all investors.
💡 Always conduct your own research or consult a certified financial advisor before taking any trading decision.

Gold trading strategy | October 16-17✅ From the 4-hour chart:
Gold has continued to post multiple bullish candles, reaching a high of 4298.55. The price remains near the upper boundary of the ascending channel, with MA5, MA10, and MA20 maintaining a standard bullish alignment — confirming that the medium-term uptrend remains strong.
However, short-term volatility has increased, and gold is expected to consolidate or slightly retrace within the 4250–4300 range, with key support at MA10 (around 4229).
The Bollinger Bands continue to widen upward, with the upper band near 4298 and the middle band around 4184. The price is currently trading near the upper band, showing that bulls are dominant, but the short-term deviation is large, suggesting a potential technical pullback at any time.
✅ From the 1-hour chart:
After surging to 4298.55, gold experienced a slight pullback and is now fluctuating between 4280–4295. MA5 and MA10 have flattened, indicating that short-term momentum is weakening, while MA10 (around 4266) serves as an important short-term support.
The bullish momentum has slowed, and consolidation is increasing. Gold is likely to oscillate within the 4260–4300 range. If it fails to break above 4300 decisively, a short-term correction could follow.
🔴 Resistance Levels: 4298–4305 / 4325–4335 / 4350
🟢 Support Levels: 4255–4265 / 4225–4235 / 4185
✅ Trading Strategy Reference:
🔰 If gold pulls back to the 4255–4265 area and holds, consider entering long positions in batches.
🎯 Targets: 4290 / 4300
🔰 If gold rises again to the 4295–4305 area and faces resistance, consider a light short position.
🎯 Targets: 4265 / 4255
🔥Trading Reminder: Trading strategies are time-sensitive, and market conditions can change rapidly. Please adjust your trading plan based on real-time market conditions.

Gold (XAU/USD) Breakout Rally Toward New HighsAnalysis:
Gold (XAU/USD) continues its strong bullish momentum on the 4-hour chart, forming a series of higher highs and higher lows, confirming a sustained uptrend. The recent breakout above the resistance zone near $4,150–$4,170 indicates renewed buying interest and momentum buildup.
After a brief retest of the breakout area, price has started climbing again — a sign of trend continuation supported by bullish candle formations and strong market sentiment.
Technical Outlook:
Support Zone: $4,140 – $4,170 (previous resistance turned support)
Bullish Confirmation: Continuation pattern with clean structure and volume support
Momentum Bias: Strongly bullish while above $4,150
🎯 Target: $4,300 – $4,320 zone
🛑 Stop Loss: Below $4,140 to limit downside risk
📈 Summary:
As long as gold stays above the breakout level of $4,170, the market remains bullish, with upside potential toward $4,300–$4,320, aligning with the next major resistance area.

XAUUSD LongtermWhat i look is happening. Month of November is coming. Lets Book some profits in Novrmber for Next years Rally👍😁

XAUUSD/GOLD 1H BUY STOP PROJECTION FOR 17.10.25Chart Info
Instrument: XAU/USD
Timeframe: 1 Hour (H1)
Price: $4,279.99
Strategy: Buy Stop — Trend Continuation
🟦 Market Structure & Trend:
Price is respecting a strong uptrend channel — clearly defined higher highs & higher lows.
Golden Ratio (Fibonacci) at 0.5 (4242.62) and 0.618 (4251.84) acts as premium entry zone for a retracement buy.
Bullish structure remains intact above 4230 zone.
📊 Entry & Target Zones:
✅ Entry Zone: Around 4250 (Golden Fibo + FVG)
🛑 Stop Loss: Below 4230 (structure break = invalidation)
🥇 Target 1 (R1): 4280 (in-channel move)
🥈 Target 2 (R2): 4310 (new ATH projection)
🧭 Technical Confluences:
📈 Uptrend Channel Support — Price expected to bounce after retest.
🟪 15 min Fair Value Gap (FVG) — potential wick entry below 4250.
📐 Golden Ratio Zone — ideal institutional entry point.
🔄 Break & Retest structure — previous resistance now support.
⚠️ Risk & Confirmation:
If candle closes below 4230, trend structure weakens — setup invalid.
Watch for NY Session volatility or major news for breakout momentum.
Partial profit booking near R1 and trailing SL above entry for R2 recommended.
✅ Summary of Plan:
Buy stop setup at retracement zone (4250 area).
SL tight below structure (4230).
TP 4280–4310 with trend continuation.
