Gold Trading Strategy for 26th November 2025✨ GOLD TRADING PLAN – INTRADAY LEVELS ✨
(Well-structured, step-by-step, visually segmented with icons & dollars as requested)
🟢 BUY SETUP – LONG POSITION
📍 Entry Condition:
Buy ONLY IF price breaks & closes above the High of the 1-Hour Candle = $4154+
📌 Clear Trade Logic:
Breaking the previous hour high indicates bullish strength & momentum. A candle close above confirms continuation and reduces false breakout probability.
🎯 Targets for Upside Movement:
Target No. Price Level
🎯 T1 $4168
🎯 T2 $4185
🎯 T3 $4199
🔒 Recommended Stop Loss (SL):
Below previous 1-hour support zone OR below breakout candle low
(This protects against fake breakouts)
🔻 SELL SETUP – SHORT POSITION
📍 Entry Condition:
Sell ONLY IF price breaks & closes below the Low of the 30-Minute Candle = $4106-
📌 Clear Trade Logic:
Break of intra-day support signals bearish pressure. A candle close confirms sellers are dominant and validates the downside.
🎯 Targets for Downside Movement:
Target No. Price Level
🎯 T1 $4090
🎯 T2 $4078
🎯 T3 $4060
🔒 Recommended Stop Loss (SL):
Above breakout retracement zone OR 30-min rejection high.
🧠 Trade Execution Notes (Very Important)
✔ Wait for candle close confirmation, not just wick breakout.
✔ Use proper risk-reward ratio (1:2 or better).
✔ Avoid overleverage & follow strict SL discipline.
✔ Volume confirmation strengthens signals.
✔ Check news & volatility (US data, Fed, Dollar index) 📊
⚠ DISCLAIMER (Mandatory)
This is not financial or investment advice. Levels are shared for educational & chart-analysis purpose only.
Trading in Gold/Commodities involves high market risk — decisions must be based on personal judgment, risk capacity & research.
The user is fully responsible for their trades.
Trade ideas

LiamTrading – XAUUSD H1 | Monday SetupLiamTrading – XAUUSD H1 | Monday Setup
Wait for gold to retest the upper trendline before choosing a direction
Quick Overview
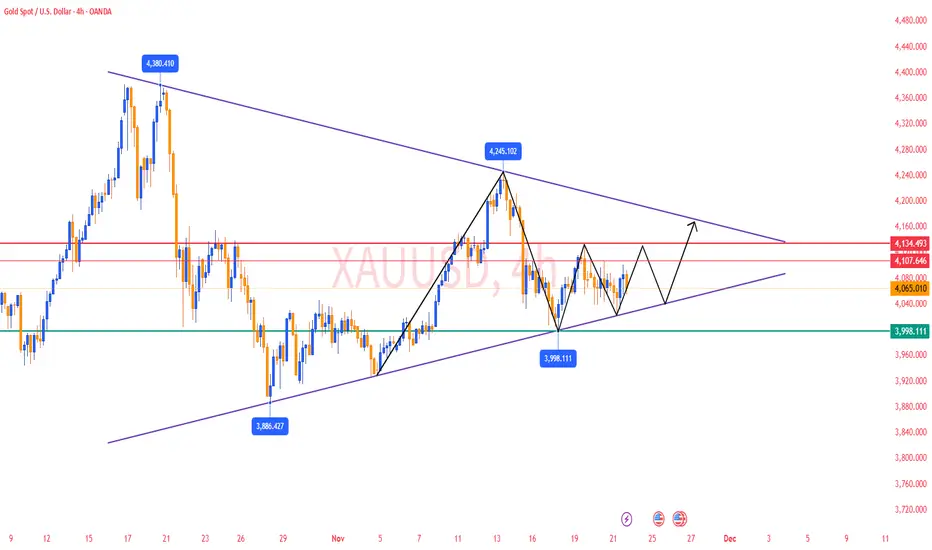
On the H1 timeframe, gold is still moving inside a triangle pattern with a descending upper trendline and a gradually rising lower trendline. In my view, price still needs a bullish swing to retest the upper trendline – which aligns with the FVG zone + Volume Profile POC – before deciding a new trend (either a breakout to the upside or a reversal downward).
Regarding the USD, many Fed officials have begun signaling that rate cuts may happen, but they remain very cautious. UBS and Barclays both lean towards the scenario that the Fed could cut rates in December if upcoming data continues to weaken. This limits the USD’s ability to strengthen too much, giving gold room for a technical pullback into resistance zones.
H1 Technical Analysis
Current structure: price is consolidating sideways, with lower highs along the descending trendline and higher lows supported by the lower trendline.
Zone 4079–4081:
FVG + Volume Profile POC.
This area aligns with the upper trendline → a strong confluence resistance zone, suitable for a reaction-based short setup.
Nearest support zone: around 4040–4035; if this level breaks, price may likely head back to retest 4010–4000.
A clear bullish reversal signal only forms if an uptrend structure returns, at least when price breaks and holds above 4061, then continues through the descending trendline.
Trading Scenarios (Reference Only)
Sell at FVG + POC + Trendline (Priority setup)
Entry: 4079–4081
SL: 4086
TP: 4060 → 4045 → 4010
Logic: Price is expected to move up to fill the FVG and touch the POC/trendline before sellers step back in. This zone has strong confluence, offering a better win rate than shorting inside the sideway range.
Buy when bullish structure is confirmed
Conditions: Price must break above 4061, close an H1 candle holding above this level, and break out of the descending trendline.
Entry (reference): 4061–4068 (retest of breakout zone)
SL: 4050
TP: 4095 → 4130 → 4150
In this case, the triangle pattern breaks upward, Dow Theory bullish structure returns, and the priority is buying with the new trend rather than trying to short the top.
Trading Notes
Possible scalp levels: 4060, 4040, 4010, 4130 – always wait for clear candle reactions on M5–M15 before entering.
Risk per trade: 0.5–1% of account size; once the trade reaches around 1R, move SL to breakeven to protect your capital.
If you have a different scenario for XAUUSD H1 today, leave a comment and follow LiamTrading for daily gold strategies on TradingView.

Part 2 Intraday Trading Master ClassMargin and Risk Management
Option buying requires no margin except the premium.
Option selling requires high margin because:
Risk is unlimited.
Exchanges demand safety.
Risk Management Rules
Never sell naked options without stop-loss.
Avoid selling during high volatility events.
Use spreads to reduce risk.
Position size properly—do not over-leverage.

GOLD REVERSAL AREA GOLD will reverse from this area for sure if you see any CHoCH in these level in 5MIn hold it till bottom

Brian – Gold Money Flow Map for the US Session TodayBrian – Gold Money Flow Map for the US Session Today
Technical analysis – trendline, FVG, and two clear scenarios
On H4, gold is still maintaining a medium-term uptrend line drawn from the end of October. The decline in the Asian session this morning was not strong enough to break the structure; the price touched the trendline and then bounced up, indicating that the sellers have not yet "crushed" this support area.
Current structure: The price is accumulating around the 4,050–4,080 area in a sideways candle cluster, lying on the uptrend line and above the 4,000 support.
Above, the 4,120–4,170 area is an FVG + important supply zone; higher is a larger FVG around 4,280–4,330 – if "filled," it is a potential area for a strong profit-taking move.
Below, the 4,000 mark is a key support; losing this mark, the price could quickly slide to the 3,884 area – marked on the chart as the level confirming a medium-term downtrend if breached.
Until 4,000 is broken, I consider this an accumulation area with a high possibility of "fake breaks" on both sides – so prioritize trading according to the trendline, not guessing tops and bottoms in the noise area.
Key levels
Resistance / sell zone: 4,100–4,110: buy confirmation zone, if rejected will become short-term supply
4,170–4,173: FVG / supply, medium-term short zone
4,280–4,330: large FVG above
Support: 4,048–4,050: trendline + intraday breakout zone
4,022–4,005: next support if the price slides off 4,040
4,000: psychological and structural support
3,884: final support; breaking down will confirm a medium-term downtrend
Trade scenarios (for reference, not investment advice)
1. Sell break intraday – follow the trend if the trendline breaks
Entry: sell when the price breaks the short trend at 4,048–4,050
SL: 4,056
TP: 4,040 → 4,022 → 4,005
Idea: if the price breaks below the current accumulation cluster and short trendline, I want to follow the initial selling force, targeting the adjacent support area 4,022–4,005. When the order goes right, SL can be moved to BE around 4,040.
2. Sell “premium” – short at the upper FVG zone
Entry: 4,170–4,173
SL: 4,178
TP: 4,160 → 4,145 → 4,122 → 4,100
This is a price zone I consider "beautiful" for medium-term trading if the market gives a deep retracement. FVG + H4 resistance converge; if the price is strongly rejected here, the TPs are successively the lower demand zone and the current range bottom.
3. Buy only after clean breakout – do not rush to catch the bottom
I am only interested in buy orders when the market structure truly confirms:
Trigger: H1/H2 candle closes clearly above 4,100
Entry: buy right around 4,100 after breakout
SL: 4,092
TP: medium-term towards the 4,145 → 4,170 → 4,230+ depending on momentum
This scenario considers 4,100 as the "exit door" from the current accumulation area. If this area holds as new support, buyers will have a clearer advantage and the money flow could push the price up to gradually fill the upper FVGs.

Strong news chain could push gold to retest 4300🟡 XAU/USD – Weekly Trading Plan (Nov 23–29)
SMC – FVG – Supply/Demand – High-Impact News Week
1. Market Context
Gold is sideways in the H4 accumulation structure, forming higher lows along the trendline.
Above are 3 important supply layers:
OLD FVG 1
OLD FVG 2
Large FVG 4220–4300
the price needs to sweep liquidity & hit the supply zone before creating a new direction.
2. Strong News Schedule for the Week
This week has a lot of USD news directly affecting gold:
Tuesday (Nov 25)
Core PPI – Retail Sales – PPI (4 consecutive red news) → strong volatility.
Wednesday (Nov 26)
Unemployment Claims
Durable Goods → Core Durable Goods
GDP q/q – GDP Price Index
Core PCE (most important inflation news of the week)
➡️ This is the decisive day for the trend for the rest of the week.
Friday (Nov 28)
German CPI (affects EUR → USD indirectly)
🎯 News Conclusion:
→ Gold likely to fake move – sweep liquidity before running correctly.
→ Thin SL zones will be continuously hunted.
3. Key Levels (from the chart you sent)
🔻 SELL Zone (Supply – FVG)
4189 – 4191 (Main Sell)
SL: 4195
This is a strong reaction zone for the week.
4132 – 4134 (Sell scalp)
SL: 4138
🔵 BUY Zone (Demand – Trendline – SMC)
4906 – 4904 (main BUY scalp zone in the chart)
SL: 3999
→ This is the only zone clearly marked as BUY in the chart.
Psychological level: 4000 – 3985
If the price falls → strong reaction to form the weekly low.
4. Weekly Trading Scenarios
🅰️ Scenario 1 – Price retraces to supply zone before dropping (most likely)
Price is forecasted to retest 4132–4134 → 4189–4191
After hitting 4190 ± → potential appearance of:
Bearish BOS H1/H4
Strong reversal to 4050 – 4000
🔻 SELL Plan
Sell 4132–4134 (scalp) SL 4138
Main Sell 4189–4191 SL 4195
TP targets:
TP1: 4090
TP2: 4050
TP3: 4000
🅱️ Scenario 2 – Price dips before news then surges (kill liquidity)
If gold is pushed down before PPI/GDP news:
Best BUY zone: 4000 – 3985
Form a low → surge back up to test supply.
🔵 BUY Plan
BUY 4000–3985
SL: 3975
TP:
4050
4100
4130
🅾️ Scenario 3 – If 4200 breaks
If 4200 is broken by a large-bodied H4 candle:
➡️ High probability gold will move up to test large FVG 4250–4300
→ At that point, only look for BUY pullbacks, no more SELL.

XAU/USD – Gold Under Heavy Pressure, 4,000$ Break Looks ImminentGold continues to slide as the US Dollar strengthens, fueled by resilient US data. With markets waiting for the final week of November and the upcoming FOMC decision, safe-haven flows remain weak—making XAU/USD extremely vulnerable to further downside.
📊 Technical Outlook – H1/H30
The short-term structure remains clearly bearish:
1️⃣ Trend Bias: Bearish
Price keeps rejecting the descending trendline.
Every pullback is shallow and absorbed quickly by intraday supply zones.
2️⃣ Key Technical Levels
Resistance / Supply Zones:
4,078 – 4,089
4,104 (major confluence: Fibo + H1 supply)
Support / Liquidity Targets:
4,023 – 4,013
3,989 – 3,975 → major liquidity zone (high reaction probability)
3️⃣ Scenarios to Watch
🔻 Scenario 1 — Continuation Drop (Primary Bias)
Break below 4,044 → targets 4,023, then the liquidity sweep at 3,99x – 3,97x.
🔄 Scenario 2 — Pullback Before Drop
Retracement to 4,054 – 4,078 → rejection → continuation lower.
🔺 Scenario 3 — Deeper Recovery (Low Probability)
Only valid if price closes above 4,104, unlocking a move toward 4,13x – 4,15x.
🎯 MMF Trading Plan
SELL – Trend-Following (Primary)
Sell Zone 1: 4,054 – 4,078
SL: 4,105
TP: 4,023 → 4,013 → 3,99x
Sell Zone 2: 4,089 – 4,104
SL: 4,112
TP: 4,054 → 4,023
BUY – Only as a Reaction Trade (Liquidity Sweep)
Buy Zone: 3,99x – 3,97x
SL: 3,955
TP: 4,023 → 4,054
⚠️ Buy setups are counter-trend and require strong confirmation.
Primary bias remains SELL as long as price stays below 4,104.
⚜️ MMFLOW TRADING View
Gold is being pushed toward the psychological 4,000$ support.
A clean break could trigger a broader bearish expansion into 3,98x – 3,95x.
With month-end positioning, FOMC expectations, and shifting Fed sentiment, volatility is likely to increase sharply.
Stay with the trend—SELL the rallies. BUY only at deep liquidity zones with confirmation.

Gold Stuck Between 4050-4100. Now What?Gold price is currently trading in classic range-bound behavior on the daily timeframe, with price action consolidating between the 4050-4100 area (On closing basis ) as marked by the rectangle on the chart.
Based on the current technical setup, I'm anticipating continued consolidation for approximately 6-7 weeks from this point. However, this isn't likely to be a simple sideways move the consolidation is expected to carry a bearish undertone, meaning we may see more pressure toward the lower end of the range during this period.
after mid-January, conditions appear favorable for a fresh buying rally to develop. This consolidation phase may simply be the market gathering momentum for the next leg higher, allowing for profit-taking and position adjustments before the next bullish impulse.
While range trading can be tempting during consolidation phases,., buying on dips remains the more favorable approach.


Gold H1 – Liquidity Plays as Hassett Leads Fed Chair Race🟡 XAUUSD – Intraday Smart Money Plan | by Ryan_TitanTrader (26/11)
📈 Market Context
Gold opens the week reacting to fresh political headlines as Kevin Hassett emerges as the frontrunner for Trump’s next Fed Chair.
This matters for gold because:
• A hawkish-leaning Fed Chair pick typically strengthens USD and weighs on gold.
• Markets may price in tighter policy expectations, increasing short-term bearish pressure.
• Political volatility ahead of the official announcement often triggers liquidity grabs on both sides.
With sentiment shifting toward a stronger USD, gold is positioned for classic SMC-style sweeps around key premium and discount zones.
🔎 Technical Analysis (1H – Smart Money Structure)
• Market Structure
Price has tapped into a minor premium zone and is showing early rejection signs.
Below, the 4140–4138 area aligns with intraday demand and the origin of recent displacement.
• Premium Sell Zone (1H Supply)
4210 – 4212
• Sits above current buy-side liquidity
• Clear premium relative to intraday structure
• High-probability sweep zone before any downside displacement
• SL region: 4220 liquidity pocket
• Discount Buy Zone (1H Demand)
4140 – 4138
• Previous CHoCH origin
• Aligns with discount retracement
• Confluence with unmitigated internal demand block
• SL region: 4130 sell-side liquidity
• Liquidity Map
• Buy-side: 4212 → 4220
• Sell-side: 4138 → 4130
Expect the typical SMC sequence:
Sweep → CHoCH → Displacement → Retest → Expansion.
🔴 Sell Setup – Premium Reaction
Entry: 4210 – 4212
Stop-Loss: 4220
Take-Profit:
→ 4160 (reaction level)
→ 4145 (mid-range liquidity)
→ 4140–4138 (discount zone retest)
📌 Only activate after a liquidity sweep + bearish CHoCH on M5–M15.
🟢 Buy Setup – Discount Reaction
Entry: 4140 – 4138
Stop-Loss: 4130
Take-Profit:
→ 4160 (intraday reaction)
→ 4185 (premium edge)
→ 4210 (liquidity sweep target)
📌 Valid only after sell-side sweep + bullish CHoCH.
⚠️ Risk Management Notes
• Headlines around the Fed Chair nomination may create sudden USD strength spikes—wait for structure shifts.
• Avoid trading inside the chop zone 4150–4180 without clear displacement.
• Treat today as a liquidity-driven session, not a directional trend day.
📝 Summary
Gold is rotating between premium and discount zones as markets digest news of Kevin Hassett leading the Fed Chair race, a development that could tilt expectations toward firmer policy.
Institutional players are likely to hunt liquidity above 4210 or below 4140 before committing to direction.
Key Levels Today (26/11)
🔴 Sell Zone: 4210–4212
🟢 Buy Zone: 4140–4138
Prepare for:
Accumulation → Sweep → Displacement → Retest → Target.
📍 Follow @Ryan_TitanTrader for daily Smart Money updates.

Gold Awaits PPI & GDP – Buy Dips, Sell Rallies🟡 XAU/USD – PPI & GDP Data to Define Range Expansion
🔍 Market Context
Gold remains range-bound between $4000–$4100, consolidating after last week’s liquidity sweep.
This week’s key U.S. data — Core PPI, Retail Sales, GDP, and Core PCE — will likely dictate the next major move.
Slight improvement in inflation and consumption data could strengthen the USD temporarily, but overall bias remains bullish mid-term as the Fed is expected to maintain a dovish stance into Q1.
📊 Technical Outlook (4H Chart)
Main Sell Zone (Super OB): 4170–4200 → potential reversal supply zone.
Fair Value Gap (FVG): 4130–4160 → short-term reaction zone if price retraces.
Sell Zone: 4090–4095 → short opportunity aligned with intraday bearish structure.
Buy Zone 1: 4024–4025 → minor demand, expecting internal liquidity sweep.
Buy Zone 2 (Main OB): 4003–4001 → strong order block with multiple rejections; key liquidity pool.
Structure: H4 BOS (Bullish) intact, suggesting a liquidity sweep before next expansion upward.
🎯 Trade Plan
1️⃣ SELL Setup – Short-term reaction from FVG
Entry: 4090–4095
Stop Loss: 4100
Take Profit 1: 4055
Take Profit 2: 4040
Take Profit 3: 4025
➡️ Reasoning: Price is likely to tap the lower edge of FVG and sweep local liquidity before a downside reaction toward internal range demand.
2️⃣ BUY Setup – First demand zone test
Entry: 4024–4025
Stop Loss: 4022
Take Profit 1: 4065
Take Profit 2: 4080
➡️ Reasoning: Expecting a short-term liquidity grab below the mid-range before bullish continuation.
3️⃣ BUY Setup – Main OB accumulation zone
Entry: 4003–4001
Stop Loss: 3998
Take Profit 1: 4045
Take Profit 2: 4075
Take Profit 3: 4090
➡️ Reasoning: Deep liquidity zone aligning with higher-timeframe OB. If macro data disappoints, this area can trigger the next impulsive leg to retest 4170+.
🧭 Overall Bias
→ Ranging bias before Core PCE
→ Buy dips – Sell rallies within 4000–4100 until a clear breakout post-GDP/PCE data.
→ Watch for false breakouts around FVG and maintain risk control before U.S. session releases.

A Short Gold Sell Opportunity You Can't MissLooking at the chart, gold continues to move steadily within a clear downtrend channel, with each peak and trough forming progressively lower levels over time. Currently, the price is approaching the upper boundary of the channel and interacting with the same resistance area where sellers have stepped in multiple times before, forcing the market to reverse. This behavior strongly indicates that the potential for a continued corrective move downward, in line with the main trend, remains intact.
With this in mind, I believe a price decline toward the 4,080 level is a reasonable and logical target for the current correction. As long as the price hasn’t clearly broken through the upper boundary of the channel, I will continue to favor the scenario where the bearish trend remains dominant, viewing any upward movement as a mere pullback within the overall structure.
This is not financial advice, but simply my personal perspective based on the current price action.

XAU/USD: Gold Bullish, Waiting for Perfect Buy Pullback📊 Market Structure
Gold is maintaining a strong bullish structure after a series of BoS from the bottom region. The most recent rally broke the 4,130 mark and continues to hold above the small OB area, indicating that the BUY side is still in control.
Currently, the price is slightly retracing to retest the structure — the target is to test the area:
• OB 4,130 – 4,126 USD
• Or deeper to FVG 4,104 – 4,089 USD
In both cases, these are discount areas to continue BUYING according to the main trend.
The larger trend still targets the upper liquidity levels including:
• 4,151
• 4,181
• 4,207
• 4,243
💎 Key Technical Zones
• OB Retest Zone: 4,130 – 4,126 (quick bounce area)
• FVG Zone: 4,104 – 4,089 (best discount area to BUY)
• Large Bearish OB: 4,045 – 4,060 (final area if price adjusts deeply)
• Target Zones: 4,151 – 4,181 – 4,207 – 4,243
🎯 Trading Plan – BUY (priority)
1️⃣ BUY 1 – Retest OB 4,130
• Entry: 4,126 – 4,131
• SL: below 4,115
• TP1: 4,151
• TP2: 4,181
• TP3: 4,207
• TP4: 4,243
→ This is a quick setup – for a short retracement before continuing.
2️⃣ BUY 2 – FVG 4,104 – 4,089 (best)
• Entry: 4,089 – 4,104
• SL: 4,070
• TP1: 4,151
• TP2: 4,181
• TP3: 4,207
• TP4: 4,243
→ This FVG area is a strong confluence: fibo, small demand, and trendline.
3️⃣ BUY 3 – OB Bearish shift (deep entry)
• Entry: 4,045 – 4,060
• SL: 4,020
• TP1: 4,104
• TP2: 4,151
• TP3: 4,207
→ Only activate when the market shakes strongly, but RR is extremely good.
🎯 SELL Scalp (secondary – only short trades)
Only SELL when the price reaches strong resistance areas and rejection signals appear:
• 4,151
• 4,181
• 4,207
• 4,243
Entry SELL: only enter when there is H1 rejection
SL: 10–15 USD
TP: back to 4,151 → 4,130
→ This is counter-trend, not a priority setup.
🧠 Vincent’s View
The overall trend is still bullish. The current retracements are just a “breathing phase” – the market is accumulating energy to continue pushing up to higher liquidity areas.
As long as the price stays above 4,089 – the bullish trend is not threatened.
“Smart Money buys the dip — Retail buys the breakout.” ⚜️
⏰ Timeframe: 1H
✍️ Analysis by: Captain Vincent

Gold Analysis and Trading Strategies | Monday✅ Technical Outlook (4-Hour Structure)
● After reaching the historical high of 4381, gold entered a corrective phase, forming a segmented structure of “decline → bottoming → rebound.”
Each segment has lasted for roughly one week.
Currently, after touching 4245, gold has entered the second corrective wave, and from a cycle perspective, this adjustment is not fully completed yet.
● Over the past two days, gold has repeatedly found support around the 4000 psychological level, showing signs of rebound. This indicates that buyers are actively defending this area and that short-term bullish interest remains.
● Short-term moving averages (MA5, MA10, MA20) are currently clustered around the 4080–4100 region, forming strong pressure and signaling that the short-term trend remains bearish.
However, the long-term moving averages are slowly turning upward, suggesting that downside support remains valid and that deeper declines may be limited.
● The Bollinger Bands continue to narrow, indicating a range-bound and repetitive price structure.
The lower band is gradually aligning with previous lows, which together limit the downside space for further price declines.
✅ Daily Chart Structure
● Gold remains in a consolidation phase, with the overall Bollinger Bands displaying a gradual narrowing pattern, suggesting that a one-directional move is unlikely in the near term.
● The lower band is steadily rising and aligning with prior lows → limiting further downside risk.
● The upper band remains near 4100–4130, serving as the main short-term resistance zone for rebounds.
🔴 Resistance Levels: 4100–4130
🟢 Support Levels: 4005–4000
🎯 Trading Strategy Reference
🔰 Strategy 1 (Sell on Rebound)
● Short around 4100–4105 in batches
Targets: 4050–4020
Breakdown target: 4000
🔰 Strategy 2 (Buy on Pullback)
● Buy around 4000–4005 in batches
Targets: 4020–4030
Breakout target: 4050
📌 Outlook for Next Week
Overall, gold remains in a structure of weak consolidation — supported but with limited rebound strength.
The price is expected to continue oscillating within the 4000–4100 USD range next week.
● If Federal Reserve officials sound more “hawkish”:
Rate-cut expectations decline → USD strengthens → Gold may retest the 4000 support.
● If Fed officials turn more “dovish”:
Rate-cut expectations rise → Gold may retest the 4100 resistance zone.
● If geopolitical tensions escalate:
Safe-haven demand may push gold to break above the upper boundary of the range.
Next Monday’s short-term focus remains the 4000–4100 range.
Wait for a breakout, then follow the direction accordingly.
LiamTrading – XAUUSD H1 | Gold forming Head–Shoulders Pattern...LiamTrading – XAUUSD H1 | Gold forming Head–Shoulders Pattern, waiting for pullback to POC for entry
Gold is completing the final bullish leg of the Head–Shoulders structure on the H1 timeframe.
Price has now reached the Fibonacci zone (both retracement + extension), which also aligns with a resistance cluster and the POC of the Volume Profile — so the current choppy reaction is completely normal.
My plan is to use this pullback:
→ prioritize short-term Buy entries following the current bullish leg,
→ then look for Sell setups at the strong resistance above.
Macro Background
Russia continues missile strikes on Kyiv right after the US–Ukraine reached a “19-point framework”, causing peace prospects to stall again.
However, secret negotiations among the US, Russia, and Ukraine in Abu Dhabi are still ongoing, though no major terms have been finalized.
With “war not stopping – negotiations not settled”, global risk sentiment remains tense.
This keeps medium–long-term demand for Gold strong.
But in the short term, price may still show wide swings around key technical zones before choosing a clearer direction.
H1 Technical Analysis – Head & Shoulders, Fibonacci, Volume Profile
The Head–Shoulders pattern is now clearly visible.
Price is currently in the right-shoulder completion phase, approaching upper resistance.
Gold at the moment is:
Hitting the Fibonacci retracement of the previous decline.
Also overlapping with the Fibonacci extension of the short-term bullish wave → high chance of reaction and volatility.
Below price, the 4090–4093 zone is a support/mini-POC area where Volume Profile thickens — ideal for a short-term Buy following the current bullish structure.
Above price, the 4185–4187 zone is a strong resistance cluster:
Confluence of potential right-shoulder top + old supply + Fibonacci extension.
This is the area I will prioritize for Sell setups once the pattern completes.
Notable Support/FVG zones:
4122–4116 (near support)
4169–4210 (mid-term FVG/resistance)
Reference Trading Scenarios
1. Buy with the current bullish wave (short-term)
Buy: 4091–4093
SL: 4085
TP: 4120 → 4145 → 4170 → 4190 → 4220
Logic:
Buy at the confluence support + small POC, taking advantage of the upward push completing the right shoulder.
Once the trade reaches +1R, shift SL to breakeven to protect capital.
2. Sell at the Head–Shoulders resistance zone (medium-term priority)
Sell: 4185–4187
SL: 4193
TP: 4170 → 4155 → 4130 → 4110
Logic:
This is a strong resistance zone overlapping the supply region and Fibonacci extension.
Only activate the Sell if H1/M15 shows clear rejection signals (pin bar, bearish engulfing, weak volume) around 4185–4187.
Additional Levels to Watch
Support – FVG: 4122–4116
Resistance – FVG: 4169–4210
Can be used for quick scalp opportunities, but the main scenarios remain:
Buy near 409x as long as major resistance hasn’t been touched.
Sell near 418x when the Head–Shoulders structure shows completion signs.

Gold comex bought at 4035 today booked at 4150 AI dat in descpt.Parameters Data
Asset Name Gold COMEX
Reason 🟩 Hypothetical price action mein DEMA support aur trend continuation dikh rahi hai.
R:R 🟩 1:1.14 (Risk reward T2 target ke liye theek hai.) / Threshold: Breakout above - & Breakdown below
Current Trade 🟩 BUY Active | T1: 4160.00, T2: 4180.00, T3: 4200.00 | SL: 4120.00
Probability 🟩 80%
Confidence 🟩 18/30 (Hypothetical technical structure strong hai.)
Price Movement Buy side: 4160.00, 4180.00, 4200.00. If break 4140.00 then downside possible towards 4120.00, 4100.00, 4080.00.
FNO Data (OI/PCR) 🟩 Hypothetical PCR Bullish hai.
Liquidity Zones 🟩 High Liquidity zone $4,140 - $4,160 ke beech.
Max Pain 🟨 $4,150 (Spot ke kareeb, consolidation dikhata hai.)
Gamma Exposure 🟩 Gamma positive territory mein.
Supports 🟩 S1: 4140.00 | S2: 4120.00 (20 DEMA) | S3: 4100.00
Resistances 🟥 R1: 4160.00 (Minor Resistance) | R2: 4180.00 | R3: 4200.00
DEMA Levels 🟩 20 DEMA: 4120.00 | 50 DEMA: 4100.00 | 100 DEMA: 4080.00
ADX/RSI/DMI 🟩 RSI (14) 65 (Bullish Zone). Strong momentum.
Market Depth 🟩 Buying pressure high hai.
Cross‑Asset Correlation 🟩 Hypothetically, Dollar/Yields weak honge.
COT Positioning 🟩 Managed money net long positions hold kar rahe hain.
Source Ledger 🟩 CME, Kitco, OANDA, TradingView (Based on hypothetical trend).

HOW FAR WILL GOLD RISE?
1. MARKET CONTEXT
Yesterday, during the Asian and European sessions, gold prices mainly moved sideways – accumulating within a narrow range.
In the U.S. session, gold prices broke strongly through the 413X region and formed:
Inverse Head and Shoulders pattern (iH&S)
The upward structure returns → buyers dominate
This indicates that the upward momentum has returned, and the market leans towards continuing to rise if it does not break the important support area.
Fundamental factors supporting buyers
The market is expecting the Fed to cut interest rates in December.
Tonight there is PPI news — an important indicator directly affecting inflation expectations and Fed expectations.
→ This could be a catalyst for strong volatility in the U.S. session.
2. MAIN TRADING DIRECTION FOR THE DAY
➡️ Prioritize BUY (look to buy) according to the main trend.
➡️ SELL is only reactive – for retracement, not the main trend.
3. POTENTIAL BUY ZONES
Beautiful support areas to look for buying opportunities today:
📍 BUY zone 1 – Nearest
413X (early day resistance and yesterday's breakout area)
→ Beautiful entry area for scalping or buy follow trend.
📍 BUY zone 2
4100 – 4103
→ Psychological support & structural confluence area.
📍 BUY zone 3
4088 – 4090
📍 BUY zone 4
4060 – 4065
→ Strong support area, look to catch the bottom in case of deep price correction.
4. REACTIVE SELL ZONES (ONLY SELL FOR RETRACEMENT)
Only sell when price hits the area — clear rejection signals appear:
📍 SELL zone 1 (nearest)
4180 – 4186
📍 SELL zone 2
4190 – 4195
📍 SELL zone 3
4202 – 4205
Safe SELL conditions:
Only sell counter-trend, prioritize scalping.
If these areas are strongly broken + H1/H4 candle closes, consider buyers winning, then do not sell anymore.
5. CAPITAL MANAGEMENT – RISK MANAGEMENT
SL = 10 points
TP = 10 points
RR ratio = 1:1.2
Do not hold positions through PPI news if not really sure about the pattern.
6. NOTES ON METHOD
Buy orders will dominate the day.
Sell only when there is a strong reaction at resistance.
Scalping: open orders on smaller timeframes (M1–M5–M15) to optimize Entry.
Always wait for price action confirmation (pinbar, engulfing, retest…) before entering orders.
7. SUMMARY
Today's tendency is mainly BUY, based on:
The return of the upward trend
Inverse Head and Shoulders pattern
Expectations of a dovish Fed
PPI news triggering volatility
Wishing everyone an effective trading day — total victory! 🔥💹

Gld Trading Strategy for 25th November 2025🟡 $XAU/USD – GOLD TRADING PLAN (Intraday Strategy)$
📈 GETTEX:BUY SETUP (Bullish Scenario)$
👉 Condition to Enter Buy:
Wait for a 30-minute candle to close ABOVE the high of $4170$.
Only if price breaks and closes above 4170 with strength, the bullish momentum becomes valid.
🎯 Buy Targets:
$4182$ – First target, short scalp level.
$4193$ – Second target, medium strength resistance zone.
$4204$ – Final target, strong liquidity area where sellers may appear.
🛡️ Why this Buy Setup Works:
4170 acts as a mini-breakout zone.
30-minute candle confirmation reduces false breakouts.
Each target aligns with short-term resistance levels usually used by intraday traders.
🟢 Trade Management for Buy Side:
After entry, shift SL to breakeven once price crosses $4182$.
Partial booking recommended at each target.
Use a dynamic trailing stop if momentum becomes strong.
📉 $SELL SETUP (Bearish Scenario)$
👉 Condition to Enter Sell:
Wait for a 1-hour candle to close BELOW the low of $4106$.
A 1-hour confirmation indicates strong institutional selling pressure.
🎯 Sell Targets:
$4090$ – Immediate support, first profit zone.
$4078$ – Extended downside target.
$4063$ – Deep target zone, where buyers may step in.
🛡️ Why this Sell Setup Works:
4106 acts as a critical breakdown level.
1-hour confirmation provides high-probability downward continuation.
Targets align with earlier demand zones.
🔻 Trade Management for Sell Side:
Move SL to breakeven below $4090$.
Book profits partially for risk reduction.
Watch for reversal signs at $4063$.
⚠️ $Important Disclaimer$
📌 This is NOT financial advice.
📌 These are educational trading levels based on price-action structure.
📌 Trading gold involves high risk. Always use stop loss, manage position size, and evaluate market volatility.
📌 You are responsible for your own trades.

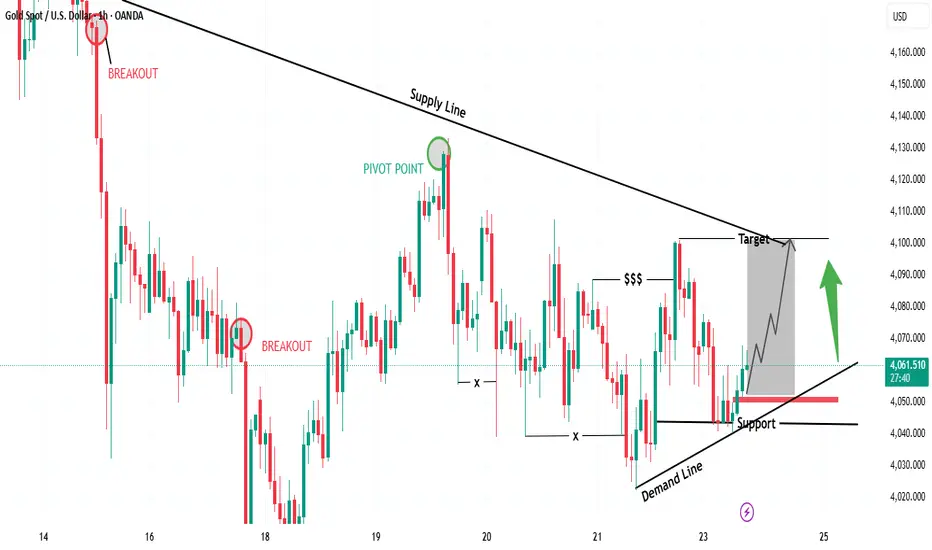
“Gold Rebounding from Demand – Targeting Supply Line Retest🔍 Key Observations
📉 Supply Line (Downtrend Resistance)
Each rally is being capped by the descending supply line
📈 Demand Line (Ascending Support)
Buyers defending higher lows
Strong bullish reaction off support
💰 Liquidity Grab ($$$)
Liquidity was taken below swing lows — bullish signal
Smart money likely securing positions before pushing up
🟢 Bullish Confirmation
If price holds above demand line + support zone
Expect bullish continuation toward supply line retest
🎯 Suitable Target Levels
Target Level (Approx) Status
🥇 First Target 4,095 – 4,105 At supply line retest
🥈 Extended Target 4,120 – 4,130 Breakout continuation
📌 Trade Idea (Bullish Scenario)
Entry Zone: 4,055 – 4,065 🟩
Stop Loss: Below 4,025 ❌
Take Profit 1: 4,100 🎯
Take Profit 2: 4,125 🚀
RR Ratio: 1:2.5 – 1:3 📈
🧭 Market Sentiment
📍 Bias → Short-term Bullish
🛑 But… sellers may reappear at supply line
⚠️ Watch for fakeouts near the target
Elliott Wave Analysis XAUUSD – 21/11/2025
1. Momentum
D1:
The D1 momentum is contracting, signaling a potential reversal. If today’s candle confirms this, it will further support the continuation of wave Y.
H4:
H4 momentum has turned downward, so the expectation for today remains bearish movement.
H1:
H1 momentum is preparing to turn upward, suggesting a small corrective bounce. However, in the current context, price is likely to remain sideways within the 4046 – 4081 range.
________________________________________
2. Wave Structure
D1 – Higher timeframe
With D1 momentum preparing to turn down, the continuation of wave Y is reinforced.
But since momentum is near the oversold zone, two potential scenarios may unfold:
1️⃣ Strong decline:
A sharp drop may break 3888, opening the way toward deeper targets such as 3746.
2️⃣ Weak decline – Compression:
Price may continue down but fail to break 3888.
Once momentum turns upward again, a new trend could form.
________________________________________
H4 – Pattern outlook
The H4 structure remains unclear—price may still be in wave (3) or wave (2).
• If it is wave (3), strong bearish candles or a test of 4001 should appear.
• If price keeps moving sideways without breaking 4001 until H4 momentum reaches oversold, the current move is likely wave B of an ABC correction inside wave 2.
Based on the current depth of wave B, wave C is estimated to target 4175.
________________________________________
H1 – Lower timeframe
Wave 2 (green) is taking longer than ideal, but not enough to invalidate the current labeling.
The 4081 resistance is very strong and serves as our sell zone.
Below, the 4020 support is equally important:
• A sharp decline with H1 closing below 4020 may trigger a larger bearish continuation.
• Typically, price reacts with a bounce when it first touches this area.
________________________________________
3. Trade Plan
Sell Zone: 4073 – 4075
SL: 4093
TP1: 4020
TP2: 3958
TP3: 3885

Part 1 Introduction to Candlestick PatternsThe Greeks: Heart of Option Trading
The Greeks measure how options change with market conditions.
1. Delta
Measures how much the premium moves compared to the underlying.
Call delta = +ve
Put delta = –ve
2. Theta
Measures time decay.
Always negative for buyers
Positive for sellers
3. Vega
Measures sensitivity to volatility.
High volatility = expensive options.
4. Gamma
Shows how Delta changes.
High Gamma = fast premium movement.

Gold (XAU/USD) 2H Chart Analysis – Sell Setup from High ProbabilBased on the chart you provided, Gold is currently reacting near a High Probability POI (supply zone) after a corrective bullish move. The structure still shows:
Lower highs and lower lows → Bearish market structure
Price is approaching a supply zone where sellers previously dominated
Liquidity has been taken above internal highs (marked as "$$$"), indicating a liquidity grab
This supports a short position idea from the supply zone.
🔍 Key Technical Levels
Zone / Level Meaning
4,125 – 4,150 USD High Probability POI / Supply (Sell area)
4,080 – 4,100 USD Entry region (price is currently here)
4,040 – 4,025 USD First reaction / partial take zone (50% area)
3,990 – 4,000 USD Main Target (previous demand + equal lows)
🎯 Suggested Target
Primary Target: $4,000
(Exactly aligning with your chart’s marked “TARGET” zone where liquidity sits)
If momentum continues and structure breaks more aggressively:
Extended Target: $3,975 – $3,960
(deeper sweep into demand)
🛑 Risk Management
Detail Level
Stop Loss Above 4,155 USD (beyond POI + liquidity)
R:R Potential Approx. 1:3 to 1:4
📌 Summary
Price has retraced into a key supply zone
Liquidity was taken → seller confirmation likely
Expectation is continuation downward towards the liquidity pool below
📊 Title Recommendation:
“Gold Retests Supply Zone – Bearish Continuation Toward $4,000 Expected”

Gold Trading Strategy for 24th November 2025✨ GOLD Trading Plan – Breakout Strategy (30-Min Candle)
🟢 BUY Setup (Long Trade)
Trigger: Enter only if the price closes above the high of the 30-minute candle at 4086.
Entry: Buy above 4086 after a confirmed candle close.
Targets:
🎯 Target 1: 4100
🎯 Target 2: 4115
🎯 Target 3: 4128
Stop-Loss Suggestion: Below the breakout candle low or below 4058–4062 zone (adjust per risk tolerance).
Logic:
A close above 4086 signals bullish strength and a possible continuation toward intraday resistance levels. Momentum confirmation is essential before entering.
🔴 SELL Setup (Short Trade)
Trigger: Enter only if the price closes below the low of the 30-minute candle at 4042.
Entry: Sell below 4042 after a confirmed candle close.
Targets:
🎯 Target 1: 4034
🎯 Target 2: 4024
🎯 Target 3: 4010
Stop-Loss Suggestion: Above the breakdown candle high or above 4060–4065 zone.
Logic:
A close below 4042 shows bearish momentum that can push price toward the next support zones.
📌 Extra Notes for Better Execution
⏳ Wait for a confirmed 30-minute candle close before entering — avoid wick traps.
📉 Place stop-loss strictly; gold is highly volatile.
⚙️ Risk–reward should be at least 1:2 or better.
📊 Monitor global cues: USD strength, yields, economic data, and geopolitical news.
⚠️ Disclaimer
This analysis is for educational and informational purposes only. It is not investment or trading advice. Financial markets involve risk, and you should conduct your own research or consult a certified financial advisor before making any trading decisions. You are fully responsible for your trades.
