XAU/USD – Liquidity Cleared, Gold Reloads for the Next Breakout🔍 Market Context
This morning, gold price (XAU/USD) experienced a classic liquidity sweep :
The price surpassed the previous high of 4058 , touched 4060 , wicked strongly , and short-term corrected – a textbook “liquidity hunt” by major funds.
After this drop, the price recovered back to the old ATH zone (4055 – 4060) .
This indicates that short-term sellers have weakened , and buyers are reclaiming the crucial structure zone .
Therefore, selling strategy is no longer optimal , instead, the market is preparing for a re-accumulation – next breakout.
💎 Technical Analysis
Current ATH: 4060 USD
Previous High: 4058 USD
This morning's liquidity sweep “cleared out” liquidity above, paving the way for a re-accumulation phase before the next rise.
The zone 4048 – 4052 is acting as a retest zone – if it holds, this could be the “launchpad” for a breakout to higher price zones.
Overall Structure: still bullish , no signs of medium-term reversal.
⚙️ Key Price Zones
Retest Zone: 4048 – 4052 → support zone after the sweep, where the price might bounce back.
Breakout Zone: 4065 – 4070 → zone confirming buyers regain dominance.
Extended Target: 4090 – 4100 USD.
Invalidation Zone: below 4040 USD → if breached, the short-term bullish structure will weaken.
📈 Trading Scenarios
1️⃣ Buy Continuation Scenario – Buy with the main trend
Wait for the price to retest the 4048 – 4052 zone , observe bullish candle reactions or confirmation signals (Engulfing, Rejection).
Open a buy order upon confirmation of holding the support zone.
Target: 4065 → 4090 USD.
Stop Loss: below 4040 USD.
➡️ This is a trend-following scenario, with the highest probability when the market has completed the liquidity sweep and is re-accumulating.
2️⃣ Buy Breakout Scenario – Buy on confirmed breakout
If the price breaks and closes above 4065 , it signals that major funds have returned.
Open buy stop or limit retest breakout around 4065 – 4070.
Extended Target: 4090 → 4100 USD.
Stop Loss: below 4050 USD.
➡️ This scenario suits momentum traders, avoiding the risk of “fake breakout” by waiting for clear confirmation.
⚠️ Risk Management
Do not sell against the trend at the ATH zone, as liquidity above has been taken.
Maintain reasonable volume when trading around the peak zone.
Prioritize buying when there is confirmation of the bullish structure holding the 4050 zone .
💬 Conclusion
This morning's liquidity sweep has shaken out weak hands , while helping gold pave the way for the next rise .
Currently, the price is re-accumulating around the old peak zone 4055 – 4060 , and if the zone 4048 – 4052 continues to hold, there is a high possibility that gold will break out to the 4090 – 4100 USD zone in the upcoming sessions.
👉 Reasonable Strategy:
Wait to buy at the support zone or buy when the price breaks above 4065.
Avoid selling against the trend now – the risk is very high as major funds have shifted to the accumulation phase.
Trade ideas

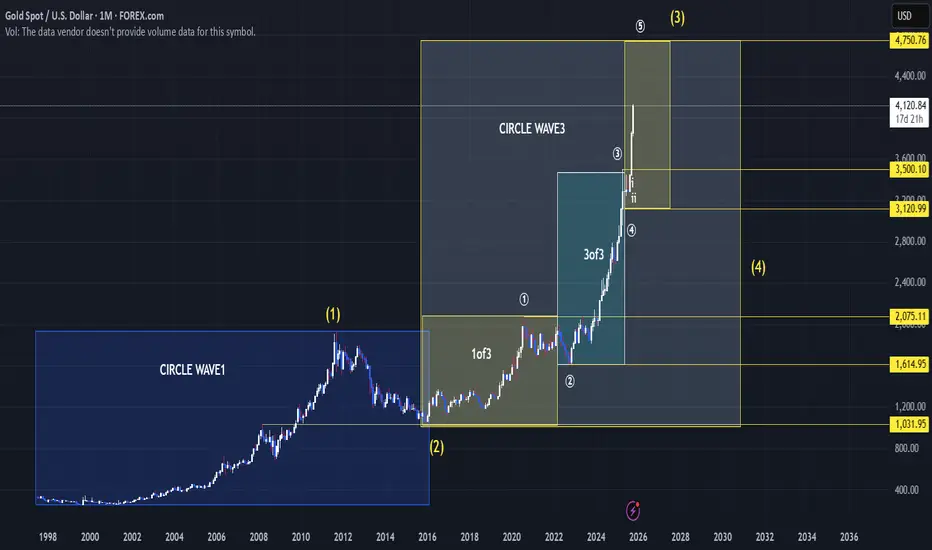
Elliot wave Gold price predictionIn my opinion that gold can hit 4700+ in next few months, as you can see my chart that circle wave 3 is going on and we are in 3 of 3rd wave right now so may be possible price will take pull back after hit 4230 or nearest it and wave 4of 3 will unfold after correction price will take bounce back near 3750 to 3700 then price will complete 5 of 3 and circle wave 3 should complete. its my idea not trading advise.
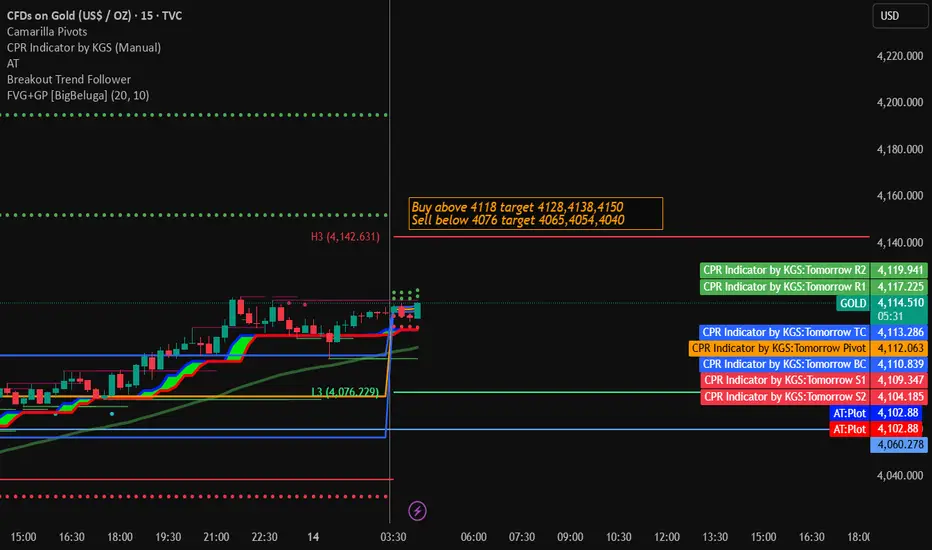
Gold Intra day Trading Strategy for 14th October 2025💰 GOLD INTRADAY STRATEGY – 5 MIN CHART SETUP 💰
(For Educational Purposes Only)
📈 BUY Setup
🔹 Entry: Buy above the high of the 5-minute candle that closes above $4118
🎯 Targets:
1st Target → $4128
2nd Target → $4138
3rd Target → $4150
🛑 Stop-Loss: 3 candles below your entry candle’s low
📉 SELL Setup
🔹 Entry: Sell below the low of the 5-minute candle that closes below $4076
🎯 Targets:
1st Target → $4065
2nd Target → $4054
3rd Target → $4040
🛑 Stop-Loss: 3 candles above your entry candle’s high
⚙️ Trading Tips:
⏱ Trade only after candle close confirmation on the 5-min chart.
💡 Always manage your risk and use a fixed position size.
📊 Wait for volume confirmation and trend direction before entry.
❌ Avoid trading during high-volatility news events.
⚠️ DISCLAIMER:
This setup is for educational and research purposes only.
Trading in Gold or any financial market involves significant risk.
You may lose your capital.
Please do your own analysis or consult a financial advisor before taking any trade.
Gold trading strategy | October 13-14✅ From the 1-hour chart, gold has pulled back from the 4117 high and is currently trading between MA5 and MA10, showing a slowdown in short-term momentum.
The moving average system shows MA5 starting to turn downward, while MA10 and MA20 remain upward, indicating short-term correction pressure but strong medium-term support.
The Bollinger upper band near 4117 is acting as resistance, while the middle band around 4077 serves as the key short-term support. If the price stabilizes above this level, a short-term rebound is likely.
🔴 Resistance Levels: 4115–4120
🟢 Support Levels: 4070–4060
✅ Trading Strategy Reference:
🔰 If gold pulls back to the 4060–4070 zone and holds steady, consider building long positions in batches, targeting 4105–4120.
🔰 If gold faces repeated resistance around 4120–4130 and momentum weakens, consider light short positions, targeting 4085–4070, with a stop loss above 4135.
🔥Trading Reminder: Trading strategies are time-sensitive, and market conditions can change rapidly. Please adjust your trading plan based on real-time market conditions.

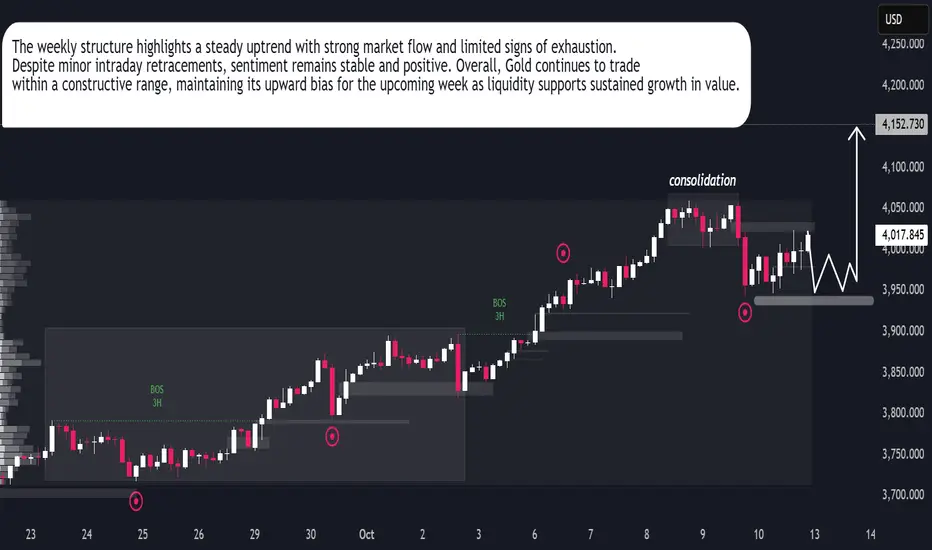
XAUUSD | Bulls Maintain Weekly ControlGold continues to display firm momentum as investor confidence remains stable despite short-term fluctuations. The latest weekly candle structure shows price holding within a steady consolidation range, signaling accumulation rather than weakness. Market behavior suggests large participants are preparing for another expansion phase after absorbing liquidity in the lower zones.
Institutional interest remains evident, with consistent buying pressure observed on dips, indicating sustained optimism for further growth. The current behavior aligns with broader market sentiment favoring safe-haven assets amid global uncertainty. Overall, Gold retains its dominance as capital flows stay supportive of the uptrend, positioning the metal for renewed strength in the upcoming sessions.
gold📊 Gold Daily — Bullish Momentum in Focus
Gold has been climbing steadily since mid-2024, forming a clean ascending channel.
The recent surge since September came with rising volume — a strong signal of increased buying interest and momentum.
Between June and August, we saw healthy consolidation with lower volume, suggesting accumulation before the breakout.
Now, all eyes are on the upper channel resistance.
If price breaks above it with strong volume, the rally could extend toward $4,200 and beyond — targeting measured moves or extrapolated resistance zones.
But if price gets rejected at the top, a correction may follow.
Key support levels to watch:
🔸 $3,800 (mid-channel)
🔸 $3,400 (lower boundary)
This setup offers a clear roadmap for both breakout traders and risk-aware swing strategies.
#Gold #TechnicalAnalysis #PriceAction #TradingSetup #VolumeAnalysis #MarketStructure #Commodities #LearningInPublic

Gold 1H – Potential Liquidity Sweep Before Fed SpeechesXAUUSD – Intraday Trading Plan | by Ryan_TitanTrader
📈 Market Context
Gold remains steady near ₹4,065, as traders eye upcoming U.S. PPI data and Fed officials’ speeches later today for new guidance on the inflation outlook.
The recent rise in Treasury yields has slightly capped gold’s upside momentum, but underlying safe-haven demand persists amid ongoing geopolitical and economic uncertainty.
If the PPI print shows softer inflation, gold could attract renewed buying; however, a hotter reading may spark another liquidity sweep lower before any sustained rally.
🔎 Technical Analysis (1H / SMC Style)
• ChoCH confirmed at 4060+, showing potential exhaustion in the current short-term uptrend.
• Price tapped the premium zone (4080–4078), aligning with previous liquidity and imbalance — ideal for a short-term sell setup.
• A BOS formed at 4017, opening the way for retracement toward the discount zone (3999–3997).
• The 3997–3999 area is a strong demand zone, overlapping with a prior ChoCH and liquidity void — a potential reversal area for bulls.
• Expect a liquidity grab at 3990 before a bullish reaction if structure holds.
🔴 Sell Setup: 4080–4078
SL: 4087
TP targets: 4040 → 4015 → 4000
🟢 Buy Setup: 3999–3997
SL: 3990
TP targets: 4035 → 4060 → 4100+
⚠️ Risk Management Tips
• Wait for M15 ChoCH / BOS confirmation before triggering entries.
• Avoid over-leverage during Fed speech hours — price may fake out around liquidity levels.
• If price sweeps 4080 liquidity and rejects impulsively, partial short entries are favored.
• Conversely, if 3997 holds firm with strong bullish structure, watch for re-entry confirmation to ride the next expansion.
✅ Summary
Gold is currently playing within a premium-to-discount framework, as smart money may engineer a sweep of 4080 liquidity before driving price down toward 3997–3999 to collect buy-side orders.
After that, a strong bullish reaction is expected from the demand zone if macro conditions (like soft PPI or dovish Fed tone) support it.
Stay patient — structure confirmation is key before entering either direction.

Gold 95 points profit booked , bought at 3995 booked at 4090Gold booked 95 points profit.
Buy on dip will be continued
How My Harmonic pattern projection Indicator work is explained below :
Recent High or Low :
D-0% is our recent low or high
Profit booking zone ( Early / Risky entry) : D 13.2% -D 16.1 % is
range if break them profit booking start on uptrend or downtrend but only profit booking, trend not changed
SL reversal zone (Safe entry ) : SL 23.1% and SL 25.5% is reversal zone if break then trend reverse and we can take reverse trade
Target : T1, T2, T3, T4 and .
Are our Target zone
Any Upside or downside level will activate only if break 1st level then 2nd will be active if break 2nd then 3rd will be active.
Total we have 7 important level which are support and resistance area
Until , 16% not break uptrend will continue if break then profit booking will start.
If break 25% then fresh downtrend will start then T1, T2,T3 will activate
1,3,5,10,15,20 minutes are short term levels.
30 minutes 60 minutes , 2 hours,3 hours, ... 1 day and 1 week chart positional and long term levels

Gold breaking new highs has become the norm, 4100 is within reacGold continues its bullish trend, breaking new highs as expected. Breaking new highs has become the norm for gold recently. So far, gold has reached a high of 4080 and is fluctuating around it. It is likely to reach 4100 tonight, and the current level of 4100 is within reach. Breaking new highs from above has become commonplace. Don't expect bears to hold out. After all, bulls are the main force. Looking at the hourly chart, various indicators are driving the bulls, and international news is also positive for gold prices. Therefore, we must maintain a bullish outlook for gold. Mr. Tian will also prioritize long positions. Keep an eye on the support at 4000. Trading strategies should focus on buying on dips.
Based on the 4-hour market trend, short-term support is currently at 4095-4100, with a focus on key support at 4075-4085. The bulls are rallying strongly and there is no end in sight. Trading strategies should prioritize buying on dips. In the intermediate range, be cautious and follow orders carefully, patiently waiting for key entry points. I will provide detailed trading strategies during the trading session, so stay tuned.
Gold Trading Strategy:
1. Buy gold at 4070-4080. Add to long positions if it dips back to 4060-65. Stop loss at 4060. Target at 4130-4150. Hold if it breaks through.

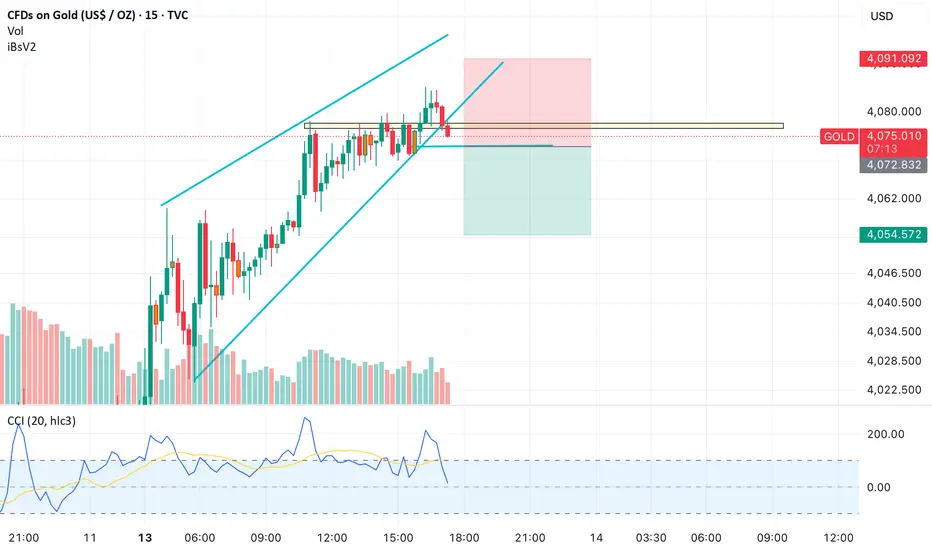
Gabling in Gold?
Technical View:
Gold has been moving within a rising channel, but the recent rejection from the upper boundary near $4,078 indicates potential exhaustion. The price has now broken below the immediate channel support, signaling the start of a corrective phase.
The CCI indicator has rolled over from the overbought zone, confirming loss of upward momentum. Volume analysis suggests weakening buying interest on each successive rally.
This structure favors a short-term pullback if $4,072 breaks decisively.
Macro View:
Broader macro sentiment remains mildly negative for gold in the near term:
• US Dollar Index (DXY) has regained strength, supported by higher US Treasury yields ahead of key inflation and retail sales data this week.
• Market expectations of an extended Fed pause are giving way to speculation of a “higher-for-longer” stance, keeping real yields positive — a headwind for non-yielding assets like gold.
• ETF inflows remain tepid, suggesting institutional money is cautious at current high levels.
• Additionally, oil price stability and easing geopolitical risk premium have reduced safe-haven demand for gold.
Together, these factors point to limited near-term upside for bullion.
Trade Setup:
• Action: Initiate short positions below $4,072 only on breakdown confirmation.
• Stop Loss: $4,091 (closing basis)
• Target 1: $4,055
• Target 2: $4,030
• Extended Target: $4,000
Execution Note:
The trade will be executed strictly as per the chart levels. It is possible that the entry level may not trigger today, in which case the setup becomes invalid and should be re-evaluated. No trade should be taken without price confirmation below $4,072.
Note:
Gold remains technically stretched, and the pattern breakdown aligns with a consolidative phase in global commodities. Short-term sentiment is tilting bearish unless the metal sustains above $4,091 on volume-backed strength.
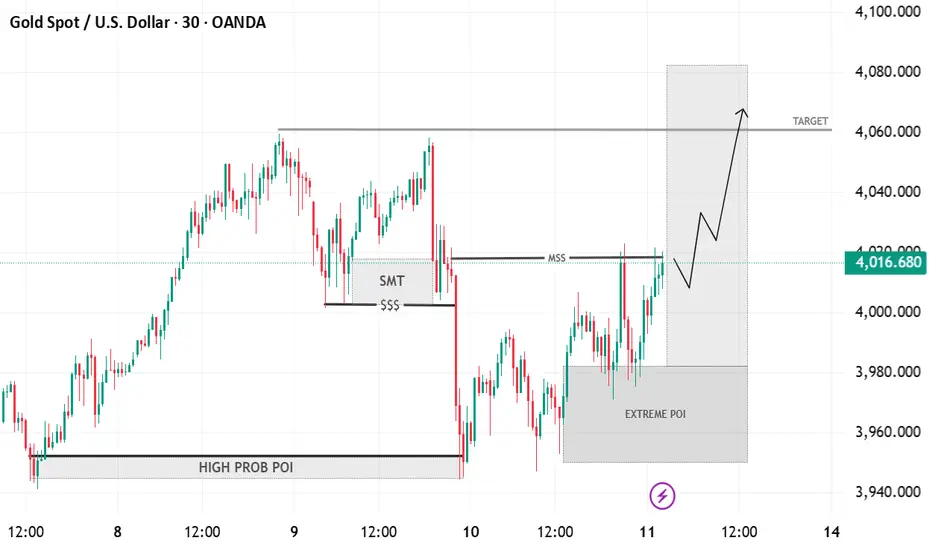
Gold–Bullish Reversal Setup from Extreme POI Toward 4060 TargetTimeframe: 30-minute chart (XAU/USD – Gold Spot vs U.S. Dollar)
Market Structure:
Price made a structural low (SMT) around the $$$ liquidity zone.
A Market Structure Shift (MSS) occurred as price broke above short-term highs.
POI (Point of Interest) Zones:
High Probability POI: Previous accumulation zone that caused a bullish impulse.
Extreme POI: Current demand zone (around 3960–3980), where price is rebounding.
Current Price Action:
Price has reacted bullishly from the Extreme POI.
The breakout above MSS signals possible continuation to the upside.
Target Zone:
The shaded grey target area (~4060–4080) aligns with previous liquidity highs.
Bias:
Bullish short-term bias toward 4060–4080 zone, assuming the demand zone holds.
Break below Extreme POI would invalidate the setup and suggest deeper retracement.
WAVE 5Spotting strong bullish momentum — price holding above key support with rising volume and RSI confirmation. Looking for continuation toward next resistance zone.

XAU/USD: GOLD HITS NEW ATH! Buy or Sell Now?Gold (XAU/USD) is absolutely on fire, hitting a Fresh All-Time High (ATH) this morning! This massive breakout isn't random; it's a direct outcome of global risk factors lining up, making gold the ultimate safe haven:
🇺🇸🇨🇳 Trade War Reloaded: Trump's shocking 100% tariff threat on China exports has brought back major global uncertainty. Though he's softened his tone, the damage to sentiment is done, pushing money into gold.
⚠️ Geopolitical Heat: Warnings about sending Tomahawk missiles to Ukraine keep geopolitical tensions brewing, acting as a continuous tailwind for the metal.
🏛️ US Shutdown Drama: The ongoing US government funding deadlock is a big worry, further driving flight-to-safety flows.
✂️ Fed Rate Cut Confidence: High probability of Fed rate cuts in Oct/Dec (96%/87%) provides strong support, reducing the opportunity cost of holding non-yielding gold.
🔍 TECHNICAL ANALYSIS: Structure is Full-On BULLISH!
The price action today is textbook, showing exactly how Smart Money operates:
Liquidity Sweep & FVG: Price first wicked sharply below 4000 for a classic Liquidity Sweep—hunting weak hands' Stop-Losses—and created a temporary Fair Value Gap (FVG), before reversing with massive momentum.
Structural Break (BOS & MSS): This aggressive move resulted in a clean Break of Structure (BOS) above the old ATH at 405x, confirming a major Market Structure Shift (MSS). The trend is now unequivocally BULLISH.
Trading Plan - The Right Way:
Priority: Stick with BUY positions! The bias remains bullish as long as price holds above the Order Block (OB) support at 405x. This is the key level.
Big Warning: Don't try to short the top (sell dò đỉnh)! The risk of getting caught in a liquidity grab or price trap at these highs is extremely high. Stay away from counter-trend moves.
Sell Scenario (Only if): We only consider a short-term SELL if there's a strong, confirmed candle close below 405x. In that case, we might target a minor pullback to 4000 for profit booking, but the main goal remains to BUY on dips.
👉 Bottom Line: Fundamentals and technicals are singing the same tune. 405x is the line in the sand. Trade carefully, manage your stop-loss, and always do your own research (DYOR).
#GOLD #XAUUSD #ATH #MarketUpdate #TradeWar #FED #SmartMoney #ICT #TechnicalAnalysis #SafeHaven #DYOR

Part 1 Intraday Master ClassIntroduction to Option Trading
Option trading is one of the most dynamic, flexible, and powerful financial instruments in the modern market. It allows investors not only to profit from price movements but also to protect their portfolios, speculate, or earn regular income. Unlike buying stocks directly, options give traders the right but not the obligation to buy or sell an underlying asset (like a stock, index, or commodity) at a predetermined price within a certain time frame.

XAUUSD HIT MY STOP LOSSGold just broke above our previous OB/Liquidity resistance around 4040–4055, taking out the short-side liquidity and confirming a bullish market structure shift (MSB) on 15M and 1H timeframes.
🔹 Previous plan: Sell-limit at resistance — invalidated as price made a new high.
🔹 Current bias: Bullish continuation towards 4078 → 4095 → 4120.
🔹 Pullback zones to watch:
• 4035–4045 (OB retest / liquidity grab area)
• 4005–4020 (golden pocket confluence)
🧠 Trading Plan:
Wait for price to retrace into key support zones.
Look for bullish rejection / confirmation before entering long.
First TP near 4078, extended targets 4095+
SL below 4020 zone (structure invalidation).
💬 Price action respected structure beautifully. Remember — the market doesn’t care about our limits, only about liquidity.
Trade what’s visible, not what’s emotional.
#XAUUSD #GoldForecast #ForexTrader #SmartMoneyConcepts #LuxAlgo #OrderBlockTrading #LiquiditySweep #PriceAction #GoldAnalysis #TradingStrategy #TechnicalAnalysis #ForexSetup #DayTrading #ChartAnalysis #TradingView #alphatechfinances

Sniping the Next BUY Zone for Maximum Gains.The sentiment is clear: Bulls are running the show, preparing for potentially an eighth consecutive weekly gain. Our strategy is simple—wait for the intelligent retest to join the momentum.
🎯 THE TARGET ZONES (M30/H1)
We're focusing on the two most crucial zones derived from Fibo React Logic:
1. PRIME BUY ENTRY (The Sweet Spot):
Zone: 4018 - 4014 (Our key Fibo Retest Zone).
Action: Wait for Gold to pull back to this area. Execute a BUY (Long) only upon confirmed M30/H1 candle rejection (e.g., Bullish Engulfing/Pin Bar).
2. TAKE PROFIT TARGET (The Next Peak):
Zone: 4094 - 4098 (Fibo Extension/SELL React Zone).
Action: This is the primary TP for our Long entries, representing the next major target for the buyers.
📈 TRADING SCENARIO
Strategy: Patience is key. Let the market retrace to 4018 - 4014. Once confirmation hits, ride the wave up to 4094 - 4098.
🚨 Risk Alert:
Be disciplined with your Stop Loss. Maintain strict risk management, especially if the price fails to hold the 4018 - 4014 zone.
Let's trade with precision today!
