Gold 1H – Will 4242 Displace or 4170 Unlock the Next Leg?🟡 XAUUSD – Intraday Smart Money Plan | by Ryan_TitanTrader (04/12)
📈 Market Context
Gold squeezes into engineered liquidity as Donald Trump signals policy authorization for ultra-compact car production in the U.S., adding risk-on volatility to USD narratives. Markets may front-run sentiment shifts into commodities like gold. Expect fast bilateral sweeps before institutions reveal intent.
On H1, structure toggles between premium supply at 4242–4244 and discount demand at 4170–4168. The next directional leg requires MSS + BOS + displacement confluence.
🔎 Technical Framework – Smart Money Structure (1H)
Current Phase = liquidity-rich compression at H1 extremes
Liquidity Zones & Key Triggers
• 🔴 SELL GOLD 4242 – 4244 | SL 4252
• 🟢 BUY GOLD 4170 – 4168 | SL 4160
Bias invalidation only via structure break + displacement validation.
Expected Sequence = Sweep → MSS/CHoCH → BOS → Displacement → Retest → Expansion
🎯 Execution Rules (unchanged methodology, matching your zones)
🔴 SELL GOLD 4242 – 4244 | SL 4252
Rules:
✔ Zone tap 4243 → bearish MSS/CHoCH (M5–M15)
✔ Clean bearish BOS down + candle displacement
✔ Entry on FVG fill or OB retest after displacement
Targets:
1. 4200 – 4190
2. 4182 – 4176
3. 4170 – 4168
🟢 BUY GOLD 4170 – 4168 | SL 4160
Rules:
✔ Sweep under 4169 → bullish MSS/CHoCH + BOS up
✔ Displacement candle away from discount
✔ Wick rejection into FVG fill / OB retest confirm
Targets:
1. 4186
2. 4210
3. 4242+
⚠️ Risk Notes
• Both sweeps = traps until BOS + Displacement confirms intent
• No averaging inside compression
• SL = structural invalidation only
• Reduce size during headline-driven spikes
📍 Summary
Two institutional paths today:
• 4243 sweep → bearish MSS/BOS → retest → delivery into 4170
or
• 4169 sweep → bullish MSS/BOS → retest → expansion into 4242+
Trade the structure. Let price narrate the intent. Patience = edge. 🚀
📌 Follow @Ryan_TitanTrader for daily Smart Money breakdowns.
Trade ideas


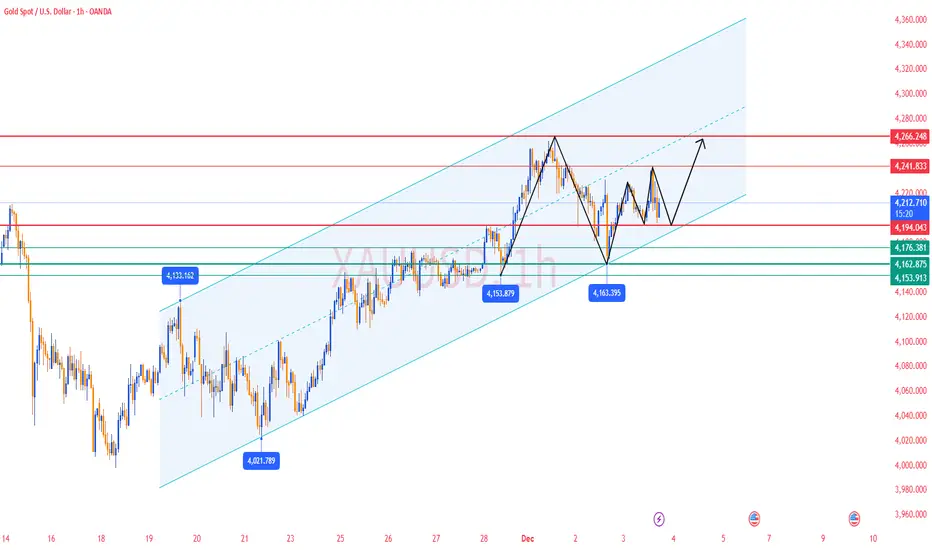
XAUUSD – H1 in a Downward Channel | Prefer Selling at Channel...XAUUSD – H1 in a Downward Channel | Prefer Selling at Channel Top & Buying at Trendline + Fibonacci
Market Structure (H1)
Gold is currently sliding inside a well-defined downward channel after forming a top around the 4.22x–4.23x region.
With this structure in place, I avoid taking trades in the middle of the channel.
Instead, I focus only on the two extreme zones:
Sell at the upper channel resistance
Buy at the lower trendline + Fibonacci confluence
🎯 Trading Plan for Today
1️⃣ Sell Scenario – Short Position at Resistance 4,203
Sell: 4,203
Stop Loss:
4,225 (aggressive)
4,249 (safer for swing positions)
Take Profit: 4,183 → 4,161 → 4,143
Why 4,203 Is a Strong Sell Zone
It is the upper resistance of the H1 descending channel.
Price previously faced strong selling pressure here (supply zone).
If gold pulls back to retest 4,203, I prioritise short positions following the channel structure.
The first target is the recent low near 4,183, and extended targets lie at 4,161–4,143, aligned with mid-channel demand.
2️⃣ Buy Scenario – Long Position at Channel Bottom (Trendline + Fibonacci)
Buy: 4,142
Stop Loss:
4,119 (aggressive)
4,098 (safer option)
Take Profit: 4,170 → 4,198 → 4,205
Why 4,142 Is a High-Quality Buy Zone
Confluence of the major ascending trendline,
Fibonacci support,
And a previous demand area.
If gold falls into this zone and prints strong bullish reactions (pin bars, long wicks, rising volume), I consider it a valid counter-trend buy setup, aiming for the mid-channel and the 4.20x resistance.
📌 1️⃣ Fundamental Context
The USD is attempting a short-term rebound from its lowest levels since late October, creating temporary pressure on gold.
However, this recovery is limited because the market expects the Fed to shift toward a more dovish stance:
Recent macro data shows the US economy is cooling, with slowing growth.
Labour market conditions appear softer in November.
As a result, the probability of a 25bps rate cut at next week’s FOMC meeting has increased.
This keeps the medium-term outlook for gold positive, even though the current phase on H1 is still a technical correction.
Summary:
Short-term downside within the H1 channel,
But medium-term bias for gold remains supported by rate-cut expectations.
📌 2️⃣ Technical Outlook & Market Psychology
The H1 descending channel indicates a distribution/correction phase following a strong upward move.
Each touch of the channel top triggers selling — showing sellers remain active at higher prices.
The lower boundary + long-term trendline near 4.14x acts as an attractive area for medium-term buyers waiting for discounted entries.
Current sentiment:
Short-term traders: prefer selling at resistance and buying at support within the channel.
Medium-term traders: patiently wait for deeper zones near 4.14x, avoiding FOMO entries around 4.20x.
📌 3️⃣ Execution Plan
I avoid trading in the middle of the channel.
Only act at the two extremes:
Sell setup: 4,203
Buy setup: 4,142
Risk per trade is limited to 1–2% of the account.
Choose SL depending on timeframe (aggressive vs. conservative).
If price breaks the channel decisively
Above 4,249 (H1 close) or
Below 4,098,
→ I cancel all current setups and reassess the structure.

XAUUSD –| watch reaction at POC – VAL – VAH according to VolumeXAUUSD – Brian | watch reaction at POC – VAL – VAH according to Volume Profile
1. Market snapshot
Gold is entering a redistribution phase in the high price range, with fluctuations mainly revolving around large volume clusters on the Volume Profile. In this context, Brian's current priority scenario is to watch for a Sell when the price approaches the POC / VAL / VAH areas – where the market previously traded heavily.
2. Volume Profile – Notable price areas
POC – VAH area 4.217 is the price area where buyers/sellers previously "struggled" strongly, suitable for looking for sell signals if there is a rejection reaction.
VAL & the support area below around 4.134 is where short-term buying force may appear, suitable for a technical rebound buy scenario.
3. Trading plan (this week)
Scenario 1 – Sell according to Volume Profile (priority)
Sell: 4.217
SL: 4.125
TP: 4.200 – 4.182 – 4.150
Idea: wait for the price to rebound to the POC/VAH area around 4.217, observe the H1/M30 candle reaction. If a clear rejection signal appears (long upper tail, reversal candle...), the sell order can be activated according to the plan.
Scenario 2 – Short buy at VAL/support area
Buy: 4.134
SL: 4.125
TP: 4.155 – 4.180 – 4.200
Idea: if the price adjusts deeply near the VAL area and holds above 4.125, a technical rebound may occur. This is a short buy, not going too far against the trend, prioritizing partial profit-taking when the price returns to the upper POC area.
4. News to watch – Unemployment Claims
Today there are US Unemployment Claims figures, which are quite sensitive data for gold because:
The market will assess the strength/weakness of the US labor market.
Worse-than-expected figures → increase the likelihood of Fed easing → positive for gold.
Better-than-expected figures → support USD, may cause gold to face adjustment pressure.
Therefore, it is advisable to limit new orders close to the news release time, wait for the post-news candle to stabilize, and then reassess the structure.
5. Risk management (user-friendly for phone users)
Sell is the priority scenario but do not overlook SL 4.125, to avoid the case of a strong breakout above the current volume cluster.
With the Buy 4.134 scenario, it is advisable to split TP, move SL to breakeven when the price hits TP1 to reduce the pressure of having to "watch the chart" continuously on the phone.
If D1/H4 closes below the 4.125 area with large volume, Brian will consider it a signal to reduce short-term buying expectations and wait for a clearer new structure.

XAUUSD – LANA | Sell 4190–4194 and Buy 4100–4102 | 04/12 ...XAUUSD – LANA | Sell 4190–4194 and Buy 4100–4102 | 04/12
1. Fundamental Analysis
The current market sentiment is dominated by concerns about a global economic slowdown.
In a recession cycle, bond yields in the US and Europe tend to fall faster than in Japan, as these regions still have more room for rate cuts.
This results in:
A narrowing yield spread, causing USD/JPY carry trades to unwind.
Increased risk-off sentiment, pushing money back into JPY and safe-haven assets like gold.
If risk aversion strengthens further, USD/JPY may experience sharp declines rather than a slow drop.
Such volatility in the currency market often triggers strong swings in gold as well, providing better liquidity zones to trade — instead of chasing price at unfavourable levels.
2. Technical Analysis
On the H1 chart, gold is currently being squeezed between two major trendlines:
Upper descending trendline: drawn from the 4,245–4,260 highs, indicating sellers are active whenever price touches this line.
Lower ascending trendline: extending from the previous month’s low, acting as support for the medium-term uptrend.
Key zones on the chart:
Timing zone 4190–4194:
Near the descending trendline + previous volume cluster.
This is Lana’s preferred short-term Sell zone.
Buy zone at POC – VAL (Volume Profile):
A price area where strong trading activity occurred previously — potential buying interest if price corrects deeper.
Buy Liquidity Zone 4100–4102:
Located just above the major ascending trendline.
An attractive liquidity zone for trend-continuation buys if the market flushes downward.
Summary:
Price may first retrace to 4190–4194 and weaken from there.
If price drops to 4100–4102 and holds the ascending trendline, this becomes a solid area to consider buying again.
3. Key Price Levels to Watch
Resistance / Sell zone: 4190 – 4194
Invalidation for Sell (wide SL zone): 4219 – 4231 Support / Buy zone: 4100 – 4102
SL options for Buy setup: 4081 – 4063 – 4045 (depending on individual risk appetite)
4. Trade Scenarios
⭐ Short-Term Sell Setup
Sell entry: 4190 – 4194 SL: 4219 – 4231 TP: 4181 – 4155
⭐ Deep Buy Setup (Trend-Following)
Buy entry: 4100 – 4102 SL: 4081 – 4063 – 4045

XAUUSD Bullish Reversal Setup from Extreme POI – SSS Liquidity SChart Analysis
1. Market Context
The chart shows XAUUSD after a decline, now tapping into an EXTREME POI (Point of Interest).
Price reached a previous demand zone where strong reactions occurred before.
2. Liquidity Structure
Multiple areas are labeled “SSS” (Sell-Side Liquidity / Sell-Side Sweep).
Price appears to have:
Swept liquidity beneath local lows (SSS).
Tapped the extreme POI.
Shown an immediate rejection wick, indicating buyers stepping in.
This suggests the market may be exhausting sellers and preparing for a bullish leg.
3. Execution Zone
The grey region represents the entry zone (likely a demand imbalance / mitigation area).
The large blue box above marks the risk-to-reward projection for a long position.
4. Targets
You’ve placed two clear targets:
Target 1
A mid-range liquidity level at approximately 4217.279.
Represents a logical first take-profit based on prior structural inefficiencies.
Target 2
The upper area (labeled “TARGET”), aligning with:
Prior swing highs
A supply zone
A premium pricing zone (after retracement)
This would be the full TP for the bullish move.
5. Bias Summary
Bias: Bullish
Reason: Liquidity sweep + POI tap + structure showing potential for upside displacement.
The setup aligns with Smart Money Concepts:
Sweep → Mitigation → Displacement → Targeting Imbalances & Liquidity Pools

Elliott Wave Analysis XAUUSD – 04/12/20251. Momentum
• D1:
The D1 momentum is currently moving downward. We will need about 1–2 more daily candles for D1 momentum to enter the oversold zone, which would create conditions for a potential bullish reversal.
• H4:
H4 momentum is in the oversold zone. Therefore, today we may see another upward move or a period of sideways consolidation if H4 starts to turn upward.
• H1:
H1 momentum is decreasing, so a downward move on the H1 timeframe is likely before any reversal upward.
________________________________________
2. Wave Structure
• D1:
The D1 chart currently shows 4 consecutive bearish candles. Only 1–2 more candles are needed for D1 momentum to reach the oversold zone and prepare for a reversal. The small candle bodies and lack of strong bearish momentum indicate that wave C may still have one more push to the upside.
Potential target zones: 4329 and 4396.
• H4:
As D1 momentum approaches the oversold zone, today may complete wave 4 (green) within the 5-wave green structure. After that, price is expected to continue upward to complete wave 5 (green).
• H1:
Yesterday, we expected price to reach 4245, but it only touched 4242 before dropping. With the current structure, I expect a black ABC pattern.
The current decline is likely heading toward 4168 or 4144 to complete wave 4 (green).
• Important Note:
H4 momentum is in the oversold zone and can reverse at any moment. Therefore, 4184 is also a strong support area.
If H4 momentum turns upward and price moves sideways within 4184 – 4245, we may see the formation of a triangle correction for wave 4. I will update if this scenario develops.
________________________________________
3. Trading Plan
We focus on the zone where wave (C) equals wave (A) in length — which is around 4144, the preferred level for the completion of wave (C) and a Buy setup.
Buy Zone: 4146 – 4144
SL: 4125
TP1: 4168
TP2: 4246

Gold Analysis & Trading Strategy | December 3–4✅ 4H Chart (H4) Trend Analysis
1️⃣ Clear high-level consolidation on H4
During today’s U.S. session, gold surged to 4241.55, then pulled back quickly.
It failed to break the previous high 4264, indicating weakening bullish momentum.
The decline touched 4195, then rebounded strongly, showing solid institutional buying below, a typical high-level sideways + two-way washout phase.
2️⃣ Bollinger Bands Structure:
Middle band (≈4204–4206) is now the key support & bull-bear divider.
Upper band near 4256 was approached but not broken → strong resistance remains.
Lower band at 4181 has held multiple times → short-term bottom strengthening.
➡️ As long as H4 holds above the middle band 4204, gold maintains a bullish bias.
✅ 1H Chart (H1) Trend Analysis
1️⃣ Sharp rise → sharp drop → secondary rebound pattern
Gold was rejected at 4241, dropped straight to 4195 → bearish pressure released.
Then it quickly rebounded to 4210 → short-term bulls are fighting back.
This is a classic “stop-hunt spike → bottoming rebound” structure, not a bearish reversal.
2️⃣ Bollinger Bands (H1)
▪ Lower band (≈4194) successfully supported the price → valid support
▪ Middle band (≈4212) is the first resistance for short-term bulls
▪ Upper band (≈4230–4235) remains strong resistance
🔴 Resistance Levels:
▪ 4215–4220 (H1 MA20 + H4 moving-average cluster)
▪ 4230–4234 (H1 Bollinger upper band)
▪ 4250–4256 (H4 upper band + major resistance area)
🟢 Support Levels:
▪ 4195–4188 (strong U.S. session demand zone)
▪ 4185–4175 (key support; break = bearish)
▪ 4163 (confirmed swing low)
✅ Trading Strategy Reference
🔰 Main Strategy: Buy on Dips (short-term bullish bias)
🟠 First Buy Zone: 4195–4188
🎯 Targets: 4215 / 4230
⛔ Stop-loss: below 4178
🟠 Second Buy Zone: 4185–4175
🎯 Targets: 4230 / 4250
⛔ Stop-loss: below 4168
🔰 Secondary Strategy: Short on Rejections (short-term only)
🟠 First Sell Zone: 4215–4220
Enter light shorts if ANY of the following appear:
▪ Long upper wick
▪ Bearish 1H candle
▪ Weak breakout with low volume
🎯 Targets: 4195 / 4185
⛔ Stop-loss: above 4228
🟠 Second Sell Zone: 4230–4250 (major resistance zone)
🎯 Targets: 4195 / 4185
⛔ Stop-loss: above 4265
📌 Trend Summary
1️⃣ Today’s high 4241.55 = major resistance confirmed
2️⃣ Strong rebound after dropping to 4195–4188 → buyers active
3️⃣ Short-term structure = range-bound but bullish-tilted
4️⃣ 4215–4220 is the key breakout zone
5️⃣ Break above 4220 → targets 4234 / 4250
6️⃣ Break below 4175 → retest 4163
7️⃣ Medium-term bullish structure remains solid; current move is strong consolidation correction
🔥Trading Reminder: Trading strategies are time-sensitive, and market conditions can change rapidly. Please adjust your trading plan based on real-time market conditions.
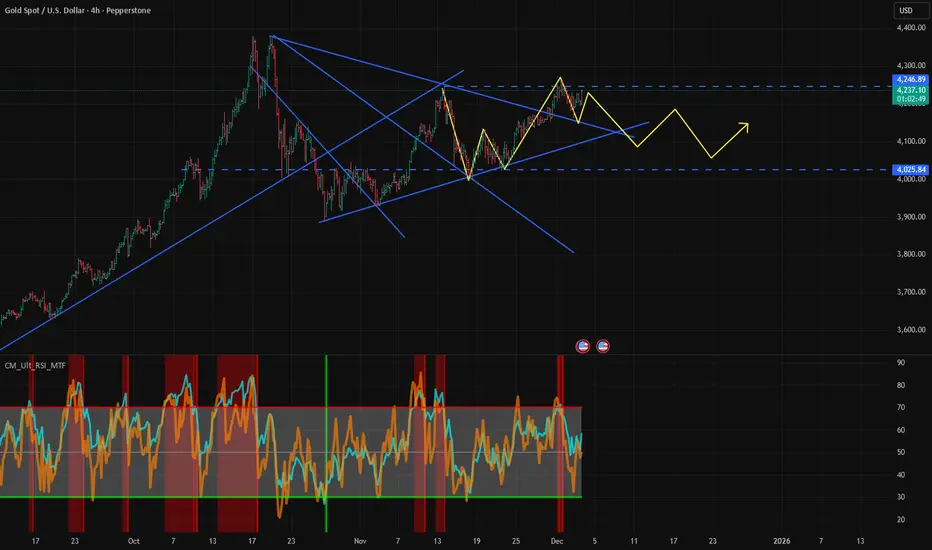
Gold trapped in shrinking range of 4.2-4.0kAnalysis: After reaching 4.4k top, gold is consolidating in shrinking range and now range has further reduced to 4.2 to 4.0k. Expected to trap people before taking any clear path in coming week

Gold 1H – 4262 Sweep Drop or 4188 Hold the Floor?🟡 XAUUSD – Intraday Smart Money Plan | by Ryan_TitanTrader (03/12)
📈 Market Context
Gold is trading into policy-driven liquidity engineering as former White House adviser Kevin Hassett gains renewed spotlight after public commentary from former U.S. President Donald Trump referencing potential Federal Reserve leadership influence. Expect sharp liquidity sweeps both sides before institutions commit.
Technically, H1 price coils between premium and discount extremes, and the next leg unlocks only after MSS (CHoCH) + BOS + displacement validation.
🔎 Technical Framework – Smart Money Structure (1H)
Current phase = liquidity-rich compression at H1 extremes
Liquidity zones & key triggers
• 🔴 SELL GOLD 4265 – 4267 | SL 4275
Institutional idea: sweep above premium → bearish MSS + valid BOS down → FVG/OB retest → delivery into discount.
• 🟢 BUY GOLD 4186 – 4184 | SL 4176
Institutional idea: sweep below discount → bullish MSS + BOS up → FVG/OB retest → demand expansion.
• 🟡 Equilibrium / Chop: no trading unless structure proves intent.
Expected sequence = Sweep → MSS/CHoCH → BOS → Displacement → Retest → Expansion
🎯 Execution Rules (unchanged methodology, matching your zones)
🔴 SELL GOLD 4265 – 4267 | SL 4275
Rules:
✔ Price taps 4266 zone → bearish MSS/CHoCH (M5–M15)
✔ Confirm clean bearish BOS down with displacement
✔ Enter on FVG fill or OB retest after displacement
Targets:
1. 4245 – 4240
2. 4225 – 4215
3. 4186 – 4184
🟢 BUY GOLD 4186 – 4184 | SL 4176
Rules:
✔ Price sweeps 4185 → bullish MSS/CHoCH + BOS up
✔ Confirm displacement away from discount
✔ Enter on wick rejection + FVG fill or OB retest confirmation
Targets:
1. 4215
2. 4240
3. 4265+
⚠️ Risk Notes
• Both sweeps = traps until BOS + displacement proves intent.
• No averaging inside compression.
• SL = structure invalidation only.
• Reduce lot size during volatility spikes from headline risk.
📍 Summary
Two institutional routes today:
• 4266 sweep → bearish MSS/BOS → retest → delivery into 4185
or
• 4185 sweep → bullish MSS/BOS → retest → expansion into new 4266+
Trade the structure. Let price narrate intent. Patience = edge.
📌 Follow @Ryan_TitanTrader for daily Smart Money breakdowns.

Sell IdeaGold Bearish Before Bullish
Unmitigated Order flow is pending
Buyside liquidity Pending
wait for Buyside Liquidity grab and execute in order flow
get this opportunity

XAUUSD SPOT VIEWxauusd spot Cmp 4200
4260 above sustain then 4350 4500 possible
4260 below 4120 4041 possible
view is for study purpose only

Gold another Upside blast is in makingDespite 4Hour MACD Negative Cross, 1Dy Fisher is positive, indicating measured consolidation before blast.
Although 1Month Fisher is at extended Top, before a fall in 1Month Fisher, one BLAST is pending. There may be any reason, including Fed Rate Cut optimism. So gear up for the ride Upside till 17th - 18th December 2025 frenzied FOMO behavior.
If gold is Upside, why Silver will lag behind? Is there any reason?
So, Gold + Silver - BUY

XAUUSD: Rate Cut Storm Ahead! Is Gold Set to Soar?1. 📢 FUNDAMENTALS PUSHING PRICE
FED About to Cut Interest Rates (90%): Cooling U.S. economic data strengthens the expectation of a 25bps cut next week. This weakens the USD and supports Gold.
Geopolitical Risks: Russia-Europe tensions keep the safe-haven demand for Gold high.
Key Event: Watch PCE on Friday to better determine the Fed's monetary policy path.
2. 🎯 TECHNICAL ENTRY POINTS
The optimal strategy is to BUY ON DIPS at strong support:
Optimal Buying Zone (Discount Zone): $4,181 – $4,186. This is the ideal Long Entry Point.
Resistance/POC: $4,207. Important short-term level.
Upside Target: $4,240. Next profit-taking target.
👉 Conclusion: Be patient and wait for Gold to adjust to the $4,181 - $4,186 zone to enter a buy order with low-risk advantage, leveraging macro upward momentum.
#XAUUSD #GOLD #FED #InterestRateCut #GoldAnalysis

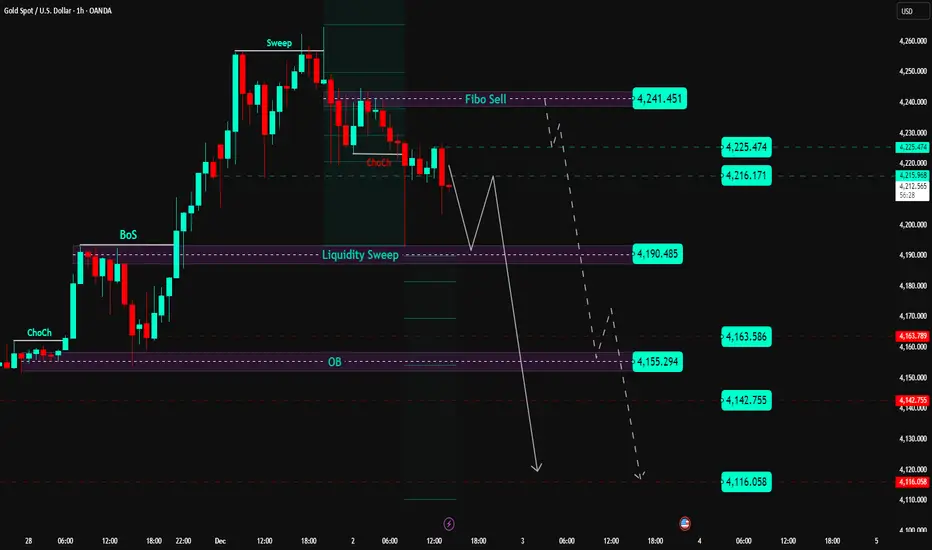
XAU/USD: Peak Sweep Done, Price Distributing in Premium📊 Market Structure
• After a strong bullish leg, Gold formed a clear Liquidity Sweep at the highs around 4,261 USD (Fibo Sell) , taking out all liquidity above that zone.
• From that high, price gradually weakened and printed a bearish ChoCH (loss of buying pressure; short-term structure no longer clean).
• Price is currently trading inside the premium zone between 4,190 – 4,241:
– 4,241 = Fibo Sell / liquidity extreme .
– 4,225 – 4,216 = lower premium zone , likely to react before retesting the highs.
– 4,190 = Liquidity Sweep + short-term support : only if price breaks below and retests from underneath will this zone flip into resistance for SELL continuation.
⇒ Current picture: short-term bearish bias , but sells should come from the premium zones (4,216–4,241) or only after a confirmed break of 4,190 — avoid chasing mid-range.
💎 Key Technical Zones
• Fibo Sell Zone: around 4,241.451 → optimal extreme for hunting SELL setups.
• Reaction Levels:
– 4,225.474
– 4,216.171
• Liquidity Sweep Support: 4,190.485 → main short-term support.
• Support / TP Zones:
– 4,163.586
– 4,155.294 (old OB)
– 4,142.755
– 4,116.058 (deeper low – extended target)
🎯 Trading Plan – SELL Priority From Premium
1️⃣ Primary SELL – Fibo Sell 4,241 & Premium 4,225–4,232
Ideal scenario: price retraces into the upper premium zone and prints a clear rejection signal (pin bar / engulfing / rejection volume).
• Entry 1: 4,225 – 4,232 (first scale-in)
• Entry 2: 4,235 – 4,241 (add if price sweeps higher)
• Stop Loss: above 4,250
• TP1: 4,190
• TP2: 4,163
• TP3: 4,155
• TP4: 4,142
• TP5: 4,116
→ Classic “sell the premium” setup: wait for price to return to the swept highs — avoid FOMO in the middle.
2️⃣ SELL Continuation – After Breaking 4,190
Only valid if we get a clear H1 close below 4,190 , confirming the Liquidity Sweep zone has been violated and flipped into resistance.
• Condition: H1 close below 4,190 → wait for a retest of 4,190–4,195 from underneath
• Entry: 4,190 – 4,195
• SL: above 4,205
• TP1: 4,163
• TP2: 4,155
• TP3: 4,142
• TP4: 4,116
→ This setup is only for traders who prefer clean continuation after a confirmed break of support.
3️⃣ Countertrend BUY – Only From Deep Zones
• Aggressive: watch for reactions at 4,163 – 4,155 . If strong rejection appears, consider a technical BUY retracement toward 4,190 – 4,216 (scalp).
• Conservative: wait for a deep test of 4,116 (stronger demand zone) before searching for BUY setups.
→ This is strictly countertrend; only take it if strong confirmation appears. Otherwise, skip and focus on SELL opportunities in premium zones.
🧠 Vincent’s View
Gold is currently “hanging” within premium after a very clean top sweep.
The safest strategy is to let price return to 4,225–4,241 before selling, or wait for a confirmed break of 4,190 to play continuation. Avoid selling directly at 4,190 while it still acts as support.
“Sell the premium, respect the levels – liquidity never lies.” ⚜️
⏰ Timeframe: 1H
📅 Updated: 02/12/2025
✍️ Analysis by: Captain Vincent
Gold H1 – Will 4278–4280 Trigger a Drop Into 4170 Today?🟡 XAUUSD – Intraday Smart Money Plan | by Ryan_TitanTrader (01/12)
📈 Market Context
Gold continues its impressive rally as markets price in a potential rate cut by the Federal Reserve (Fed) in December. Spot gold recently surged past $4,230/oz — hitting a multi-week high — as the US Dollar Index (DXY) weakened.
The backdrop is increasingly dovish: fading USD strength, soft U.S. macro data, and dovish comments from Fed officials have fueled speculative buying in gold.
Technically, gold remains elevated, hovering inside a rising channel — similar to what’s shown on your chart. Price compression following strong displacement suggests a consolidation before the next institutional move.
🔎 Technical Framework – Smart Money Structure (H1)
Current state = Accumulation / Distribution within rising channel
Liquidity zones & key triggers
• Premium liquidity zone (sell-opportunity): ~ 4278–4280 (near upper channel resistance) — aligns with your SELL zone.
• Discount liquidity zone (buy-origin / re-entry zone): ~ 4172–4170 (near lower channel support / trendline) — aligns with your BUY zone.
• Equilibrium / chop zone: mid-channel / recent consolidation zone — avoid trading blindly here unless structure breaks.
Expected Smart Money sequence
Sweep → CHoCH/MSS → BOS → Displacement → Retest (FVG/OB) → Expansion
Given the macro tailwinds (weak USD, rate-cut odds), gold remains primed for a directional move once structure confirms.
🎯 Trade Plans for Today
🔴 SELL GOLD 4278 – 4280 | SL 4288
• Thesis: A liquidity sweep at channel top / premium zone followed by engineered bearish displacement — capturing liquidity before a reversal.
• Entry rules (must wait for confirmation):
• Price touches 4280 zone
• Bearish CHoCH / MSS + BOS down on M5–M15
• Entry ideally on FVG fill or after order-block retest post-BOS
• Targets:
1. 4245 – 4240 area (first reaction)
2. 4225 – 4215 (mid-channel retest)
3. 4175 – 4172 (lower channel + buy zone)
🟢 BUY GOLD 4172 – 4170 | SL 4162
• Thesis: Discount-origin tap near lower channel support / trendline — smart money likely to accumulate for next leg up, especially amid dovish Fed sentiment.
• Entry rules (must wait for confirmation):
• Price dips into 4170 zone
• Bullish CHoCH / MSS + BOS up on M5–M15
• Strong bullish wick + FVG fill or OB retest confirmation
• Targets:
1. 4225 – 4230 (first reaction / mid-channel)
2. 4255 – 4265 (upper mid-channel)
3. 4278 – 4280+ (premium liquidity retest)
⚠️ Risk Management & Notes
• Avoid trading inside the mid-channel chop zone without structural confirmation — no “blind” entries.
• Do not treat sweeps (top or bottom) as trend entries — these are often traps.
• Use tight SL (structure invalidation), avoid averaging in consolidation.
• Given potential volatility from macro headlines or a USD bounce, consider reducing lot size.
Summary
Gold is currently riding macro tailwinds — weak USD + Fed rate-cut odds — but from a technical perspective, it’s compressed inside a rising channel. The day’s price action may be a classic Smart Money liquidity hunt: either a sweep at 4278–4280 leading to a sharp drop toward 4170, or a retracement to 4170 that sets up a fresh bull leg.
Only trade after structural confirmation (CHoCH / BOS + retest) — avoid “trend-hop” entries.
📍 Follow @Ryan_TitanTrader for daily Smart Money updates.

XAUUSD – LANA LOOKS FOR WAVE 5 BUY, SKIPS ALL SELL SETUPS ON ...XAUUSD – LANA LOOKS FOR WAVE 5 BUY, SKIPS ALL SELL SETUPS ON 03/12
1. Quick Summary
Main timeframe: H2 – H4
Data used: TPO, Footprint, Elliott Wave, futures/option flow
Core idea: Today Lana prioritises BUY setups only, aligned with Wave 5.
Key zone: Buy around 4190–4194, SL 4185, TP targeting the Wave 5 peak near 4315.
2. Futures & Market Profile Data
1. US Session TPO – “Thin” Structure
Yesterday’s TPO formed a Thin Profile, which commonly appears after a shakeout in an overall uptrend.
The Value Area was accepted at the lower region, but the market did not spend much time there.
Upper auction zones remain unfinished → increasing the probability that price will return to retest higher levels.
2. Footprint Chart – Strong Trap Sell with Negative Delta
On the H1 candle, the Footprint chart recorded a Trap Sell with Delta around –1113 contracts.
Sellers attempted a push down but were absorbed completely, leaving many short positions trapped at the candle’s low.
Lana interprets this as a sign that smart money is accumulating — shaking out weak buyers while absorbing fear-based sell orders.
3. Elliott Wave Outlook & Key Price Areas
The raw Elliott Wave count is still following the scenario Lana shared earlier this week:
Monday: Uptrend confirmed.
Tuesday: Wave 4 correction, offering a small sell opportunity.
Wednesday (today): Expectation of Wave 5 upward, so Lana focuses on buying.
The 4190–4194 zone aligns with the recent swing low and a strong liquidity/accumulation area.
Ideal Take-Profit Levels:
Minimum: Current Wave 5 high
If the wave extends cleanly:
Around 4315
Higher liquidity clusters at 4250–4260 and 4365–4370, based on H4/H2 chart structures
4. Trading Plan
⭐ Primary Scenario – ONLY BUY Today
Buy: 4190 – 4194
Stop Loss: 4185
Target: Current Wave 5 top
Extended target: Around 4315 (traders may divide TP depending on personal strategy)
Lana does not recommend selling against the trend today.
This is Lana’s personal market view based on TPO, Footprint, and the Elliott Wave model.
👉 Follow Lana on TradingView to receive the earliest updates.

Elliott Wave Analysis XAUUSD – December 3, 2025
1. Momentum Analysis
D1 – Daily Timeframe
Daily momentum is currently turning downward.
Looking at the D1 candle, price broke above the (A) high but closed back below it. This can be considered a liquidity sweep.
We need to wait for today’s daily close to confirm whether price can close above 4245.
With D1 momentum moving down, the market is likely to enter a 4–5 day corrective or sideways phase.
________________________________________
H4 – 4-Hour Timeframe
H4 momentum is still rising.
Based on its current position, the H4 momentum may need 1–2 more candles to reach the overbought zone.
Therefore, I expect price to approach the 4245 resistance, where H4 momentum will likely enter the overbought zone and reverse.
________________________________________
H2 – 2-Hour Timeframe
H2 momentum is clustered tightly in the overbought zone → reversal can happen at any moment.
________________________________________
2. Wave Structure
D1 Wave Structure
On the D1 chart, an (A)(B)(C) structure of wave X is forming.
The technical projection for the upside target is 4329 – 4396.
However, current momentum does not support further bullish continuation.
According to my trading approach, when uncertainty is high, I always prioritize momentum over wave projection.
→ Therefore, I treat the daily trend as bearish for now, until momentum shows a clear reversal.
“When in doubt, rely on an objective reference point — even if it may be right or wrong.”
________________________________________
H4 Wave Structure
On H4, I temporarily label a green 5-wave pattern for easier observation.
However, this structure is not confirmed yet, because wave 5 is only valid if price breaks above 4263.
At the moment, both scenarios remain possible:
• Price may still be in green wave 4, or
• Wave X (purple) may already be complete, and price may be developing purple wave Y.
Since H4 momentum is still rising and not yet overbought, I expect price to test the 4245 zone.
If H4 momentum enters the overbought area and reverses at that zone, it will form a high-probability Sell setup.
If price breaks above 4263 while H4 momentum is overbought, we will need to re-evaluate the green 5-wave structure.
________________________________________
H2 Wave Structure
On H2, a 5-wave black structure has already completed, followed by a strong decline.
Price is now retracing upward.
H2 momentum is in the overbought area, which means a reversal can occur at any time.
I expect price to reach the 4245 zone for a Sell opportunity.
If price fails to reach 4245 and instead drops straight below 4168, then the upper-zone Sell plan will be canceled.
________________________________________
3. Overall Market Context
We are inside a daily corrective wave, meaning multiple scenarios can coexist.
This is normal for corrective structures and makes precise forecasting more difficult.
→ Therefore, trading during this phase requires extra caution and strict risk management to protect the account.
________________________________________
🎯 Trading Plan
Sell Zone: 4244 – 4246
Stop Loss: 4267
TP1: 4184
TP2: 4144
TP3: 4081

XAUUSD (Gold Spot) – Daily & H4 Update | 03 Dec 2025Yesterday’s session delivered exactly the kind of two-way volatility we often see when a strong trend starts to lose momentum. Gold opened with early selling pressure, dropped sharply, and filled the bullish Fair Value Gap (between roughly 4170–4200 before finding buyers. The 4200 psychological round number held firm as dynamic support, and more importantly, yesterday’s daily candle closed comfortably above it, a clear sign that bulls are still defending this zone aggressively for now.However, the broader context remains cautionary. As highlighted yesterday, we printed a very narrow Central Pivot Range positioned near the top of the recent range. Price ultimately closed below this CPR, which is typically a bearish development and suggests the aggressive bullish momentum we saw through November is fading, at least in the short term.Current Technical Structure
Immediate resistance cluster sits at 4245-50. A convincing H4 close above 4230 (Fib level for recent drop) would be the first meaningful sign of renewed bullish strength.
The real confirmation of trend continuation comes only with a decisive break and daily close above 4245–4250 (R1 and the recent range high). Until that happens, the path of least resistance leans lower within this ascending channel.
Key Levels to Watch TodayBullish scenario Hold above 4230 → potential retest of 4250–60
H4 close > 4230 → opens 4245–4250 and possibly 4280 (R2)
Daily close > 4245 → resumes the broader uptrend targeting 4300+
Bearish scenario Failure to sustain today’s CPR (4198–4203) on an intraday basis increases downside risk
Break and close below 4198–4200 → high-probability move toward Previous Day Low ~4165
Loss of 4165 exposes S2 ~4130 and potentially the lower levels
Summary & Bias As long as 4200 hold, the structural uptrend remains valid . That said, the narrow-top CPR, repeated failure at 4245–4250, and yesterday’s close below CPR all point to waning momentum. base case for the next 24–48 hours is continued range-bound/two-way action between 4165–4250 unless we get a clear daily close outside of this zone. A sustained break below 4198–4200 would shift near-term bias to bearish with 4165 and 4130 as logical downside targets. Conversely, bulls need to reclaim and hold 4230+ quickly to keep the November uptrend alive.

Gold Analysis & Trading Strategy | December 2–3✅ During today’s U.S. session, gold dipped to a low of 4163 and then strongly rebounded to around 4195.
➡️ This indicates two key points:
1️⃣ 4163 has been confirmed as the short-term bottom of this downward move (strong support validated)
2️⃣ Buyers absorbed positions near the key support zone → rebound momentum is recovering
Gold has shifted from a “sharp decline / weak structure” into a “bottoming rebound pattern.”
✅ 4H Chart (H4) Trend Analysis
1️⃣ Signs of the high-level correction coming to an end
Gold corrected down from the 4264 high and reached a low of 4163.
The latest H4 candle shows a long lower wick, reflecting strong buying pressure and indicating that bulls have begun to defend.
2️⃣ Bollinger Bands Structure
Price has rebounded from below the middle band back above it → short-term bearish pressure is easing
Lower band at 4143 was not touched
Middle band (≈4202) is currently the key resistance & reversal level
➡️ If gold reclaims the Bollinger middle band at 4202, H4 will return to a strong bullish rhythm.
3️⃣ Moving Averages
MA5 and MA10 are pointing downward → short-term correction continues
But MA20 (≈4200–4202) is still sloping upward → the medium-term bullish structure remains intact
Current price is right under the MA20 resistance zone
➡️ 4200–4202 = the key reversal confirmation level for H4.
✅ 1H Chart (H1) Trend Analysis
1️⃣ Downtrend channel interrupted by a “strong lower wick”
Gold printed a significant lower shadow at 4163, signaling a classic “bottoming rejection.”
2️⃣ Moving Averages
Price has moved back above MA5 and MA10 → bearish momentum weakening
MA20 (≈4210) is still capping the rebound
➡️ A break above MA20 would flip H1 back into a bullish short-term structure.
3️⃣ Bollinger Bands Structure
Lower band (≈4176) was tested and price bounced sharply → strong support
Middle band (≈4210) is the short-term bullish breakout level
🔴 Resistance Levels: 4200–4202 / 4230–4234 / 4250–4256
🟢 Support Levels: 4185–4180 / 4175 / 4163
✅ Trading Strategy Reference
🔰 Main Strategy: Buy on Pullbacks (Trend intact, buy dips)
Current price around 4195 is part of the early rebound phase.
“Steady buyers” should watch two signals:
🔍 Signal 1: Ability to hold above 4202 (H4 reversal level)
🔍 Signal 2: Break above 4210 (H1 middle band)
🟠First Buy Zone: 4185–4180 (short-term support)
If price retests and holds, consider light long positions
🎯 Targets: 4205 / 4215 / 4234
⛔ Stop-loss: below 4170
🟠Second Buy Zone: 4175–4165 (strong support zone)
This area is the “institutional absorption zone.”
If tested again and holds, it becomes an excellent medium-term long entry.
🎯 Targets: 4205 / 4234 / 4250
⛔ Stop-loss: below 4155
🔰 Secondary Strategy: Short on Rejections (short-term only)
Even though price has rebounded, key resistance has not yet been broken, so shorting rejections remains a short-term strategy:
🟠First Sell Zone: 4202–4210
Short lightly if any of the following appear:
▪ Long upper wick
▪ Bearish 1H candle
▪ Weak breakout with low volume
🎯 Targets: 4185 / 4175
⛔ Stop-loss: above 4220
🟠Second Sell Zone: 4234–4250
(strong resistance, suitable for high-level shorts)
🎯 Targets: 4205 / 4180
⛔ Stop-loss: above 4262
✅ Trend Summary
1️⃣ 4163 = confirmed short-term bottom of this correction
2️⃣ Gold is currently in a bottoming rebound structure
3️⃣ 4202–4210 = must-break resistance zone for short-term bulls
4️⃣ Break above 4210 → gold turns strong again, targeting 4234 / 4250
5️⃣ Break below 4175 → gold may retest 4163, or even drop toward 4150
6️⃣ Medium-term bullish structure remains intact; the market has only completed a necessary technical correction
XAUUSD Elliott H1:waiting for ABC correction in a strong uptrendXAUUSD – Elliott H1: waiting for ABC correction in a strong uptrend
Brian – Short sell correction, prioritize Buy according to the major trend
1. Market snapshot
On H1, gold has just broken the upward Dow structure and completed 5 small waves – a common signal before an ABC correction.
The larger trend is still a very strong uptrend: gold is on track for its best year since 1979, up more than 60% in 2025, with the YTD performance gap between XAU and BTC continuing to widen.
Therefore: selling is only a short-term strategy, while the priority position for next week remains to buy on deep corrections.
2. Technical structure – Elliott H1
H1: 5 upward waves have completed → the base scenario is for the price to create a wave A down – B retrace – C down before continuing the trend.
The price area above 4,227–4,238 is a zone with selling liquidity + retesting the structure after breaking the H1 peak.
The 4,183–4,173 area (Fibo 0.618 of the most recent increase) is the main demand zone, reasonable to watch for buying in line with the trend with a good R:R.
3. Trading plan for next week
Scenario 1 – Short sell ABC correction (counter-trend)
Idea: take advantage of the A/B correction wave after 5 upward waves on H1.
Sell watch area: 4,227–4,238
SL: 4,246
Reference targets:
TP1: area 4,200–4,195
TP2: towards the Fibo/Buy zone 4,183–4,173
Note: this is a counter-trend order, only suitable for accounts accepting intraday risk, volume should be smaller than buy orders.
Scenario 2 – Buy according to the major trend at Fibo 0.618 (priority)
Idea: wait for the ABC correction to complete, buy at the "discount" price area according to Elliott and Fibo.
Buy watch area: 4,183–4,173 (Fibo 0.618 + technical support area).
SL: 4,166
Target direction:
Initially: return to the 4,220–4,230 area
Extended: depending on developments, it may aim for new highs in the context of a record growth year.
4. Fundamental context – Why prioritize Buy on deep corrections?
Gold increased +6% in November, marking the 4th consecutive month of gains.
Previously it was +3.7% in October and +11.9% in September – a very rare series of increases, reinforcing the long-term bull market story.
When an asset has risen strongly but still maintains momentum for many consecutive months, ABC-type corrections on H1 are often just opportunities for new money to participate, rather than trend reversals.

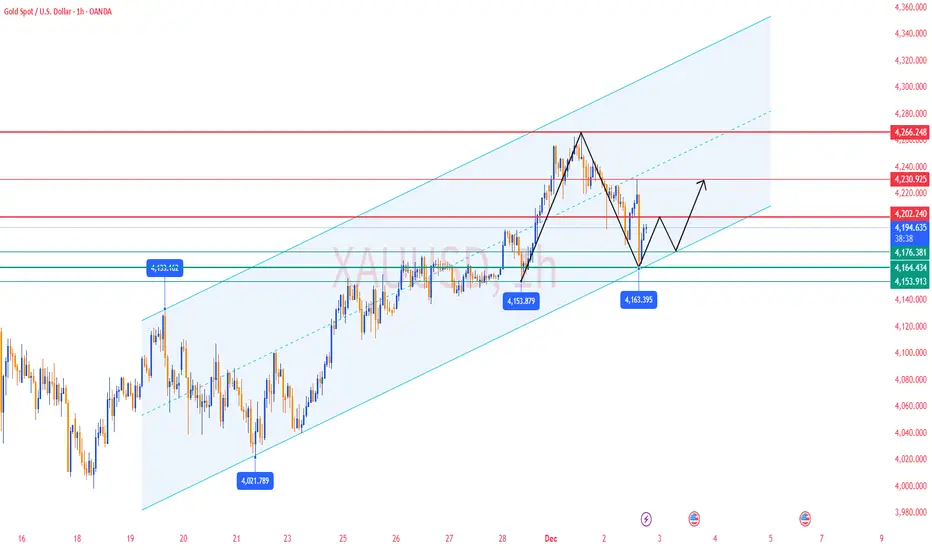
XAUUSD/GOLD 1H BUY PROJECTION 02.12.25Market Structure
Price has broken the uptrend line, causing a corrective move inside a descending channel.
The correction is respecting channel boundaries (multiple rejections on top & bottom).
🔹 Key Zones
Support Zone: 4180 area
→ Confluence of FVG (Fair Value Gap) + Demand Zone + Channel Bottom.
Target Zone: 4218–4220
→ Retest of the broken structure zone.
🔹 Buy Setup Logic
Price dipped into OBEY CHANNEL + FVG + SUPPORT zone (blue/purple box).
Expectation: Price should bounce from support and move higher.
First target aligns with:
Channel Top
Breaked zone retest
Previous minor structure level.
🔹 Projection Outcome
A bullish push towards 4218.89 zone is projected if support holds.
SL should be placed below the 4168–4170 zone under channel + FVG.
