XAUUSD Elliott H1:waiting for ABC correction in a strong uptrendXAUUSD – Elliott H1: waiting for ABC correction in a strong uptrend
Brian – Short sell correction, prioritize Buy according to the major trend
1. Market snapshot
On H1, gold has just broken the upward Dow structure and completed 5 small waves – a common signal before an ABC correction.
The larger trend is still a very strong uptrend: gold is on track for its best year since 1979, up more than 60% in 2025, with the YTD performance gap between XAU and BTC continuing to widen.
Therefore: selling is only a short-term strategy, while the priority position for next week remains to buy on deep corrections.
2. Technical structure – Elliott H1
H1: 5 upward waves have completed → the base scenario is for the price to create a wave A down – B retrace – C down before continuing the trend.
The price area above 4,227–4,238 is a zone with selling liquidity + retesting the structure after breaking the H1 peak.
The 4,183–4,173 area (Fibo 0.618 of the most recent increase) is the main demand zone, reasonable to watch for buying in line with the trend with a good R:R.
3. Trading plan for next week
Scenario 1 – Short sell ABC correction (counter-trend)
Idea: take advantage of the A/B correction wave after 5 upward waves on H1.
Sell watch area: 4,227–4,238
SL: 4,246
Reference targets:
TP1: area 4,200–4,195
TP2: towards the Fibo/Buy zone 4,183–4,173
Note: this is a counter-trend order, only suitable for accounts accepting intraday risk, volume should be smaller than buy orders.
Scenario 2 – Buy according to the major trend at Fibo 0.618 (priority)
Idea: wait for the ABC correction to complete, buy at the "discount" price area according to Elliott and Fibo.
Buy watch area: 4,183–4,173 (Fibo 0.618 + technical support area).
SL: 4,166
Target direction:
Initially: return to the 4,220–4,230 area
Extended: depending on developments, it may aim for new highs in the context of a record growth year.
4. Fundamental context – Why prioritize Buy on deep corrections?
Gold increased +6% in November, marking the 4th consecutive month of gains.
Previously it was +3.7% in October and +11.9% in September – a very rare series of increases, reinforcing the long-term bull market story.
When an asset has risen strongly but still maintains momentum for many consecutive months, ABC-type corrections on H1 are often just opportunities for new money to participate, rather than trend reversals.
Trade ideas

XAUUSD/GOLD 1H BUY PROJECTION 02.12.25Market Structure
Price has broken the uptrend line, causing a corrective move inside a descending channel.
The correction is respecting channel boundaries (multiple rejections on top & bottom).
🔹 Key Zones
Support Zone: 4180 area
→ Confluence of FVG (Fair Value Gap) + Demand Zone + Channel Bottom.
Target Zone: 4218–4220
→ Retest of the broken structure zone.
🔹 Buy Setup Logic
Price dipped into OBEY CHANNEL + FVG + SUPPORT zone (blue/purple box).
Expectation: Price should bounce from support and move higher.
First target aligns with:
Channel Top
Breaked zone retest
Previous minor structure level.
🔹 Projection Outcome
A bullish push towards 4218.89 zone is projected if support holds.
SL should be placed below the 4168–4170 zone under channel + FVG.

GOLD IN HAND WITH FED'S PUSH: ADJUSTMENT IS AN OPPORTUNITY!Wonderful! I will create another headline focusing on market dynamics and fundamental factors, excluding specific price levels, but still maintaining appeal and information.
🐂 GOLD IN HAND WITH FED'S PUSH: ADJUSTMENT IS AN OPPORTUNITY! 🚀
1. Fundamental Push
Main Support Force: Expectations of a dovish Fed and weak US economic data (PMI ISM 48.2) are weakening the USD and increasing bets on a Fed rate cut in December, strongly supporting Gold.
Geopolitical risks remain a potential "lifeline."
2. Technical Analysis & Opportunity
The main structure (1H) remains an Uptrend. The current price drop is a Pullback.
Strategic BUY Zone (DPZ):
Range: $4,195.961 – $4,199.760 (Converging with the Uptrend Line).
Action: WAIT TO BUY (LONG) when a confirmed reversal signal appears in this zone.
Targets:
TP1 (Short-term): $4,219.953
TP2 (Long-term): $4,244.426
Stop Loss:
Set a safe SL below DPZ, for example: Below $4,190.00.
🔥 Conclusion: As long as XAU/USD holds above the Uptrend Line and DPZ, we prioritize seeking BUY opportunities to continue the main trend.
#XAUUSD #Gold #GoldAnalysis #ForexTrading #FED #USD #LongOpportunity #MarketStructure

WHAT ARE YOU DOING BUY OR SELL ?🧭 Market Context
Gold’s still running that bullish leg structure, respecting the rising trendline beautifully.
Right now, price is dancing around the mid-supply zone (4,225–4,245) — this zone is key because it’s where we’ll see whether smart money defends or dumps liquidity before the next push.
A reaction sell from this zone can drive price into the Buy-side GZ (4,195–4,180) marked below.
That’s the golden reload zone — and your low-risk, high-reward setup area.
LET ME KNOW WHAT YOU GUYS THING ABOUT IT I HAVEALREADY MARKED MY LEVEL AND HAVE SET LIMIT ORDER
TELL ME YOUR LEVELS


A quick scalp in gold It's a clear againt the trend tred but candle closing below 20 ena in 5 min and also it might go down to hunt some liquidity. Let's hope for the best
Elliott Wave Analysis XAUUSD – Week 1 of December 20251. Momentum
W1 – Weekly Timeframe
Weekly momentum is currently turning upward, exactly as warned last week: if weekly momentum continues to rise strongly, the market may enter a bullish phase lasting 4–5 weeks.
However, the candlestick structure still shows short, overlapping candles, which do not yet reflect a clear long-term uptrend. Therefore, we need to continue monitoring closely.
D1 – Daily Timeframe
Daily momentum remains compressed in the overbought zone, indicating a potential reversal on the daily chart in the coming week.
H4 – 4-Hour Timeframe
H4 momentum is currently rising, suggesting that early in the Asian session on Monday the market may continue with another upward move or remain in a sideways structure.
________________________________________
2. Wave Structure
W1 – Weekly Timeframe
On the weekly chart, the main focus remains on weekly momentum:
• If weekly momentum pushes decisively into the overbought zone and price breaks the 4,396 high, the current corrective structure may be considered complete, and the market could begin yellow wave 5.
• The initial upside target in this scenario would be the 4,592 region.
However, weekly candles still do not support a long-term bullish view, as they lack a pattern of higher highs and higher lows and instead show overlapping behavior.
Therefore, for now, we prioritize monitoring the wave structure and momentum on D1.
________________________________________
D1 – Daily Timeframe
The strong rally on Friday pushed the price higher, threatening the red 1–2–3–4–5 count.
However, to fully invalidate this structure, price must reach or exceed 4,245.
→ Therefore, at this moment, the red 1–2–3–4–5 wave count remains valid.
If price breaks above 4,245, it suggests that purple wave X is still unfolding, forming a W–X–Y Flat correction in purple, with wave Y potentially ending near the previous wave X bottom.
If price breaks strongly above the orange wave 3 high (4,383), the market will enter orange wave 5, and given the nature of commodities—where wave 5 often extends—targets could exceed 4,592.
________________________________________
H4 – 4-Hour Timeframe
Since the red 1–2–3–4–5 count has not been invalidated, we continue to follow this plan.
On the H4 chart:
• Price is currently inside blue wave 5, which itself belongs to black wave 5 of blue wave C.
• Black wave 5 shows a five-wave internal structure in blue, but with overlapping price action, suggesting a possible ending diagonal formation for black wave 5.
If this is indeed an ending diagonal, the market should experience a sharp decline to confirm the pattern.
Key confirmation signals to watch on Monday:
• A H4 candle closing below 4,184
• Ideally, a stronger close below 4,158
If these conditions appear, we will prioritize breakout trading around:
• 4,184
• 4,158
I will provide a detailed update once we have real market data early next week.

gold spot update after breakoutgold spot given major breakout now have to see support 4160$ for any down correction. all eyes on fomc rate cut or not!! if gold spot stya abv 4225 than mkt looks big up side 4280--4345$ very soon .
trading ideas--- if market come down than buy only with support sl or relax for big tgt if any change in fomc rate cut than will cause to sudden down fall.
mcx gold--gold hold above 130000 than no worry for bulls for short term soon tgt 131--132k than afer may be some correction than after again 137k+++++ only close blow 130000 for 2days than down side expect 129300-128500--128000++++

TRADING PLAN XAUUSD 12/1/2025🔔 Hello everyone!
Let’s take a quick look at today’s market context and the trading plan for gold (XAUUSD).
📌 1. Market Context & Fundamentals
Gold has broken above the previous descending trendline and is maintaining a bullish structure on the H4 timeframe.
Bullish momentum is supported by several macro factors:
Expectations of a Fed rate cut in December.
Geopolitical tensions between the U.S. and Venezuela, as well as rising friction between Japan and China, which increases safe-haven demand.
Price may move sideways/pin during the session before continuing its broader uptrend.
2. Main Trading Idea: BUY BIAS
✅ Key BUY Zones
4190 – 4194
4150 – 4153
4105 – 4110 (deeper zone)
Nearest zone: 4210 – 4215
➡️ Each entry targets approximately 100 pips
3. Short-term SELL Reaction Zones (Scalping Only)
4250 – 4256 (recent high)
4294 – 4295
4300
4312 – 4315
➡️ Sell setups are only for quick scalps, not for holding long. Target ~100 pips
4. Expected Price Scenarios
If price pulls back to support → look for BUY setups aligned with the trend.
If price reaches strong resistance → only scalp SELL setups, avoid long holding.
Overall trend remains bullish, so BUY remains the primary strategy.
Summary
H4 Trend: Bullish
Trading Bias: Mainly BUY – SELL only at key resistance for scalps
Macro & geopolitical environment is supportive for gold upside.

XAUUSD – Early-week continuation buys, targeting Fibonacci ...✨ XAUUSD – Early-week continuation buys, targeting Fibonacci extension zones
Gold enters the new week under a very special market backdrop:
+6.0% in November, marking the 4th consecutive bullish month.
This follows +3.7% in October and +11.9% in September.
Year-to-date, gold is up about 60.7%, on track to record its strongest yearly gain in nearly five decades.
With a market that is literally making history, I am not trying to pick the top. I continue to prioritise trend-following buys, and only consider quick counter-trend sells at extended Fibonacci levels.
🎯 Scenario 1 – BUY THE DIP in line with the bullish trend
Buy: 4,194 – 4,195
SL: 4,185
TP: 4,210 – 4,235 – 4,270 – 4,295
The 4,194–4,195 zone on H1 is the VAL / lower boundary of the volume distribution after a strong impulsive move. It aligns with short-term structural support. If price pulls back cleanly into this area and forms a solid rejection candle, I prefer adding BUY positions with the prevailing trend.
Take-profit structure:
4,210 – 4,235: Near-term resistance zone, also around the 1.618 Fibonacci extension.
4,270 – 4,295: Major extension zone 2.618 Fibo, where selling pressure and short-term reversals may become stronger.
🔁 Scenario 2 – Short-term SELL at Fibo 2.618 extension
Sell: 4,285 – 4,287
SL: 4,295
TP: 4,262 – 4,240 – 4,210
This is a counter-trend setup, suitable only for small-lot scalping trades.
If price is pushed into the 4,285–4,287 region (near the 2.618 Fibo extension) but fails to sustain momentum—leaving long wicks or clear bearish reversal signals—I will consider SELLing back toward 4.26x – 4.24x, and deeper to 4.210.
1. Technical View from the Charts
The trend on H1/H4 remains strongly bullish, with higher highs and higher lows, and price respecting the upward channel.
The latest impulse has already extended above the 1.618 Fibo, now targeting the 2.618 extension around 4.28x–4.29x.
Below, VAL around 4.19x is the first support; deeper lies sell-side liquidity near 4.16x, where many buy-side stops are clustered (only relevant for deeper intraday corrections).
Given this structure, every pullback into support is treated as a trend-continuation opportunity, not a reversal signal.
2. Market Sentiment & Action Plan
After months of strong gains, the market is showing clear FOMO behaviour. This is why I avoid buying directly at resistance and instead wait for price to return to accepted value zones (VAL/POC) for better risk-to-reward entries.
The SELL setup is only a secondary scenario, triggered when price reaches a high Fibo extension and fails—usually leading to heavy profit-taking from earlier buyers.
✅ My Trading Plan
Primary Setup
BUY 4,194–4,195
SL 4,185
TP 4,210 – 4,235 – 4,270 – 4,295
Secondary Setup
SELL 4,285–4,287 (only with a clean bearish reversal signal)
SL 4,295
TP 4,262 – 4,240 – 4,210
Risk per scenario remains capped at 1–2% of the account.
No widening of stop-losses, and I stay out if market structure breaks.

Gold Holds Strong Inside Trend Channel,Prepares for New ATH PushGold continues to maintain impressive bullish momentum, trading steadily within its rising trend channel. With structure firmly supported and macro sentiment leaning dovish, the market appears to be positioning for a new short-term ATH if liquidity aligns.
📊 Technical Outlook (M30 – MMF Flow)
Gold has respected the ascending channel perfectly, with each corrective leg finding buyers along channel midline and lower boundary.
The most recent impulse broke through the 4,23x region before pulling back into local liquidity.
Key Liquidity Zones
4,236 – 4,254 → Short-term supply reacting
4,218 – 4,220 → Minor demand zone
4,196 – 4,199 → Major BUY Zone (channel support + imbalance fill)
Market structure remains bullish as long as price holds above 4,196, the confluence level where:
✔️ Demand zone
✔️ Trend channel support
✔️ Fibonacci retracement
all align.
A clean bounce from this zone could trigger the next expansion leg.
🎯 MMF Trading Plan – BUY Priority
Scenario 1 – Continuation Bounce
Entry (Buy): 4,218 – 4,220
SL: 4,210
TP: 4,254 → 4,272 → 4,281
Scenario 2 – Strong Liquidity Sweep BUY (Preferred for RR)
Entry (Buy): 4,196 – 4,199
SL: 4,188
TP: 4,236 → 4,254 → 4,281
SELL Trades
Only scalp sells at supply zones
(4,254–4,257 / 4,281–4,283)
→ Not a main strategy while trend remains bullish.
⚜️ MMF View
Gold is showing healthy bullish structure, with clear liquidity engineering and controlled corrections.
As long as price stays within the trend channel and above 4,196, the path of least resistance remains up.
A breakout toward 4,281+ is highly likely before any deeper correction.
“In bullish markets, the best trades come from buying the dip—never chasing the pump.”XAU/USD – Gold Holds Strong Inside Trend Channel, Prepares for New ATH Push
Gold continues to maintain impressive bullish momentum, trading steadily within its rising trend channel. With structure firmly supported and macro sentiment leaning dovish, the market appears to be positioning for a new short-term ATH if liquidity aligns.
📊 Technical Outlook (M30 – MMF Flow)
Gold has respected the ascending channel perfectly, with each corrective leg finding buyers along channel midline and lower boundary.
The most recent impulse broke through the 4,23x region before pulling back into local liquidity.
Key Liquidity Zones
4,236 – 4,254 → Short-term supply reacting
4,218 – 4,220 → Minor demand zone
4,196 – 4,199 → Major BUY Zone (channel support + imbalance fill)
Market structure remains bullish as long as price holds above 4,196, the confluence level where:
✔️ Demand zone
✔️ Trend channel support
✔️ Fibonacci retracement
all align.
A clean bounce from this zone could trigger the next expansion leg.
🎯 MMF Trading Plan – BUY Priority
Scenario 1 – Continuation Bounce
Entry (Buy): 4,218 – 4,220
SL: 4,210
TP: 4,254 → 4,272 → 4,281
Scenario 2 – Strong Liquidity Sweep BUY (Preferred for RR)
Entry (Buy): 4,196 – 4,199
SL: 4,188
TP: 4,236 → 4,254 → 4,281
SELL Trades
Only scalp sells at supply zones
(4,254–4,257 / 4,281–4,283)
→ Not a main strategy while trend remains bullish.
⚜️ MMF View
Gold is showing healthy bullish structure, with clear liquidity engineering and controlled corrections.
As long as price stays within the trend channel and above 4,196, the path of least resistance remains up.
A breakout toward 4,281+ is highly likely before any deeper correction.
“In bullish markets, the best trades come from buying the dip—never chasing the pump.”

XAUUSD – LANA FOCUSES ON BUYING WITH THE SWING TREND AT THE...✨ XAUUSD – LANA FOCUSES ON BUYING WITH THE SWING TREND AT THE START OF THE WEEK
Fundamental Analysis
The Fed has just announced that it will end its QT (Quantitative Tightening) programme starting from 1st December, along with setting the federal funds target rate at 3.75–4%.
When QT stops, the balance-sheet reduction slows down, meaning liquidity is no longer being aggressively withdrawn from the market. This generally supports risk assets — and gold as well.
Mechanism recap:
QE: Expands the Fed’s balance sheet, injecting liquidity into the market.
QT: Shrinks the balance sheet, pulling liquidity out.
With QT paused, the market expects the Fed to take a softer stance on monetary policy, which strengthens the medium-term bullish outlook for gold.
Given this environment, Lana expects gold to retain upside potential early in the week, though price may show volatility near key liquidity zones.
Technical Analysis
On the H4 timeframe, price structure is following a clear bullish Elliott Wave sequence (1)–(2)–(3)–(4)–(5). The current upward wave has not shown any major reversal signal yet.
The Swing Zone at 4190–4195 is the nearest important low and serves as the primary short-term support. This is Lana’s preferred zone for swing-trend buying.
Above price, two notable Liquidity Zones are forming:
4250–4260: Near liquidity zone where fake breaks or temporary pullbacks may appear.
4365–4370: Higher liquidity zone aligned with previous highs — likely an area for significant profit-taking if the bullish wave continues.
Lana’s main expectation: gold may pull back slightly into the 4190–4195 swing zone, then extend the bullish wave to re-test the liquidity regions above. However, since liquidity zones often create stop-hunts and fake breakouts, Lana does not recommend buying directly at these resistance levels.
Key Price Levels
Main Support (Swing Buy Zone): 4190 – 4195
Resistance / Liquidity Zones:
4250 – 4260
4365 – 4370
Trade Setup
Buy: 4190 – 4195
Stop Loss: 4185
Take Profit: 4250 – 4260 – 4365 – 4370


XAUUSD Smart Money Outlook – Intraday Discount Buy ModelXAUUSD Bias: Bullish – Looking for Longs Only
The market remains in a clear bullish structure on the Daily, H4, and H1. Price is currently trading in premium levels after a strong displacement. The expected behavior for the next trading day is for price to retrace into the Intraday Discount zone during Asia, accumulate in London, and then expand bullishly during New York session.
#XAUUSD #Gold #Forex #Trading #ICT #SmartMoney #OrderFlow #Liquidity #PriceAction #NYSession #LondonSession #FVG

XAUUSD MULTI TIMEFRAME ANALYSIS Hello traders , here is the full multi time frame analysis for this pair, let me know in the comment section below if you have any questions , the entry will be taken only if all rules of the strategies will be satisfied. wait for more price action to develop before taking any position. I suggest you keep this pair on your watchlist and see if the rules of your strategy are satisfied.

Part 11 Trading Master Class What Are Options?
Options are financial contracts that give the buyer the right, but not the obligation, to buy or sell an underlying asset at a predetermined price (called the strike price) before or on a specific date. Unlike shares, which give ownership, options only provide trading rights.
There are two main types of options:
Call Option – gives the right to buy.
Put Option – gives the right to sell.
The buyer of an option pays a premium, while the seller (or writer) receives the premium and must fulfill the contract if the buyer exercises it.

Gold Bulls vs Bears: Who Will Win the $4,100 Battle?🧭 Market Overview
Current Price Zone: Gold is trading near $4,141.27, slightly below recent highs around $4,200.
52-Week Range: From a low of $2,583.49 to a high of $4,381.60, indicating strong bullish momentum over the past year.
Recent Action: Price is consolidating between $4,040 and $4,080, suggesting a pause after a multi-month rally.
📊 Technical Indicators
Trend: Long-term bullish, but short-term momentum is neutral to slightly bearish.
Support Zones:
$3,987: 55-day SMA, acting as a dynamic support.
$3,886: Weekly low, a key horizontal support level.
Resistance Zones:
$4,245: November high, first major resistance.
$4,380: All-time high, ultimate bullish target.
Momentum Indicators:
RSI and MACD show weakening bullish momentum.
Stochastics and Williams %R suggest potential overbought conditions.
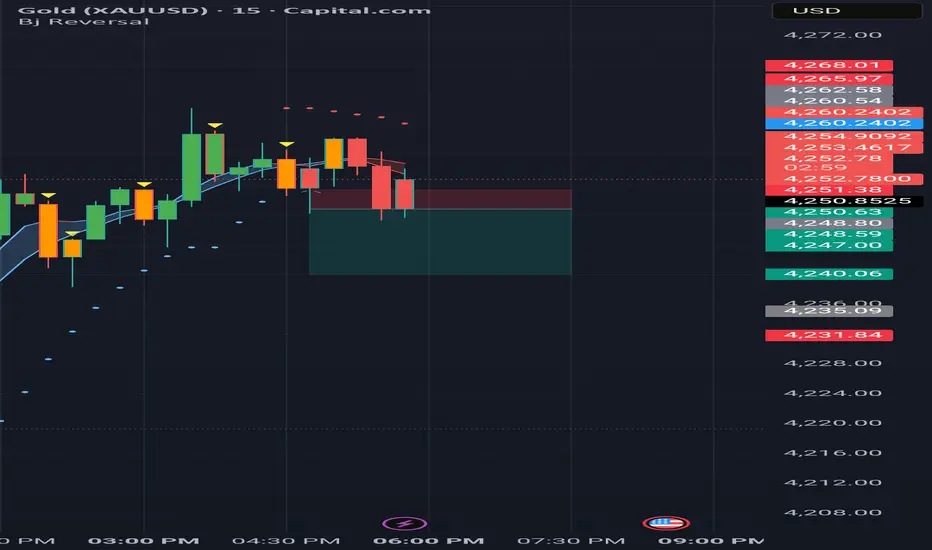
📐 Chart Analysis
Demand Zone: The grey rectangle around $4,173.23 likely marks a support area where buyers previously stepped in.
Stop-Loss Zone: The red rectangle below current price could represent a risk threshold for long positions.
Take-Profit Zone: The upper grey rectangle suggests a bullish target zone, possibly aligned with the $4,245–$4,380 resistance band.
Time Markers: Vertical red dashed lines may indicate key news events or session starts that influenced volatility.
🧠 Strategic Insights
Bullish Scenario: A breakout above $4,245 could trigger a run toward $4,380. Traders may look for confirmation via volume spikes or bullish candlestick patterns.
Bearish Scenario: A breakdown below $4,040 could expose the $3,987 and $3,886 supports. Watch for bearish divergence in momentum indicators.
Neutral Bias: Until price breaks out of the current range, scalping or range-bound strategies may be more effective than trend-following.
🛠 Trade Setup Suggestions
Entry: Consider entries near $4,100 if bullish signals emerge (e.g., bullish engulfing, MACD crossover).
Stop-Loss: Below $4,040 or $3,987 depending on risk tolerance.
Take-Profit: Target $4,245 initially, with extended targets at $4,380 if momentum continues.
🔍 Final Thoughts
Gold’s technical landscape is rich with opportunity but demands precision. The current consolidation phase is a battleground between bulls and bears. Traders should stay nimble, monitor macroeconomic cues (like Fed rate decisions), and adjust risk management accordingly.

Gold 4H – Can XAUUSD reject 4245 before diving into 4140?📈 Market Context
Gold rallied as the U.S. dollar closed softer on repriced Fed rate-cut expectations, with market headline flow confirming USD finishes lower and gold rallies on renewed cuts timing debates — a setup that encourages external liquidity raiding before weekly direction is revealed. Forex Factory
4H conditions are classic for liquidity engineering: price trades near balanced mid-range flows, institutions exploit USD weakness into weekly open, and both buyer/seller pools are vulnerable to strategic sweeping before expansion.
Expect volatility spikes around U.S. session opens and PMI headline catalysts.
🔎 Technical Analysis (4H / SMC View)
🟢 Buy Zone: 4140–4138
SL: 4130
TP targets: 4175 → 4200 → 4220 → 4250 → 4280+
Rationale:
• Discount zone beneath 4H liquidity shelf
• Demand mitigation + accumulation narrative after sweep
🔴 Sell Zone: 4245–4247
SL: 4255
TP targets: 4220 → 4200 → 4175 → 4150 → 4140
Rationale:
• Premium supply above equal-high liquidity
• 4H imbalance magnet below waiting to be filled
⚠️ Risk Management Notes
• Wait for M15 ChoCH / BOS confirmation before entries — avoid blind positioning.
• Expect wider spreads and wick manipulation on USD headline releases.
• Avoid trading 10–20 minutes before high-impact USD news (PMI, Fed speakers).
• Scale partials at each TP level, let runners work only after confirmation is printed.
Summary
Gold remains in 4H rangebound engineering territory where Smart Money is likely to sweep premium above 4245, deliver a correction to 4140, then seek a validated bullish reaction from discount demand on confirmed USD volatility.
Patience and confirmation first. Liquidity always wins.
🚀 Follow @Ryan_TitanTrader for more weekly SMC setups

XAUUSD – H4 Fibonacci Supports the Bullish Trend, Prefer ...XAUUSD – H4 Fibonacci Supports the Bullish Trend, Prefer Buying at the POC for the Coming Week
Gold closed Friday near 4,215, following a strong rally after the CME system glitch.
On the H4 timeframe, the bullish structure is now clearly forming and remains relatively stable. Price has just broken out of a multi-day consolidation zone and is moving into the Fibonacci extension levels.
With the current context, I continue to prioritise medium-term buy setups on pullbacks to the POC, rather than chasing price at new highs.
🎯 Primary Trading Plan – BUY THE DIP Using Fibonacci & POC
Buy Entry: around 4,187
Stop Loss: 4,175
Target Levels: 4,225 – 4,240 – 4,290 – 4,300
These profit-taking zones are derived from the H4 Fibonacci extensions, with the 1.618–2.618 levels being areas where strong profit-taking often appears in the market.
For every position, I maintain risk at only 1–2% of the account — staying in the game matters more than trying to catch every top or bottom of a wave.
Key Level:
4,160 is the major support and the “life line” of the H4 uptrend.
If price breaks below and closes under 4,160 on H4, the current bullish structure is invalidated. In that case, I will pause the BUY scenario and rebuild a new plan — possibly considering a deeper SELL setup in the next analysis.
1. Fundamental Context
Gold’s strong recovery momentum recently slowed down after failing to stay above the 4,160 region.
However, the previous rally took place while the USD was weakening again, despite US bond yields attempting to recover across the curve.
On the higher timeframes, gold is on track for its fourth consecutive bullish month, following the major breakout in October that once again drew attention to the 4,400 region.
Prolonged geopolitical tensions combined with expectations of further Fed rate cuts give buyers enough reason to maintain mid-term positions, even if short-term volatility increases.
Overall, the fundamentals remain supportive of the uptrend — unless there is a major shift in interest-rate expectations or systemic risk.
2. H4 Technical Analysis – Fibonacci Perspective
The previous consolidation zone around 4,160–4,185 was broken to the upside with a series of strong bullish candles, confirming a higher-high, higher-low structure on H4.
The POC (Point of Control) has shifted upward to 4,187, signalling heavy trading activity before the breakout — a suitable area for waiting on a retest to buy again.
Fibonacci extensions from the latest bullish swing highlight important resistance clusters ahead:
1.618: the 4.24x zone — first profit-taking target, likely to see volatility.
2.618: the 4.35x–4.36x region — an extended target if the bullish trend continues strongly.
With this structure, any pullback to 4,187 while holding above 4,160 is, for me, a medium-term BUY opportunity, not a reversal signal.
3. Market Sentiment & Action Plan
After a strong rally, the market is experiencing FOMO buying at elevated levels.
This phase often brings sudden pullbacks to shake out late buyers.
I avoid chasing the price during this stage.
Instead, I wait for price to revisit the POC at 4,187, where volume previously accumulated, to secure a better risk-to-reward and a tighter SL.
If buyers truly dominate, they will protect the 4,160–4,187 region.
If not, stepping aside after structure breaks is safer than forcing a bias.
Plan for Next Week
Priority: Buy around 4,187
SL: 4,175
TP: 4,225 – 4,240 – 4,290 – 4,300
If price breaks strongly below 4,160 and closes under it on H4 →
Cancel all BUY plans and wait for a new structure before considering any deep correction SELL setup.
Do not chase buys near high Fibonacci extension levels unless there is a clear intraday setup with a well-defined SL.
If you find this perspective useful for your gold trading plan next week, follow the TradingView account and share which levels you are watching for entries. I always read the feedback to improve future analyses.

Gold 4H – Liquidity Plays Ahead of Fed Minutes & PMI Data🥇 XAUUSD – Weekly Smart Money Outlook | by Ryan_TitanTrader
📈 Market Context
Gold continues to trade inside a controlled 4H consolidation as markets brace for a highly event-driven week: U.S. PMI releases, updated Fed guidance, and renewed debates over the timing of future rate cuts.
Recent data has shown mixed momentum — softer employment trends but steady business activity — keeping the dollar volatile and gold reactive near mid-range liquidity.
Institutional flows remain cautious, reducing aggressive positioning ahead of major macro catalysts. This environment typically leads to engineered sweeps on both sides of the range as Smart Money hunts liquidity before revealing direction.
Expect short-term volatility spikes, especially around U.S. session opens and PMI releases.
🔎 Technical Analysis (4H / SMC View)
• Price is navigating a minor bearish structure, forming lower highs while protecting deeper liquidity beneath 4020.
• The recent 4H BOS + corrective pullback suggests the market may generate a liquidity grab toward the discount zone before any strong bullish leg develops.
• A Premium Sell Zone at 4225–4227 sits above resting liquidity, making it an ideal region for stop hunts and short-term distribution.
• The Discount Buy Zone at 4010–4008 aligns with structural reaction points, unmitigated demand, and a liquidity shelf — ideal for accumulation.
• Mid-range liquidity around 4060–4080 may be swept before the market chooses a larger weekly direction.
🟢 Buy Zone: 4010–4008
SL: 4000
TP targets: 4085 → 4120 → 4175 → 4220
Rationale:
• Deep discount zone beneath 4H liquidity
• Confluence of demand + structural mitigation
• High probability of engineered sweep before bullish expansion
🔴 Sell Zone: 4225–4227
SL: 4235
TP targets: 4175 → 4120 → 4060 → 4015
Rationale:
• Premium supply above equal-high liquidity
• Favors stop hunt + distribution before correction
• Aligns with previous 4H rejection and imbalance fill
⚠️ Risk Management Notes
• Wait for M15 ChoCH / BOS inside each zone before entering — avoid blind entries.
• Expect spreads and liquidity manipulation around news: US PMI, Fed speeches, and data surprises.
• Avoid trading 10–20 minutes before high-impact events.
• Scale partial profits at each structural target to secure gains and let runners develop.
✅ Summary
Gold remains trapped in a structured 4H range where Smart Money is likely to sweep one side before delivering a decisive expansion.
Discounted buys at 4010–4008 and premium sells at 4225–4227 remain the highest-probability weekly setups.
Stay patient, respect liquidity, and follow confirmation.
🔔 FOLLOW @Ryan_TitanTrader for more weekly SMC setups 🚀

XAUUSD – Weekly outlookXAUUSD – Weekly outlook: structure points towards 4,580 as long as bulls hold the line
Brian – Favouring buy-the-dip setups while price holds above 3,996
1. Market overview – triangle break and trend confirmation
On the daily chart, gold has finally broken out of the long consolidation triangle, with Friday’s candle closing cleanly above the descending trendline that has capped price for weeks.
For me, this breakout is the first proper confirmation that the primary bullish trend is resuming.
The next major resistance on the chart sits around 4,246 – a key level I’m watching as a trend-confirmation line.
If price can break and hold above 4,246, the path towards the higher zone around 4,580 opens up, in line with the Fibonacci extension drawn on the chart.
In short: the structure into next week is bullish, with pullbacks seen as opportunities to position for a potential move towards new highs.
2. Technical structure – from breakout to extension targets
The breakout from the triangle comes after a sequence of higher lows bouncing off the rising trendline, indicating accumulation rather than distribution.
Below price, we have demand zones clustered around the 4,110 trendline area and deeper supports near 4,040 and 3,920.
Above price, the roadmap is fairly clear:
First, a test of 4,246 (local resistance & former supply).
Then the ATH / prior high region around 4,360–4,380.
Finally, the Fibonacci 1.618 extension projects into the 4,560–4,580 zone, which is my medium-term upside objective if bulls can maintain control.
As long as daily structure keeps printing higher highs and higher lows and price stays above the key invalidation at 3,996, I will continue to treat gold as buy-on-dip rather than looking for major tops.
3. Key zones & trading ideas for next week
I’m not treating this as a signal service, but here’s how I’m mapping the chart for my own trading:
Primary idea – Buy the dip into trendline / support
Watch zone: around the rising trendline near 4,110.
If price pulls back into this area early in the week and shows a clear rejection on H4/D1 (wick rejections, bullish engulfing etc.), I’ll be interested in building long positions.
Upside path:
First objective: 4,246 – trend-confirmation resistance.
If broken and retested from above, the next leg could extend towards 4,360–4,380.
Extension target: 4,560–4,580 in line with the 1.618 Fibonacci projection.
Secondary idea – Using Fibonacci zones on break above 4,246
If gold breaks and holds above 4,246, the Fibonacci zones between roughly 4,360 and 4,580 become interesting for scaling in / managing positions:
Partial profits or tight trailing stops can be considered as we approach 4,360–4,380.
Any healthy corrective pullback from that region that respects the rising structure could still offer add-on entries with the 4,580 zone as a medium-term target.
Invalidation:
A daily close below 3,996 would seriously damage this bullish structure and force me to reassess. Below that, I would step aside and wait for a new pattern rather than trying to force the long idea.
4. Fundamental backdrop – why gold still has a bid
From a macro point of view, gold is navigating a mix of:
Tariff and trade tensions, which keep hedging demand alive as investors look for protection against policy shocks.
Ongoing geopolitical risks and conflict, supporting gold’s role as a classic safe-haven asset.
A late-cycle interest-rate environment, where markets are increasingly focused on when and how aggressively central banks will adjust policy after a period of elevated rates and liquidity distortions.
This combination tends to limit the downside for gold: even when we see corrections, dip-buyers are never too far away, especially when the technical structure is aligned with the macro story.
5. Strategy & risk management
Into next week, my bias is clear: structure is bullish above 3,996, so I prefer buying pullbacks rather than trying to short into strength.
The trendline around 4,110 is my first area of interest for fresh longs; anything closer to 4,040–4,000 (if we see a deeper flush) would be considered an even better price, provided the daily structure doesn’t break.
As always, position sizing and stop placement are key – one good weekly move is far more valuable than several emotional entries trying to catch every candle.
What do you reckon – does this breakout have enough fuel to take us towards 4,580, or do you see a deeper correction setting up first? Feel free to share your view in the comments.

XAUUSD – LANA WAITING TO BUY THE CONTINUATION WITHIN THE ...XAUUSD – LANA WAITING TO BUY THE CONTINUATION WITHIN THE UPTREND CHANNEL
1. Fundamental Analysis
Gold is maintaining its upward momentum as investors closely monitor the Russia–Ukraine tension and the mixed signals around potential peace efforts.
President Putin’s recent statements suggest peace proposals could form the basis of a future agreement, yet Russia is still prepared to continue fighting if conditions are not favourable. This creates a mixed risk environment — reducing short-term safe-haven demand but still keeping geopolitical uncertainty elevated, which may pressure the USD in the medium term.
In this context, Lana prefers the scenario where gold continues to follow the broader uptrend, looking for opportunities to buy on technical pullbacks into major liquidity zones rather than FOMO entries at higher prices.
2. Technical Analysis
On the H1 timeframe, XAUUSD is moving inside a clear ascending channel, currently trading near the midline of the channel. The dominant structure remains bullish, with no sign of a break of market structure.
After a strong bullish candle, the market left a Strong Liquidity area below and created a small Gap under the channel — this is where Lana expects price to retrace and retest before resuming the upward movement.
The Buy zone aligns with a major liquidity region near 4,166–4,167, close to the lower boundary of the channel — an ideal level for continuation buys during a controlled pullback.
Using Fibonacci extensions, the key levels include:
1.618: near the current price — a region where price often pauses or consolidates
2.618: around 4,210 — Lana marks this as a potential short-term Sell scalping zone
3.618: around 4,235–4,237 — a stronger Sell zone where heavy profit-taking may appear
The 4,155 level is a key structural boundary:
If price breaks below and holds under this zone, Lana will stop prioritising long-term buy setups, as the bullish channel may be invalidated.
3. Key Levels to Watch
Support / Buy zone & strong liquidity:
4,166 – 4,167 (near the midline descending toward the lower channel boundary)
4,155 — mid-term trend boundary
Resistance / Fibo extension & Sell zones:
4,210 – 4,213: Sell scalping zone (Fibo 2.618)
4,235 – 4,237: Strong Sell zone (Fibo 3.618), near the channel top
4. Trade Setups
BUY Setup:
Buy: 4166 – 4167
SL: 4160
TP: 4182 – 4195 – 4210 – 4250
SELL Setup 1:
Sell: 4210 – 4213
SL: 4218
TP: 4200 – 4185 – 4160 – 4145
SELL Setup 2:
Sell: 4235 – 4237
SL: 4243
TP: 4212 – 4200 – 4185 – 4160
👉 Follow Lana on TradingView to read all updates early. 💛
