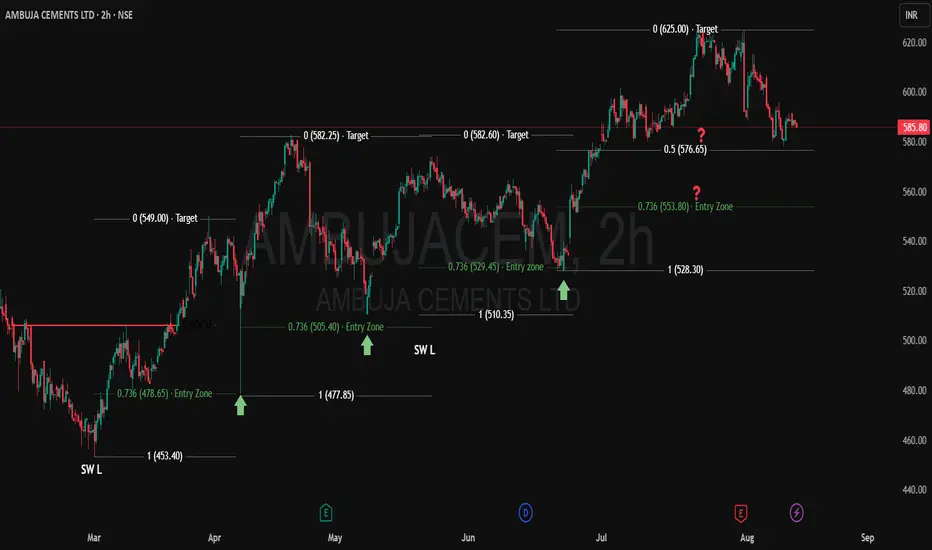
Ambuja Cement: Strong Bullish Structure with ICT Trading MethodAmbuja Cement is showing a Higher High (HH) and Higher Low (HL) structure, indicating a strong bullish trend. The current price stands at ₹588.50.
Based on the ICT method, the 0.78% retracement level acts as a demand zone during counter-trend moves. Previous projections have been:
₹477 → ₹582 (ach
0.20 USD
492.91 M USD
3.99 B USD
About Ambuja Cements Limited
Sector
Industry
CEO
Vinod Mohanlal Bahety
Website
Headquarters
Ahmedabad
Founded
1983
ISIN
US02336R2004
FIGI
BBG000DBNNK2
Ambuja Cements Ltd. is a holding company, which engages in the manufacture and sale of clinkers and cement. Its products include Ambuja Cement, Ambuja Kawach, Ambuja Plus, and Ambuja Cool Walls. The company was founded by Suresh Kumar Neotia and Narotam Satyanarayan Sekhsaria in April 1983 and is headquartered in Ahmedabad, India.
Related stocks
Ambuja Cements – Breakout on Record FY25 Performance📈Technical Analysis
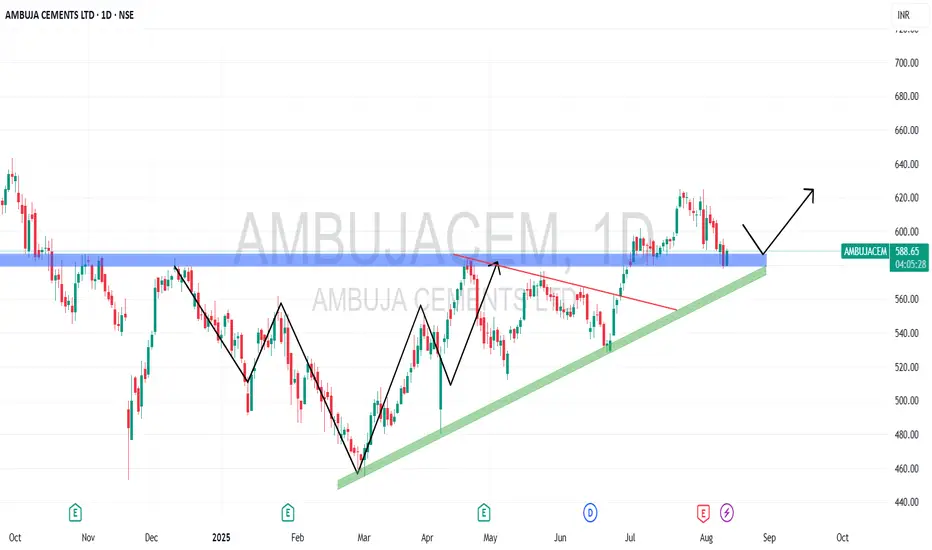
Over the last decade, Ambuja steadily climbed from below ₹50 to peak around ₹700 by mid-2024, before slipping to ₹450.
Since then, it formed higher lows and faced resistance around ₹580. With strong FY25 results, it convincingly broke above ₹580, climbed to ₹620, and is now re
Ambuja Cements – Breakout on Record FY25 Performance📈 Technical Analysis
Over the last decade, Ambuja steadily climbed from below ₹50 to peak around ₹700 by mid-2024, before slipping to ₹450.
Since then, it formed higher lows and faced resistance around ₹580. With strong FY25 results, it convincingly broke above ₹580, climbed to ₹620, and is now r
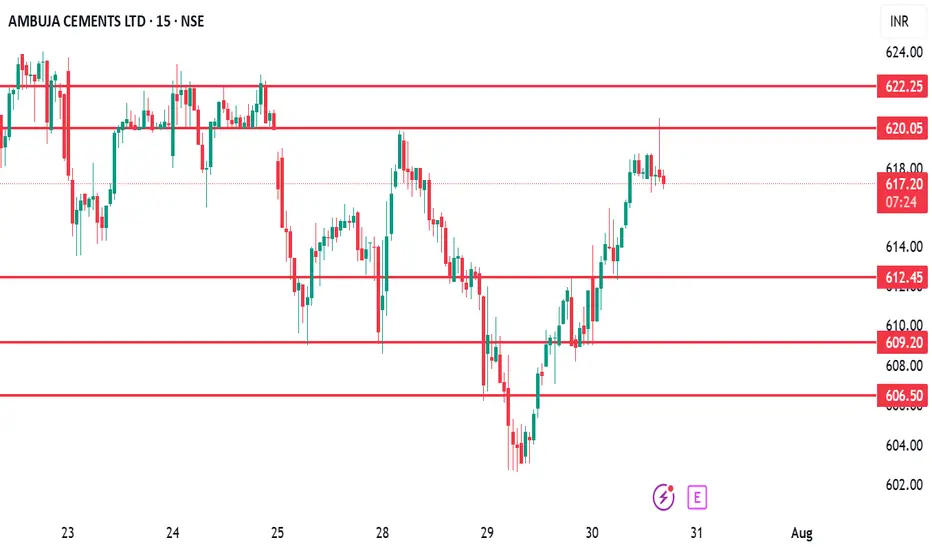
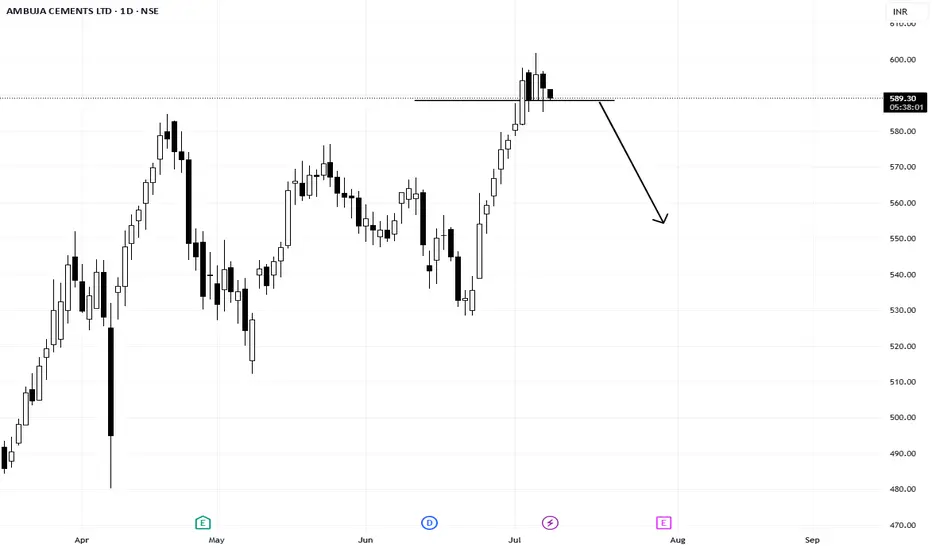
Ambuja Cements – Intraday Short ViewAmbuja Cements is showing signs of weakness on the intraday chart.
I’m expecting a short opportunity with a target of ₹612.50 for today. If the price fails to hold above immediate resistance levels.
View: Bearish (Intraday)
Entry Zone: Around ₹620–₹622
Target: ₹612.50
Ambuja Cem ? going to 680? Ambuja Cement, a top player in the Indian cement space under Adani Group, is showing strength around ₹600 levels, forming a promising base for a potential short-term swing.↳
With rising infrastructure demand, real estate recovery, and government push for housing & roads — Ambuja is cementing long-t

AMBUJACEM Cement At Buying Zone Let's see what will happene nextBuying Zone:
- Clearly marked area where price previously found strong support.
- Acts as a demand zone — buyers tend to step in aggressively when price revisits this region.
Target Zone (Green Area):
- Possibly a previously tested resistance or projection based on Fibonacci or volume profile.
- Su

Ambuja Cements WEEKLY Breakout Setup.. Ambuja Cements is attempting to break out from a long-standing resistance zone around ₹619–₹640. Price action is confined within a rising channel and showing strength despite recent consolidation. The breakout and retest pattern could initiate a fresh leg upward toward the 700+ zone if bulls sustain

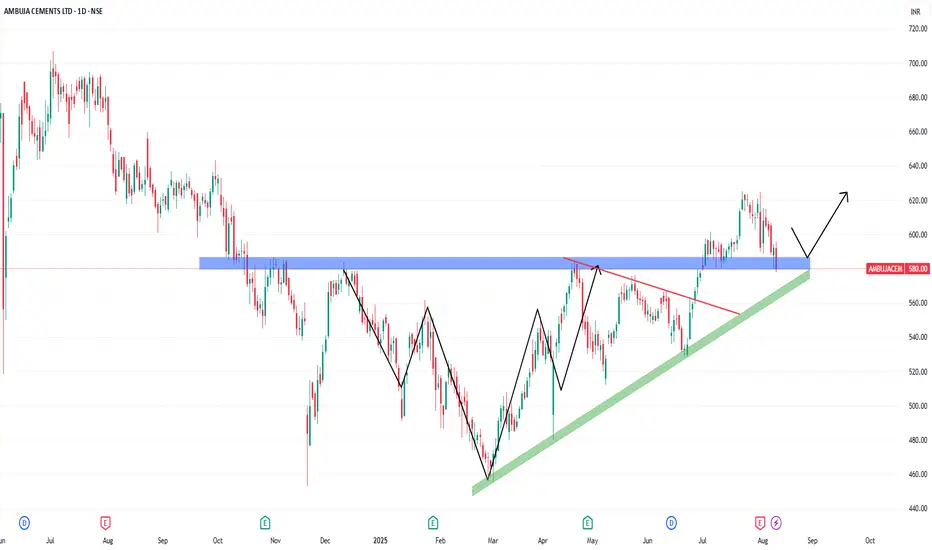
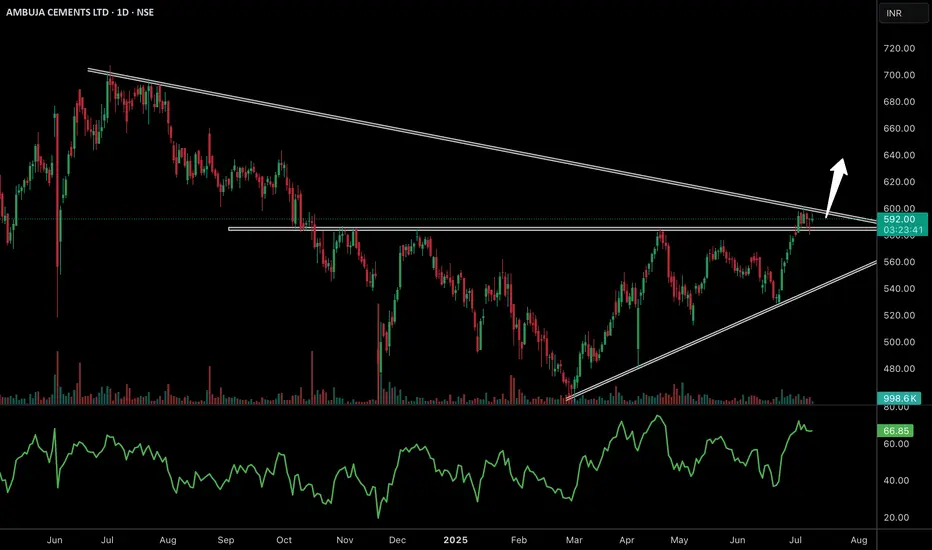
Ambuja Cements Eyeing Breakout From Multi-Month Triangle
✅ Ambuja Cements is trading within a large symmetrical triangle on the daily chart and is now testing the upper trendline near 590–600, a key breakout zone that has acted as resistance multiple times.
✅ The stock is holding well above its previous horizontal resistance around 570, which now acts
[Positional] Ambuja Cements Short IdeaNote -
One of the best forms of Price Action is to not try to predict at all. Instead of that, ACT on the price. So, this chart tells at "where" to act in "what direction. Unless it triggers, like, let's say the candle doesn't break the level which says "Buy if it breaks", You should not buy at all.
Long AMBUJACEMSuperTrend has turned positive on the weekly chart, with the recent closing price trading above the 10 EMA
BUY AMBUJACEM
Entry - 596
SL - 558

See all ideas
Summarizing what the indicators are suggesting.
Oscillators
Neutral
SellBuy
Strong sellStrong buy
Strong sellSellNeutralBuyStrong buy
Oscillators
Neutral
SellBuy
Strong sellStrong buy
Strong sellSellNeutralBuyStrong buy
Summary
Neutral
SellBuy
Strong sellStrong buy
Strong sellSellNeutralBuyStrong buy
Summary
Neutral
SellBuy
Strong sellStrong buy
Strong sellSellNeutralBuyStrong buy
Summary
Neutral
SellBuy
Strong sellStrong buy
Strong sellSellNeutralBuyStrong buy
Moving Averages
Neutral
SellBuy
Strong sellStrong buy
Strong sellSellNeutralBuyStrong buy
Moving Averages
Neutral
SellBuy
Strong sellStrong buy
Strong sellSellNeutralBuyStrong buy
Displays a symbol's price movements over previous years to identify recurring trends.