Wall Street Assignment - Stock 1CIPLA
MACD
Bactested - 14% gains
RSI
Fibonacci
Another way to determine price objectives is by the use of percentage retracements. The most commonly used numbers in retracement analysis are 61.8%, 38%, 50%. In a strong uptrend, the retracement is generally 38% while in a weak uptrend the retracement is about 61.8%.
CIPLA trade ideas

NSE CIPLA: Price Action AnalysisCipla has formed a downtrend channel for two months. Prices are moving below 200 EMA , which indicates a bearish atmosphere. We can see a downtrend channel on the 4-hou r timeframe chart.
Currently, the price has taken support at the lower band of the parallel channel. It has made a range at 938. If the price sustains above 938 , It can touch the upper band of the parallel channel.
Price will make a new low after the breakdown of the parallel channel with heavy supply pressure.
I will Update further information.


Inverted Head And Shoulder in CIPLAInv H&S in daily timeframe
Breakout in 1hr timeframe
Consolidation after breakout in 15min
Trade invalid below 980

CIPLA Shared yesterday and it blasted !!NSE:CIPLA
#NSE:CIPLA shared yesterday and its blasted with 2% result, 9,100 /lot booked and locked in upper circuit.
Wish every one bagged good profits.
Liked our analysis ? Do share your feed back with direct message.
Let LOOT the market together 👍
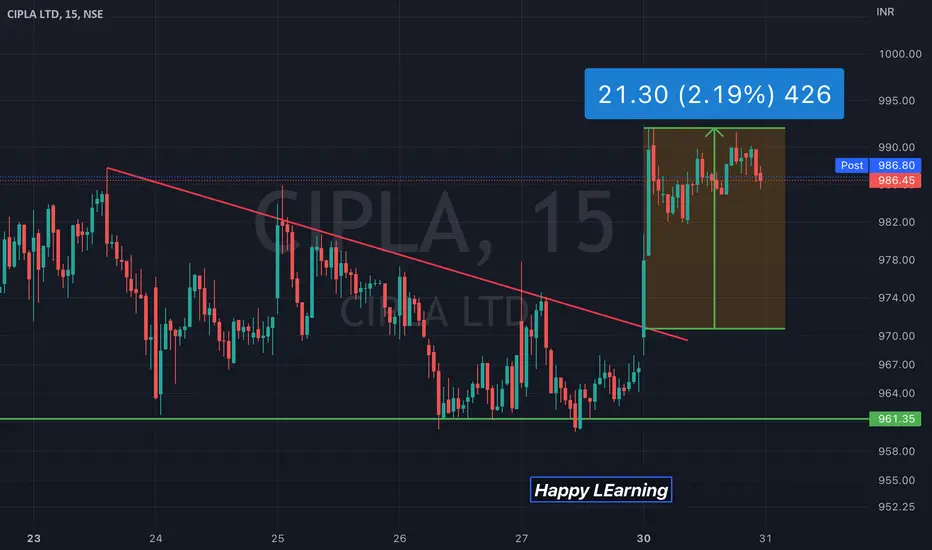
CIPLA descending Triangle !!NSE:CIPLA
#CIPLA Descending triangle, levels marked on chart for practice.
Happy LEarning !!

Price Action - CiplaIf price crosses 960, short with support of 920
If price crosses 990, long with resistance of 1010

Cipla forming a pattern on higher time frame.Cipla has been consolidating in a narrow range and is near a break out of trend line.
The stock is forming a inverted head and shoulder pattern on higher time frame (4 hour).
The moving averages are close and stock has been taking support from its 200 ema.
Support :- 963, 941
Resistance :- 988, 1008
There can be a moving averages bullish cross over.
Wait for the price action near the levels and enter the trade with confirmation.
It can be a swing if a daily candle closes above the trend line.

CIPLA bullish Cipla looked like a bullish movement. Day & weakly closing was taken a strong resistance. So if the price was open above the previous closing price, it reached the price of 1037.75.


Short Cipla below 1016Stock Name: #Cipla
Action: Sell
Entry: 1016
SL: 1027.70
Target: 962.50
NSE:CIPLA

Cipla - 12th May 2022Stock trying to bounce from 900-850 levels
If Levels hold for next few days stock can rally towards 965/990 to start with

RANGE BREAKOUT DONE, READY TO MOVE ?This is daily timeframe.
Cipla was in consolidation in long range for 8+ months.
Finally it gave range breakout and retested its resistance zone,
which is acting as a strong support now.
Selling volume decreased in last three days of last week's.
Today it gave rejection to downtrend and had formed bullish engulfing.
May be now it will give a good upmove.
Let's keep close watch.
This post is for information purpose only.

#Cipla harmonicCipla again near to previous harmonic reversal zone
PRZ -894.85-876.15
SL - 868
CMP:934 @ 7 May 2022

Cipla Share to take long entryExpecting a sharp recovery in Cipla stock. RSI in V form can be seen on daily charts & Re-test can be seen at support level on weekly candles. Good risk to reward ratio. Long entry can be taken above the level of 980 for the target price of 1070 with SL of 945. This is for your educational purpose only.

cipla making cup and handel pattern chance to go up tommorowchance to go up with cup and handel pattern good to go with cipla tommorow

Cilpa Analysis | Weekly ViewCipla is sitting @978.40.
I will be bullish once Resistance was taken out.
If 980.35 was taken out then definetely will coming target soon.
Target 1: 1001.40
Target 2: 1019.65
Target 3: 1036.50

CIPLA LTD | LONG CONSOLIDATION BREAKOUT CIPLA LTD has been trying to break out the 1000 level but has finally given a beautiful breakout above the 1000 level.
The Target price according to the channel low is 1150 but I would suggest here to follow super trend lower band, as I believe that super trend performs well in trending chart patterns.

Buy Cipla if it gives a Fake BreakoutCipla was in a good sideways range and the broke above with momentum. Price then retraced towards the breakout area in a good consolidation and now broke below the consolidation. There is a good opportunity of a bullish trade if price gets back into the above consolidation, thus forming a fake break out.
I would suggest to enter only if 1 Day candle closes inside the prior consolidation (above 1016).

CIPLAStock is hovering above resistance zone since 1 month after breakout from the range. Stock may start upward movement at any time soon. Buy above 1030, SL 980, TGT 1100+. For educational purpose only. Kindly contact your financial advisor before entering any trade.
