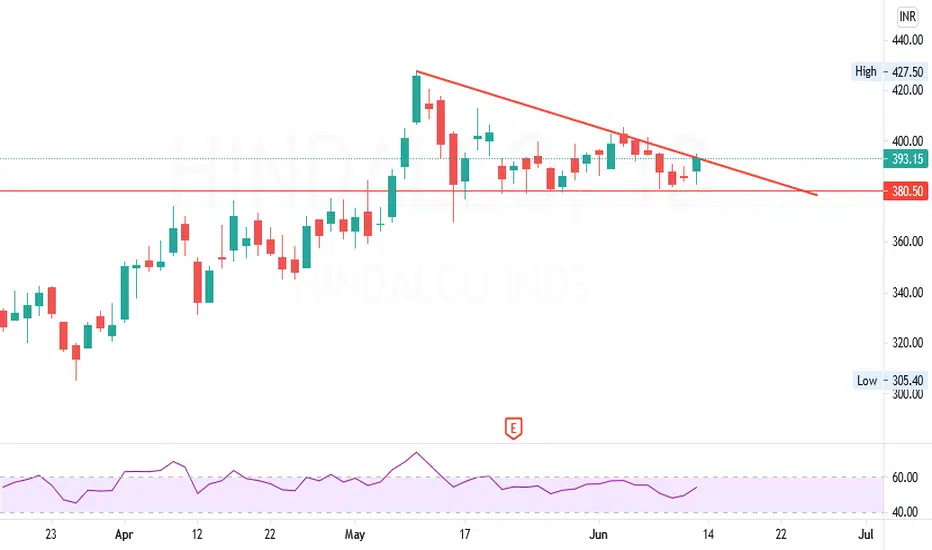
HINDALCO symmetric triangle formation Looks good for a quick option.
Take trade as per the values given in Fibonacci. always trail the stop loss. do your own analysis before taking trade
Check these Upcoming ideas - STILL ACTIVE
Check these successful trades & approach on Britannia , Mothersonsumi , DLF , Biocon , Daawat , Infosys , HBL power , HDFC life , Hind ZINC given below
If you like my analysis do like & follow me as a token of appreciation. If you have any queries on any stock let me know.
Leave a comment that is helpful or encouraging. Let's master the markets together
HINDA trade ideas


Hindlaco NSE:HINDALCO
Hindalco can make a new 52 weeks high in coming days. Looking good for short term.


Hindal co analysisHindal come if it gave break out either upside or down side then find your trade thank you!


Swing Trading using MA and Bollinger bandsHello!!!
i am MBA in Finance and an active trader. I generally do swing trading where one can earn profit in 10-14 days.This is my technical analysis using 50 MA and bollinger bands. The point where both of them coincide is the point where we expect price to go up.
Risk management is very important, one should always be disciplined about stop loss and target . I have taken risk to reward ratio 1:2 but you can take according to you.
Buy = 396
stop loss = 383
Target = 422 (1:2)
- lets share and grow together ;)


THE METAL IS MELTINGHINDALCO AGAIN!! This is the nature of mkt. What goes up comes down also. Wave C has started for sure and price will melt down further. One should place himself accordingly. MUST READ:-This is my observation-not a trading recommendation. Free to use your own method.

Whether Metal Stocks Are About To Blast Again??Swing Trade:
Hindalco chart analysis on 1 hr TF
T: 399++405++425++
-Mohit Rajani

stock analysis: HINDALCOmetal sector is going higher, higher and higher.
present situation is neutral, but it can't stay in a range for long time...
as it gave a good consolidation forming a range and now ascending triangle pattern is visible, so it can start moving higher or if it fails starts moving lower...
the levels are given in the chart
if you have any doubts feel free to comment
do follow and like and subscribe to my "You Tube" channel for more clear understanding...


#Hindalco cash : Make or break level 379-380#Hindalco cash
09.06.2021
Make or break level is 379-380
Sell only below 379
stoploss 386
Target 368-371/352
Cmp 383.15

Breakout confirmationfollow level on chart with long stop loss
time duration 5 to 9 days
NSE:HINDALCO

