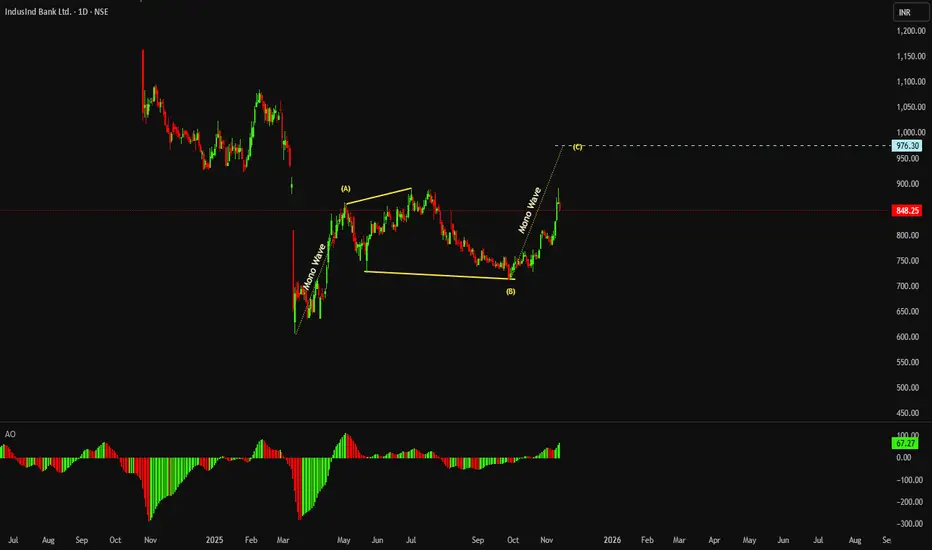
Mono Wave In This Chart Pattern Example I have Visually Represented Mono Wave identification
Friends its Important to note the behavior of Price along the side of its movement is
important , as a single strong move on daily suggest the movement is Mono Wave or Representation of fast displacement of price
−0.10 USD
304.63 M USD
6.67 B USD
About IndusInd Bank Ltd.
Sector
Industry
CEO
Rajiv Anand
Website
Headquarters
Pune
Founded
1994
ISIN
US4557861030
FIGI
BBG000KG3PX6
IndusInd Bank Ltd. engages in the provision of banking services. It operates through the following segments: Treasury, Corporate and Wholesale Banking, Retail Banking, Other Banking Operations and Unallocated. The Treasury segment refers to all investment portfolios, profit, loss on sale of investments; profit and loss on foreign exchange transactions, equities, income from derivatives and money market operations. The Corporate and Wholesale Banking segment includes lending to and deposits from corporate customers. The Retail Banking segment includes lending to and deposits from retail customers. The Other Banking Operations segment comprises all other operations not covered under other segment. The Unallocated segment includes capital and reserves, employee stock options outstanding and other unallocable assets, liabilities, income and expenses. The company was founded by Srichand P. Hinduja in January 31, 1994 and is headquartered in Mumbai, India.
Related stocks
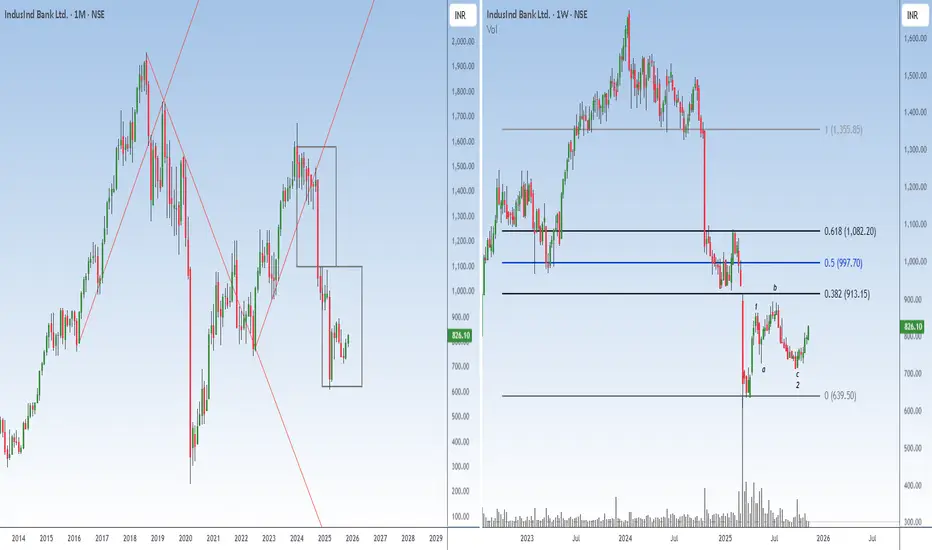
One can average this counterIndusind Bank CMP 826
Elliott - the box method is telling the the correction got over at 600. The rally post that has five waves hence this dip becomes an opportunity to buy.
Volume - the stock did not bottom at high volume. It made several small narrow range candles with volume total drying a
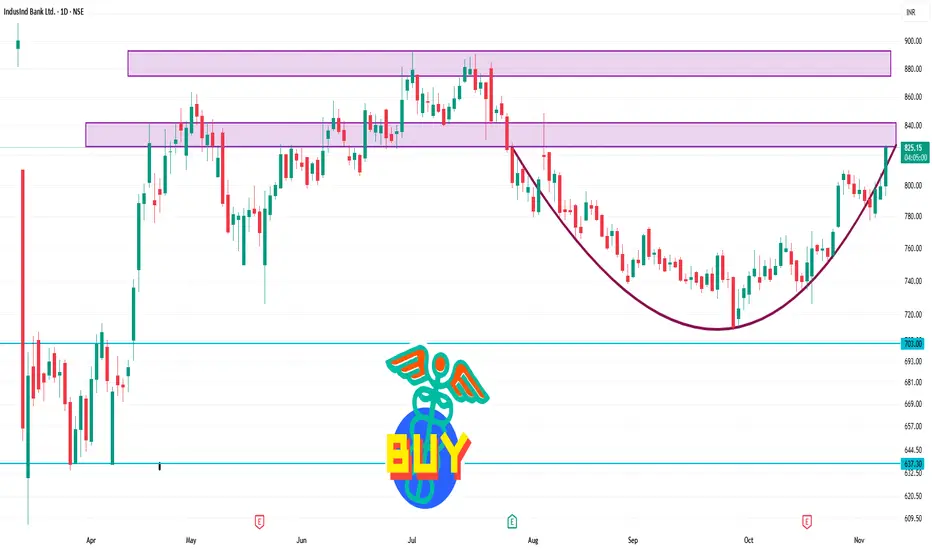
INDUSINDBK 1 Day Time Frame Level 🔍 Current snapshot
Latest live price: ~ ₹825.00.
Today’s approximate range: Low ~ ₹792.80, High ~ ₹826.00.
52-week range: Low ~ ₹606.00, High ~ ₹1,086.55.
📈 Key support & resistance levels
Support zone: ~ ₹790-₹800 — because price has held above ~₹792 today and that region shows earlier low of
Introduction to Indian Financial Markets1. Structure of Indian Financial Markets
The Indian financial market is broadly divided into two segments:
Money Market – Deals with short-term funds (maturity up to one year).
Capital Market – Deals with long-term funds (maturity more than one year).
Each of these segments has multiple sub-mark
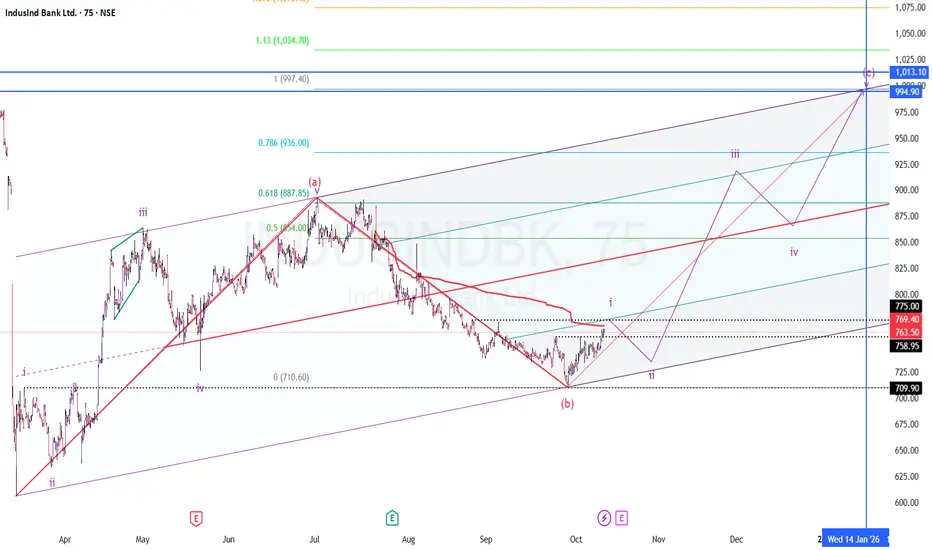
INDUSINDBK - Bullish for 1000?
TF: 75 minutes
CMP: 763.5
The script looks to be in the corrective rise ABC from the March lows.
It has now completed A and B, the C is expected to move higher beyond 890, potentially reaching the 990-1000 mark.
I have marked the internal counts for better understanding.
Breakout above 775 will
IndusInd Bank BearishNamaskaram Everyone
I trade using Neowave and on that I have created an trading setup, which is kind of automatic entry and exit with Neowave.
Neowave is kind of a method in which you synchronize all the price action across all the time frames. It hides all the noise and tells you market is bullis

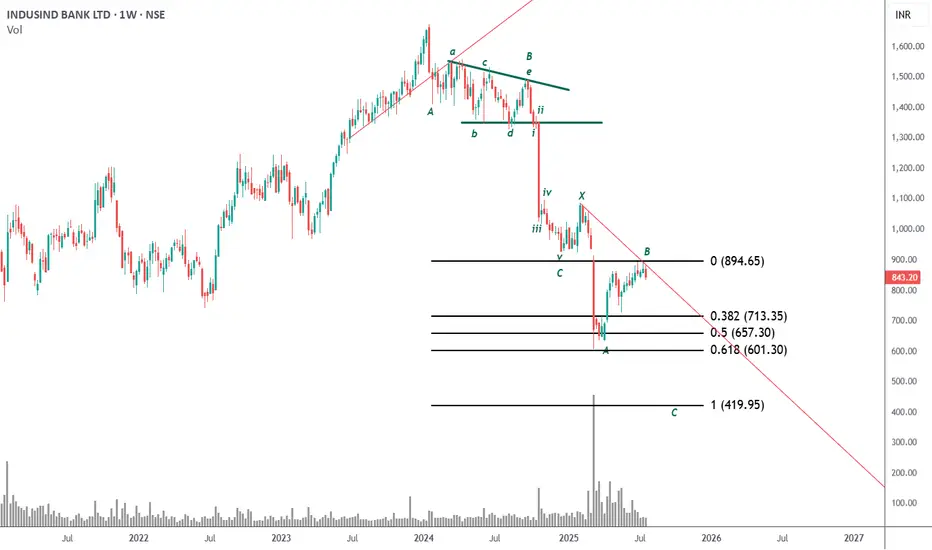
The correction has resumedIndusind Bank CMP 843.20
Elliott- this is a double zig zag formation. The C wave of the second zig zag has now started. The minimum tgt for the same is 420.
Volume - A stock never bottoms on heavy volume. this rally has to sold as a deeper correction is on the way.
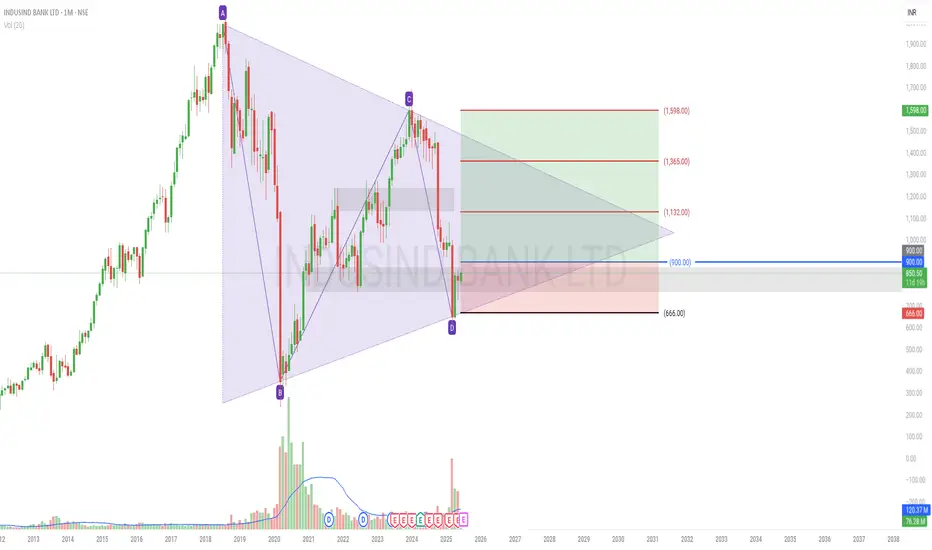
INDUSINDBK – Symmetrical Chart Pattern Break & Reclaim Setup🟣 NSE:INDUSINDBK – Symmetrical Chart Pattern Break & Reclaim Setup
A multi-year symmetrical triangle has been forming on the monthly chart and recently saw a break below lower support.
Interestingly, volume spiked around the breakdown — often signaling a potential shakeout or false breakdown.
T
We Make You Feel RicherIndusInd Bank Ltd -
CMP - 851.50
About
IndusInd Bank Limited was incorporated in 1994 as a commercial bank under the Banking Regulation Act, 1949. The Bank is publicly held and provides a wide range of banking products and financial services to corporate and retail clients besides undertaking tre

INDUSIND BANK LTD Bullish on INDUSIND BANK
Trade Setup:
This is a positional breakout trade with a favorable risk-reward ratio. The structure indicates potential for a move toward *855 initially, with ₹900+ as a stretch target if momentum sustains.
✰ Entry Zone: On a breakout above 780-7785
Target Zone: *855 / 900+

See all ideas
Summarizing what the indicators are suggesting.
Oscillators
Neutral
SellBuy
Strong sellStrong buy
Strong sellSellNeutralBuyStrong buy
Oscillators
Neutral
SellBuy
Strong sellStrong buy
Strong sellSellNeutralBuyStrong buy
Summary
Neutral
SellBuy
Strong sellStrong buy
Strong sellSellNeutralBuyStrong buy
Summary
Neutral
SellBuy
Strong sellStrong buy
Strong sellSellNeutralBuyStrong buy
Summary
Neutral
SellBuy
Strong sellStrong buy
Strong sellSellNeutralBuyStrong buy
Moving Averages
Neutral
SellBuy
Strong sellStrong buy
Strong sellSellNeutralBuyStrong buy
Moving Averages
Neutral
SellBuy
Strong sellStrong buy
Strong sellSellNeutralBuyStrong buy
Displays a symbol's price movements over previous years to identify recurring trends.