IndusInd Bank BearishNamaskaram Everyone
I trade using Neowave and on that I have created an trading setup, which is kind of automatic entry and exit with Neowave.
Neowave is kind of a method in which you synchronize all the price action across all the time frames. It hides all the noise and tells you market is bullish or bearish.
About Stock
This is not a trading Idea, just a structural update for someone who is thinking to invest.
Creating Nifty 50 Neowave Charts Library for all of you, Like and share is appreciated if you like our work.
Thank You
To understand how our coding works read the below post-
NSE:INDUSINDBK
IDUSB trade ideas

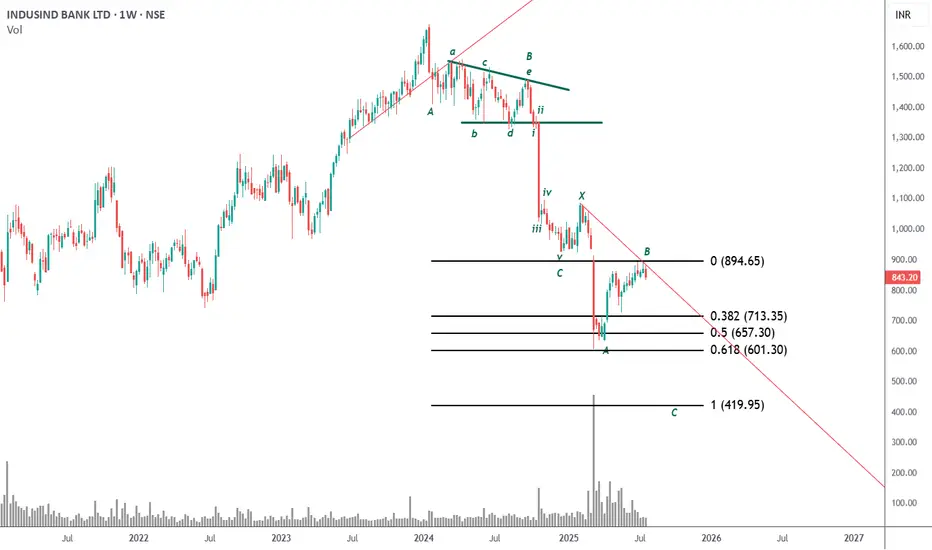
The correction has resumedIndusind Bank CMP 843.20
Elliott- this is a double zig zag formation. The C wave of the second zig zag has now started. The minimum tgt for the same is 420.
Volume - A stock never bottoms on heavy volume. this rally has to sold as a deeper correction is on the way.
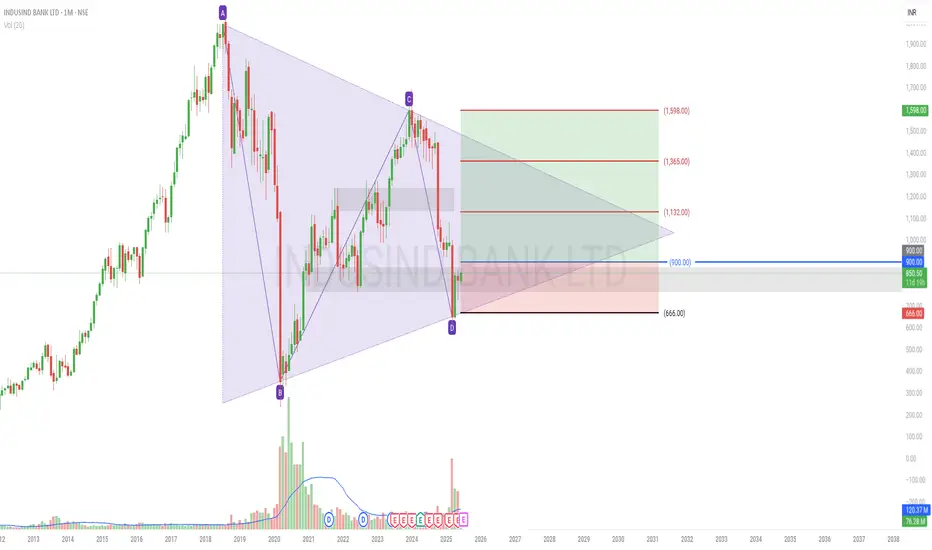
INDUSINDBK – Symmetrical Chart Pattern Break & Reclaim Setup🟣 NSE:INDUSINDBK – Symmetrical Chart Pattern Break & Reclaim Setup
A multi-year symmetrical triangle has been forming on the monthly chart and recently saw a break below lower support.
Interestingly, volume spiked around the breakdown — often signaling a potential shakeout or false breakdown.
The breakdown zone around ₹900 is now acting as resistance. If price reclaims this zone, a strong bullish breakout structure may develop.
Currently, the price is around ₹850 — watching for confirmation above ₹900 for entry.
• Timeframe: Monthly
• Pattern: Symmetrical Triangle
• Outlook: Positional / 6–12 Months
• Plan of Action:
Entry: ₹900+ (on confirmation)
Stop-Loss: ₹666 (swing low / pattern invalidation)
Target 1: ₹1,132
Target 2: ₹1,365
Target 3: ₹1,598
• Why This Setup Stands Out:
Clean symmetrical triangle respected over time
Volume spike at key zone suggests potential smart money activity
₹900 is both technical resistance and a psychological level
Well-defined R:R with multi-target structure
Note: This is a positional idea — enter only on price strength above ₹900. Stay patient if below resistance.
"Trade the reclaim, not the breakdown trap."
Information shared is for educational purposes only.
We Make You Feel RicherIndusInd Bank Ltd -
CMP - 851.50
About
IndusInd Bank Limited was incorporated in 1994 as a commercial bank under the Banking Regulation Act, 1949. The Bank is publicly held and provides a wide range of banking products and financial services to corporate and retail clients besides undertaking treasury operations. The Bank operates in India including at the International Financial Service Centres in India.
This is just to boost my confidence. No Suggestions for buying. I will keep checking and updating my mistake if last post gone wrong...
Disclosure: I am not SEBI registered. The information provided here is for educational purposes only. I will not be responsible for any of your profit/loss with these suggestions. Consult your financial Adviser before making any decisions.

INDUSIND BANK LTD Bullish on INDUSIND BANK
Trade Setup:
This is a positional breakout trade with a favorable risk-reward ratio. The structure indicates potential for a move toward *855 initially, with ₹900+ as a stretch target if momentum sustains.
✰ Entry Zone: On a breakout above 780-7785
Target Zone: *855 / 900+
✰ Stop Loss: *745 (on daily close basis)
Disclaimer: This is not investment advice. Please do your own research or consult with your financial advisor before making trading decisions.

Bullish on INDUSIND BANK📝 Trade Setup:
This is a positional breakout trade with a favorable risk-reward ratio. The structure indicates potential for a move toward ₹855 initially, with ₹900+ as a stretch target if momentum sustains.
📌 Entry Zone: On a breakout above ₹780–₹785
📌 Target Zone: ₹855 / ₹900+
📌 Stop Loss: ₹745 (on daily close basis)
📍 Disclaimer: This is not investment advice. Please do your own research or consult with your financial advisor before making trading decisions.

INDUSIND Bank // 1month Support and ResistanceAs of May 5, 2025, here are the key 1-Month Support and Resistance levels for IndusInd Bank Ltd. (NSE: INDUSINDBK) based on recent technical analyses:
📊 Monthly Support and Resistance Levels
Level Value (₹)
S3 809.77
S2 888.08
S1 941.97
Pivot 1,015.58
R1 1,074.17
R2 1,152.48
R3 1,206.37
These levels are derived from the previous month's price range and are commonly used to identify potential reversal points in the market.
📈 Technical Indicators
Relative Strength Index (RSI): 44 (Neutral)
Moving Average Convergence Divergence (MACD): 5.16 (Sell)
Average Directional Index (ADX): 25.44 (Weak Trend)
Commodity Channel Index (CCI): -61.09 (Downtrend)
Money Flow Index (MFI): 26.16 (Strong Downtrend)
These indicators suggest a neutral to slightly bearish momentum, indicating potential downward movement if selling pressure increases.
📌 Summary
Immediate Support: ₹809.77
Immediate Resistance: ₹1,074.17
Medium-Term Outlook: Neutral to slightly bearish, with mixed signals from moving averages and momentum indicators.
Please note that technical analysis is subject to change based on market conditions. It's advisable to monitor these levels regularly and consider consulting with a financial advisor for personalized investment advice.

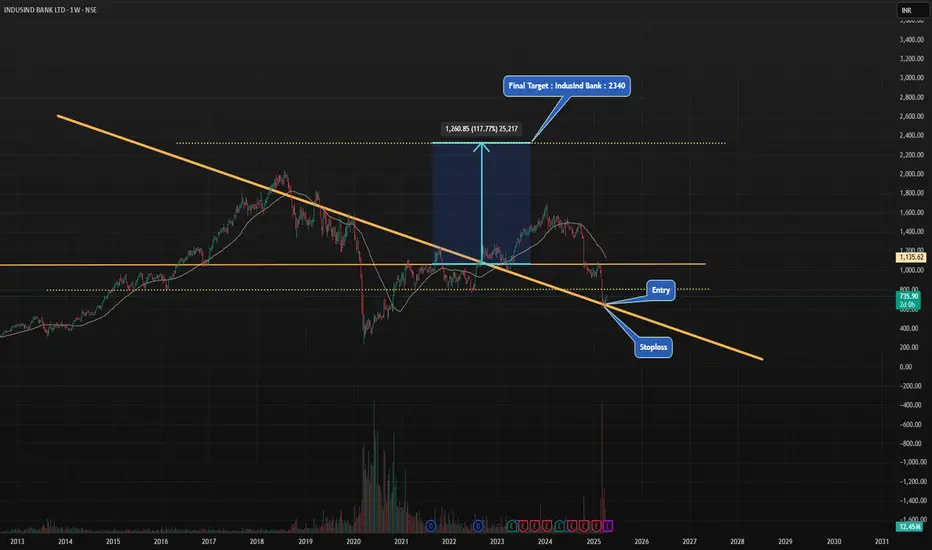
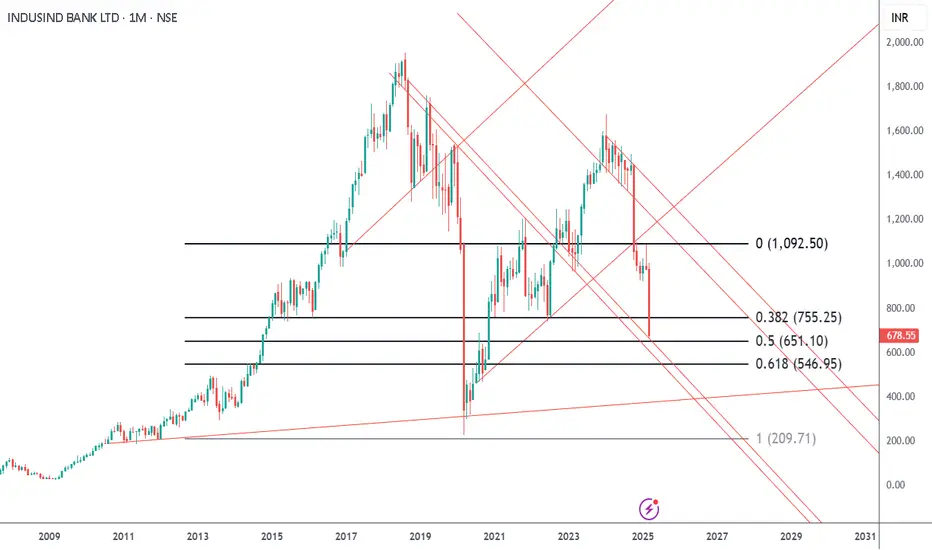
IndusInd Bank : 177% possible upside in 2 YearsHi All,
Targets, Stoploss & Entry are mentioned in the chart .
Please feel free to share your views regarding this chart & analysis .
Note : I am not a SEBI registered advisor . Please consider my analysis only for Education purpose .
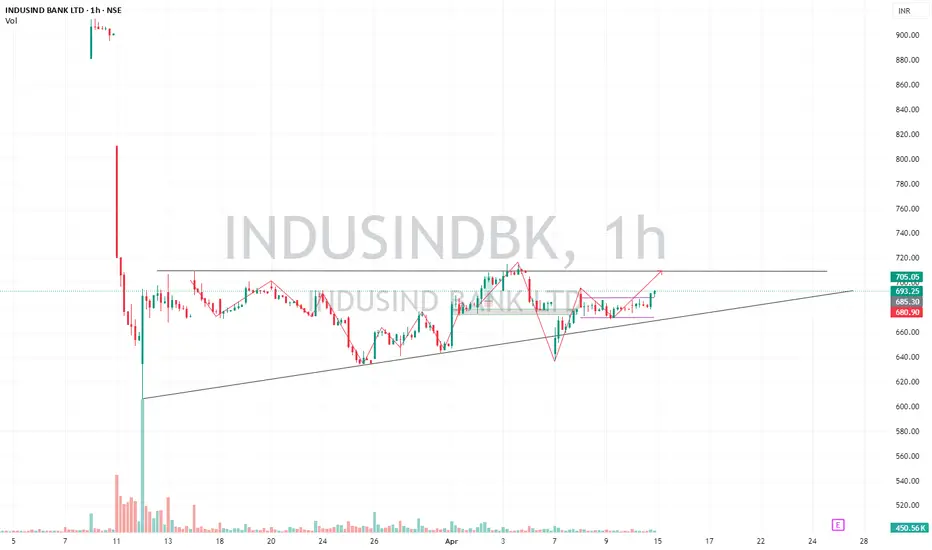
INDUSINDBK-Intraday/short term positional After the big fall, stock is consolidating from last month.
It has formed Ascending tringle pattern. From past 2 days i.e. 8th and 9th April 2025. It is trading in range. which states that buyers are accumulating.
It has potential to move if it opens between 692-700. It may go sideways for one more day it is a good opportunity for Long Intraday/short term positional trade.
If it opens 666, avoid.
Any confusion, feel free to drop msg. Happy to help :)
This is only for educational purpose, please manage your risk accordingly.
Should we be afraid of this stock market crash Should we be afraid of this stock market crash or see it as an opportunity ?

indusnd bank bullish view from herePls Note Important
level 588 (50 Cham Mahi level EMA ).....6month
level 584 (100 Tee Mahi ka EMA)......3 months
SL 570
Wait till target price achieved

INDUSIND BANK WEAK TREND NEXT 630-INDUSIND BANK WEAK TREND NEXT 630-
₹606 (low) to ₹1,576.35 (high), indicating
P/E Ratio: 7.2, which is below the industry median, suggesting undervaluation

Indus Ind Bank: Support tested.Indus Ind Bank: The support is at 660 which has been tested today. The last and final support is at 460, which is unlikely to be tested. One may go long after watching a couple of days if the support at 660 holds.

IndusIndBank....Gann Analysis Weekly chart...20 March 2025Today we start Gann New year with Spring Equinox at 2:31 pm IST.
"Looking at IndusInd Bank in the Mirror."
We see ATH on it in 30 July 2018 at 2038.00 on weekly chart.Swing Low came in 23 March 2020 at 235.55. Losing 88.44% of its value in 86 weeks. If we add the 86 weeks to the swing low we get 15 Nov 2021. We got a high of 1240 in 01 Nov 2012 week. That was the sweetest part of the recovery back then. Using the same time period we come to 26 June 2023 and we are at 1318. Again 86 weeks ahead time is 17 Feb 2025 and were at 1055. Then we get the news and crash. Gann Analysis calls it Time squaring. In Gann Theory Time is more important than Price. It was proved here as we needed to be cautious as it was third lower high using the time squaring technique. Highs were 1240/1318/1050.Below 1000 the price vibration changes from 4 to 3 figure where mass psychology also changes. It will be interesting to watch next time period date on it on 12 Oct 2026. Pricewise we need to stay above 706.65. Short term time period to watch will be 11 Oct 2025. Drop to 471.10 if it comes will be interesting to watch.

IndusInd Bank Plunges on Accounting ConcernsTopic Statement:
IndusInd Bank has faced a massive selloff following accounting discrepancies in its derivatives portfolio, pushing the stock into oversold territory.
Key points:
- Stock has broken the 61.8% retracement level, indicating the selling pressure may continue until a full 100% retracement towards Rs 243.
- Price has overextended below the 180-day EMA, making the stock oversold.
- MFI on the weekly chart is at 20, denoting highly oversold conditions.

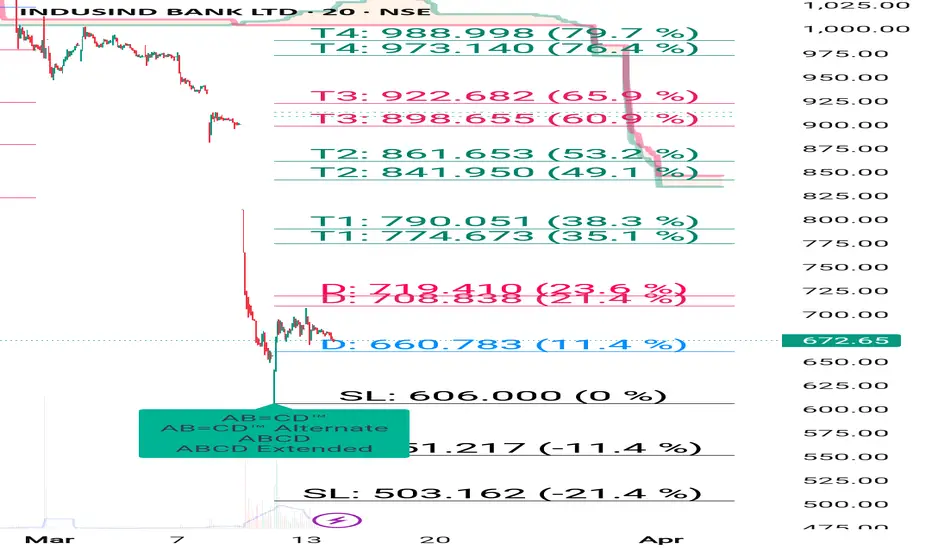
Indusind bank as said earlier until 720 not break sell on rise How to take trades using Harmonic pattern projection Trade setup is explained below :-
Entry : 1st SL point : 0% is recent top or bottom.
Trailing D: 11.4% is work as trailing SL of buy or sell trade if hit then we have to book profit
.If price goes below 2nd D 21.4% to 23.6% range then early traders can make fresh reversals trade after breaking 1st D 11.4% safe traders can reversal trade after breaking Point D 21.4% to 23.6% range
Targets :
Target T1 : 35.1% to 38.3%
Target T3 : 49.1% to 53.2%
T3: 60.9% to 64.8% is our 3rd Target since this is reversal zone so must book profit if break then take fresh trade again
Target T4 : 76.4% to 79.7%
Next Targets are 100% , 127.2% ,141.4% and final Target 161.8%.
How to take reversal trade :
If price going upside/ downside then then buy or sell levels appear on Chart ( Automatically show when price reach any reversal zone of harmonic projection pattern based .
After showing reversal levels wait for confirmation until 21.4% or 28.3 % level not break if break then exit from current buy / sell trade and take fresh reverse trade buy/ sell .
Trailing SL:
After reach 1st Target trail SL to just above or below cost ( for example we are holding sell trade from 100 1st Target 110 hit then move trailing sl to 104-105 and move SL as price move upside or Downside)
Re- Entry :
For Re-entry in any pull back Point D ( 11.4% ) is used for re-entry then SL recent high or low Point SL ( 0% ) .
Blue Line is 1st support/ Resistance
Green line is 2nd support/ resistance
Red line is 3rd Support/ resistance

Indusind bank updated levels until 720 not break fall continue How to take trades using Harmonic pattern projection Trade setup is explained below :-
Entry : 1st SL point : 0% is recent top or bottom.
Trailing D: 11.4% is work as trailing SL of buy or sell trade if hit then we have to book profit
.If price goes below 2nd D 21.4% to 23.6% range then early traders can make fresh reversals trade after breaking 1st D 11.4% safe traders can reversal trade after breaking Point D 21.4% to 23.6% range
Targets :
Target T1 : 35.1% to 38.3%
Target T3 : 49.1% to 53.2%
T3: 60.9% to 64.8% is our 3rd Target since this is reversal zone so must book profit if break then take fresh trade again
Target T4 : 76.4% to 79.7%
Next Targets are 100% , 127.2% ,141.4% and final Target 161.8%.
How to take reversal trade :
If price going upside/ downside then then buy or sell levels appear on Chart ( Automatically show when price reach any reversal zone of harmonic projection pattern based .
After showing reversal levels wait for confirmation until 21.4% or 28.3 % level not break if break then exit from current buy / sell trade and take fresh reverse trade buy/ sell .
Trailing SL:
After reach 1st Target trail SL to just above or below cost ( for example we are holding sell trade from 100 1st Target 110 hit then move trailing sl to 104-105 and move SL as price move upside or Downside)
Re- Entry :
For Re-entry in any pull back Point D ( 11.4% ) is used for re-entry then SL recent high or low Point SL ( 0% ) .
Blue Line is 1st support/ Resistance
Green line is 2nd support/ resistance
Red line is 3rd Support/ resistance
INDUSINDBK📉 INDUSINDBK Update 📉
🔹 As long as it's trading below 700-706 (Fib zone), the downside target of 577-570 remains open.
🔹 Any fake out move toward 731 can be a good opportunity to short. 🚀🔻

INDUSIND bank achieves C=A Elliott Waves on weekly chartsINDUSIND bank fell hard and quickly exceeded the point where C=A. It also touched the longer term channel line near 650. Time will tell if this channel holds out as a good support.

Indusind bank updated levels until 700 not break avoid buyHow to take trades using Harmonic pattern projection Trade setup is explained below :-
Entry : 1st SL point : 0% is recent top or bottom.
Trailing D: 11.4% is work as trailing SL of buy or sell trade if hit then we have to book profit
.If price goes below 2nd D 21.4% to 23.6% range then early traders can make fresh reversals trade after breaking 1st D 11.4% safe traders can reversal trade after breaking Point D 21.4% to 23.6% range
Targets :
Target T1 : 35.1% to 38.3%
Target T3 : 49.1% to 53.2%
T3: 60.9% to 64.8% is our 3rd Target since this is reversal zone so must book profit if break then take fresh trade again
Target T4 : 76.4% to 79.7%
Next Targets are 100% , 127.2% ,141.4% and final Target 161.8%.
How to take reversal trade :
If price going upside/ downside then then buy or sell levels appear on Chart ( Automatically show when price reach any reversal zone of harmonic projection pattern based .
After showing reversal levels wait for confirmation until 21.4% or 28.3 % level not break if break then exit from current buy / sell trade and take fresh reverse trade buy/ sell .
Trailing SL:
After reach 1st Target trail SL to just above or below cost ( for example we are holding sell trade from 100 1st Target 110 hit then move trailing sl to 104-105 and move SL as price move upside or Downside)
Re- Entry :
For Re-entry in any pull back Point D ( 11.4% ) is used for re-entry then SL recent high or low Point SL ( 0% ) .
Blue Line is 1st support/ Resistance
Green line is 2nd support/ resistance
Red line is 3rd Support/ resistance

Indusind Bank @ 655Indusind Bank @ 655
Support zone: 663-603-547. Max extension on the downside can be 401. But I don't think, it will go till that. I expect a strong reversal from the support zone.
I expect reversal from this zone towards 1000/1400+.
Base support 234.
Let us wait and watch.
Thanks.

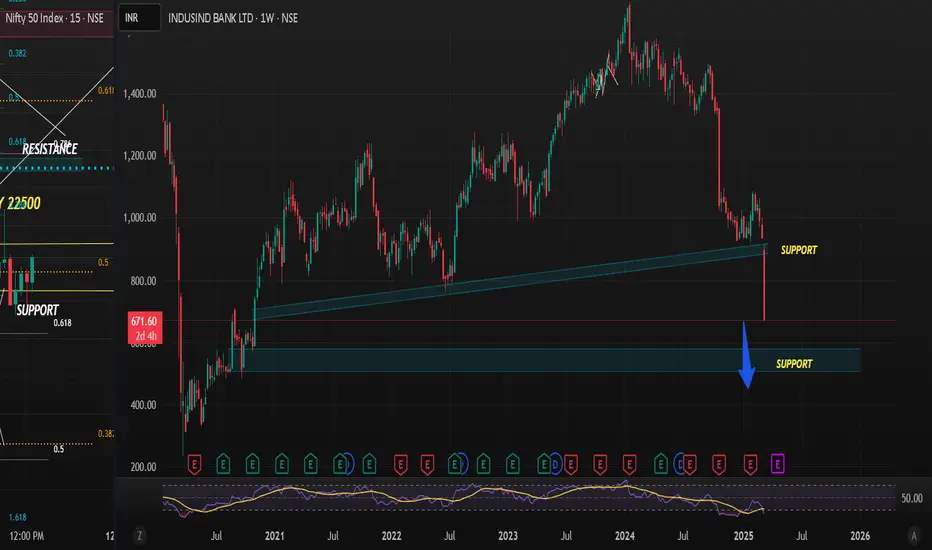
Around supportIndusind Bank CMP 669
The stock is down to trendline along with Fib support. In my view the steep fall should halt around this zone. Overall the trend is very weak , and one should not look at bottom fishing in this counter. Use the rallies to exit this counter.
SWING OBSERVATION - INDUSIND BANK
Script in huge down momentum after breaking important support levels around 800 . May test major supports around 539. A retracement is due for testing (good entry)