Belong AnywhereABNB - CMP - 140.64
This is just to boost my confidence. No Suggestions for buying. I will keep checking and updating my mistake if last post gone wrong...
Disclosure: I am not SEBI registered. The information provided here is for educational purposes only. I will not be responsible for any of your profit/loss with these suggestions. Consult your financial Adviser before making any decisions.
Trade ideas

ready to expand AIRBNB (NASDAQ)Stock Chart Analysis for Airbnb, Inc. (NASDAQ: ABNB) on a Monthly Timeframe
Relative Strength Index (RSI)
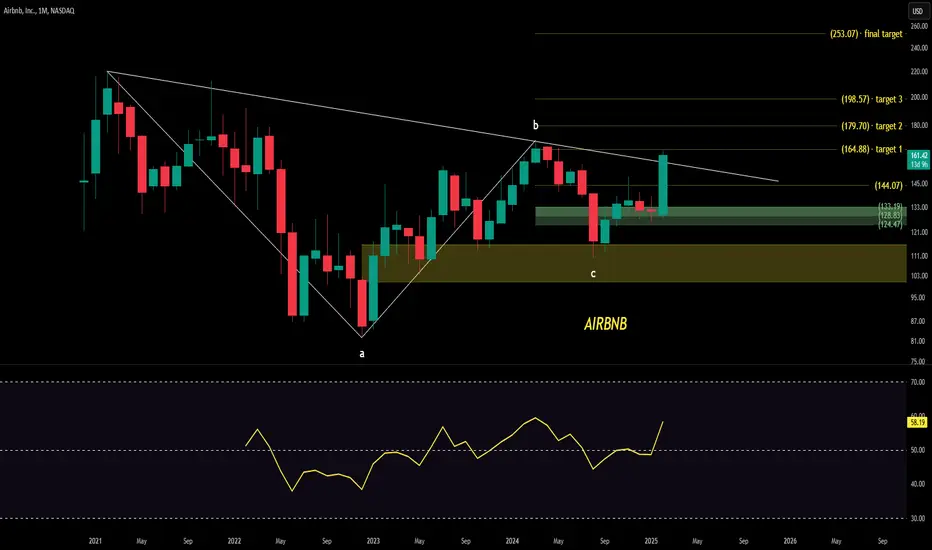
RSI Value: 58.19
Interpretation: The RSI indicates that the stock is in a neutral to slightly bullish territory. RSI values above 70 indicate an overbought condition, while values below 30 indicate an oversold condition. With a current RSI of 58.19, the stock is neither overbought nor oversold.
Volume
Recent Volume: 67.42 million
Interpretation: The recent increase in volume suggests strong buying interest and higher trading activity. A significant increase in volume often indicates strong investor interest and can signal the strength of price movements.
Key Support and Resistance Levels
Support Levels:
124.47 USD
128.83 USD
133.19 USD
Targets Levels:
144.07 USD
164.88 USD (Target 1)
179.70 USD (Target 2)
198.57 USD (Target 3)
253.07 USD (Final Target)
Trend Analysis
Trendline: The chart shows a descending triangle pattern with a breakout above the upper trend line.
Candlestick Patterns: The recent candlestick shows a significant upward movement with increased volume, indicating strong bullish momentum.
Summary
The stock has recently broken above several resistance levels and is approaching the next resistance at 144.07 USD. The RSI value suggests a neutral to slightly bullish stance, and the increase in volume indicates strong investor interest. The breakout above the descending trendline indicates a potential reversal of the previous downtrend.
Disclaimer: This analysis is for informational purposes only and should not be considered as financial advice. I am not a SEBI registered analyst. Please consult with a certified financial advisor before making any investment decisions.
ABNB bullish on larger time framesSeems bullish and maybe undervalued, earnings coming up, Weekly and Monthly charts looking solid. A good one to watch imo

ABNB on a very deciding positionABNB has seen a rapid fall in the recent past.
Currently, the price is taking support from the 61.8% of fib level which also happens to coincide with a strong Order Block.
On the hind side the price is trading below 200 EMA on all the timeframes starting from 4 hours, it is to be noted that the price has taken support from 200 EMA of the daily timeframe.
It will be fun to see as to who wins the tug-of-war this week, lets sit tight and enjoy the show.

Update on AIRBNB SwingLong Swing trade violated on AIRBNB
1) You will be able to see AIRBNB was very bullish as marked on the chart.
2) But suddenly market gap down and violated the trade because there no potential reason for stock to gap down but it did which tells it wants to discontinue to its push to the market.
3) In this situation it shows the importance of having good risk management. Because are uncertain.
Good management is the key situation in the market

Airbnb To Reach $150?1) Weekly & Daily Timeframe is Bullish
2) After Long Consolidation Daily and 4HR has shifted the structure to bullishness

Sunday Prep 11/07 - $ABNB Big Beat on EarningsBig beat on earnings last week and we got a beautiful daily candle on the name. Will be watching for a weak open to start and hold around 194-195. You have a monthly pivot in there as well as about a 50% retrace of the daily candle. Ideally this doesn’t give back more than ½ of Friday if it’s going to remain strong.

AIRBNB analysis As world is opening up and travel is also happening so in my view AIRBNB seems much more powerful for short term as well as long term. by every earning on QOQ...stock will maintain its trend. If you get opprtunity to buy in fresh zone then go for it. good stock as per current theme of of traveling

Sunday Prep 9/26 - $ABNB Looking for a Pullback to 20D SMAAirbnb probably wont be a Monday trade. This feels more like a Tues, Wed, maybe even Thurs trade. I want to see this find near-tern resistance right here before looking for a pull back. I want to be buying this as close to the 20d SMA as possible on a pull-back.

ABNB Price levelsConsolidating nicely
Break above 154.80 with first targets 162.30, 173
* This is my view only. Not advising to buy or sell depending on this


