XNGUSD — Bottom or Reaction? Structure FirstNatural Gas has reacted sharply from a high-confluence support zone, but structure remains corrective, not impulsive.
What just happened:
• Price tagged the 0.707–0.786 retracement (2.67–2.38)
• Confluence with rising trendline
• Immediate rejection → active demand confirmed
What this means:
✔️ Va

XNG outlookBreak of structure of internal highs , Monthly demand has been tapped . Also , price has tapped into the higher time frame discounted zone from the fibonacci retracement tool
trade idea gives a 3.7 RRR , good zone to go long

NG : Raising wedge breakdown• NG was trading in a wedge from Jan-2023.
• The wedge is clearly broken on 9th Jan
• Retest of the wedge is completed on14th Jan.
• SL and Target are mentioned in the chart.
• RR is 1:4.
• Educational purpose only. Happy learning
NatGas LongCurrent Price: 3.557, immediate support and SL 3.498 , long with a target of 3.75, and trailing it to 3.9 4.091 and so on. For short positions enter after support 3 break and take support 2 as SL , tgt would be kept at 3.25.

Long may be possible Expect this but need patient to follow the Trend. Pattern look like trying to make higher lower and Trent will be broken sooner.
See the trend movement carefully

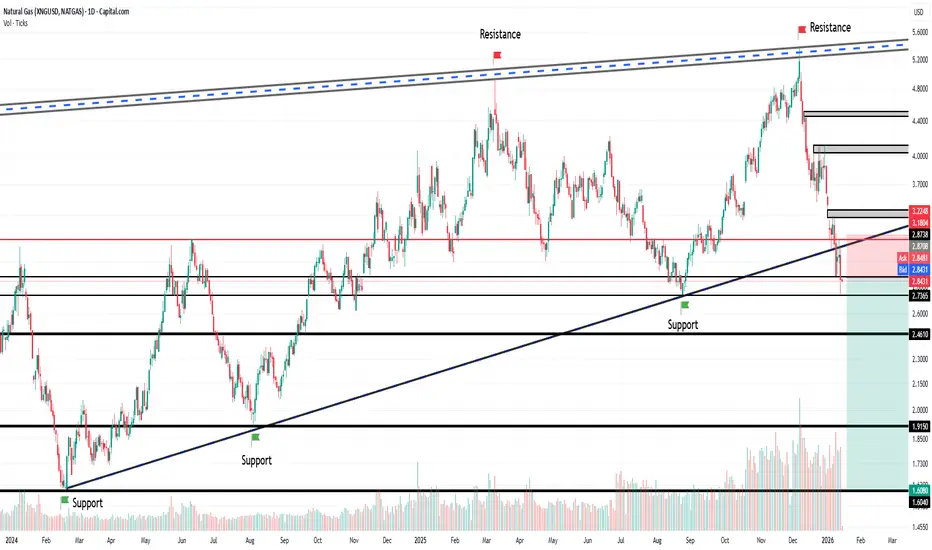
Natural Gas (XNGUSD) AnalysisNatural Gas (XNGUSD) Analysis
On the daily chart, NG witnessed an aggressive sell-off from the highs made during early November
Although prices are now testing a long-term support base (blue ascending trendline) and have failed to close below the trendline.
A Classic Bullish Divergence has also be

NATURAL GAS BEARISHNATURAL GAS bearish set up according 4hr tf price action
it's brake weekly channel pattern also retest chaneel pattern and move to down side

XNGUSD At Good Demand Zone Hello Friends 👋 XNGUSD - Now Sustain At Good Demand Zone.If You Are Looking Up Side This Could Be A Good Opportunity For You📊

NGAS (Natural Gas) – Technical Analysis | 2HFX:NGAS
Channel support line hit: Price has reacted exactly from the lower boundary of the falling channel, indicating structural support is respected.
New low not aggressive : The recent breakdown didn’t show strong momentum or expansion in range → signs of selling exhaustion, not panic.
De

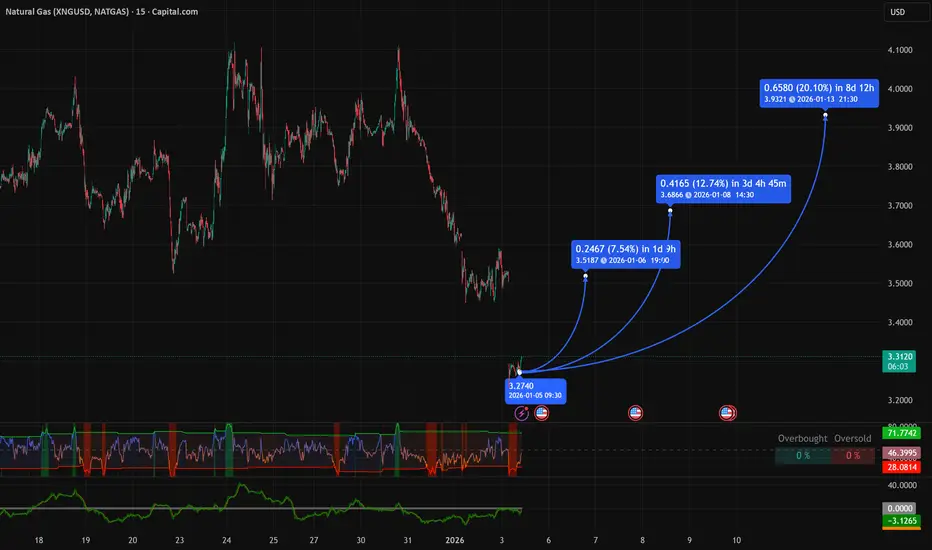
NATGAS CAPITAL (USD) Current Price: ~3.280 USD Bias: BullishNATGAS CAPITAL is holding in a strong demand zone (3.00–3.20). With weather still in play and colder patterns likely later this winter, heating demand may pick up — supporting natural gas prices and potentially pushing this instrument higher.
Immediate resistances at 3.51, 3.68, 3.92; breakout beyo
See all ideas
Displays a symbol's price movements over previous years to identify recurring trends.