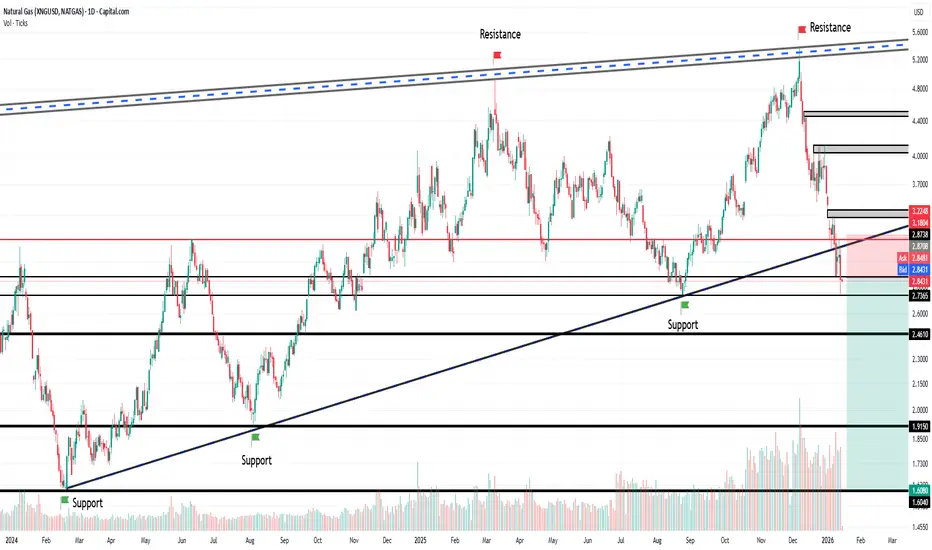
XNGUSD — Bottom or Reaction? Structure FirstNatural Gas has reacted sharply from a high-confluence support zone, but structure remains corrective, not impulsive.
What just happened:
• Price tagged the 0.707–0.786 retracement (2.67–2.38)
• Confluence with rising trendline
• Immediate rejection → active demand confirmed
What this means:
✔️ Valid support reaction
❌ Not a confirmed bottom yet
Bottoms are zones, not points.
Key Levels
Support:
🔹 2.35 – 2.70 → structural demand
Loss below this weakens structure
Pivot:
🔹 3.00 – 3.10 → reclaim needed for strength
Resistance:
🔹 3.43 – 3.87 → heavy supply
Only above this does upside expand
Invalidation
❌ Sustained acceptance below ~2.35 invalidates the bullish swing idea
Until then, this remains a reaction inside a corrective structure
Not a trade call. Structure & risk awareness only.
Structure > Noise | Levels > Forecasts
What traders are saying

NatGas LongCurrent Price: 3.557, immediate support and SL 3.498 , long with a target of 3.75, and trailing it to 3.9 4.091 and so on. For short positions enter after support 3 break and take support 2 as SL , tgt would be kept at 3.25.

XNG outlookBreak of structure of internal highs , Monthly demand has been tapped . Also , price has tapped into the higher time frame discounted zone from the fibonacci retracement tool
trade idea gives a 3.7 RRR , good zone to go long

Long may be possible Expect this but need patient to follow the Trend. Pattern look like trying to make higher lower and Trent will be broken sooner.
See the trend movement carefully

Natural Gas (XNGUSD) AnalysisNatural Gas (XNGUSD) Analysis
On the daily chart, NG witnessed an aggressive sell-off from the highs made during early November
Although prices are now testing a long-term support base (blue ascending trendline) and have failed to close below the trendline.
A Classic Bullish Divergence has also been formed (Prices: Lower lows & RSI: Higher lows => brown boxes)
Also, RSI has started rising higher froma deep oversold zone (<30)
--------------------------------------------------------------------------------------
Therefore, if 2.80 holds, then potential bullish reversion can be expected
with upside targets of 3.00, 3.15 & 3.38
RSI will likely move back toward the 40–50 zone
Note: This would be a corrective rally, not a full trend reversal yet.
Alternative Scenario: If NG gives a daily close below 2.75, then Bullish divergence fails & next downside will be 2.60 & 2.45

NATURAL GAS BEARISHNATURAL GAS bearish set up according 4hr tf price action
it's brake weekly channel pattern also retest chaneel pattern and move to down side

NG : Raising wedge breakdown• NG was trading in a wedge from Jan-2023.
• The wedge is clearly broken on 9th Jan
• Retest of the wedge is completed on14th Jan.
• SL and Target are mentioned in the chart.
• RR is 1:4.
• Educational purpose only. Happy learning
XNGUSD At Good Demand Zone Hello Friends 👋 XNGUSD - Now Sustain At Good Demand Zone.If You Are Looking Up Side This Could Be A Good Opportunity For You📊

NGAS (Natural Gas) – Technical Analysis | 2HFX:NGAS
Channel support line hit: Price has reacted exactly from the lower boundary of the falling channel, indicating structural support is respected.
New low not aggressive : The recent breakdown didn’t show strong momentum or expansion in range → signs of selling exhaustion, not panic.
Demand zone respected : Buyers stepped in from the marked demand area, confirming willingness to defend this zone.
Overall structure suggests short-term mean reversion / pullback rather than continuation of sharp downside.
📉 Trade Plan
🟢 Buy Zone: 3.42 – 3.46
⛔ Stop Loss: 3.32
🎯 Targets:
T1: 3.63, T2: 3.89, T3: 4.10.
Keep Learning, Happy Trading.

NATGAS CAPITAL (USD) Current Price: ~3.280 USD Bias: BullishNATGAS CAPITAL is holding in a strong demand zone (3.00–3.20). With weather still in play and colder patterns likely later this winter, heating demand may pick up — supporting natural gas prices and potentially pushing this instrument higher.
Immediate resistances at 3.51, 3.68, 3.92; breakout beyond 3.92 opens room for 4.00+. Invalid below 3.00.
Although recent short-term forecasts showed milder weather reducing immediate demand, weather models still suggest elevated risk of cold air outbreaks later in the winter, which could revive demand and tighten supplies.
📊 Levels to Watch
🟢 Support Zone (Buyers):
3.00 – 3.20 USD — key demand zone.
Invalidation under 3.00 weakens bullish thesis.
🔴 Intermediate Resistances:
3.51 USD – First resistance
3.68 USD – Reaction level
3.92 USD – Key barrier before breakout
⭐ Major Upside Target:
4.00+ USD — expected once 3.92 is cleared convincingly.
📈 Trade Plan (Example)
📍 Long Entry Zone: 3.00–3.20
🛑 Stop Loss: Below 2.90
🎯 Targets:
Target 1: 3.51
Target 2: 3.68
Target 3: 3.92
Extended: 4.00+
Weather Watch: Continued colder forecasts later in winter could accelerate the move up.
Position Sizing: The Backbone of Risk Management in Trading1. Meaning of Position Sizing
Position sizing refers to deciding how much capital to allocate to a single trade.
It determines the number of shares, lots, or contracts to buy or sell.
Unlike entry or exit timing, position sizing directly controls risk exposure.
Two traders with the same strategy can have vastly different results due to different position sizing rules.
2. Why Position Sizing Is Crucial
Protects trading capital from large drawdowns.
Helps traders survive losing streaks.
Ensures that no single trade can destroy the account.
Converts a strategy from speculative gambling into a structured probability-based system.
Allows compounding to work effectively over time.
3. Position Sizing vs Risk Management
Risk management is the broader framework (stop-loss, diversification, hedging).
Position sizing is the execution arm of risk management.
Even with a stop-loss, poor position sizing can lead to excessive losses.
Proper position sizing ensures losses stay small, controlled, and recoverable.
4. Core Principle: Risk Per Trade
Professional traders define risk before entering a trade.
Common risk levels:
0.5% of capital per trade (very conservative)
1% of capital per trade (most common)
2% of capital per trade (aggressive)
Example:
Capital = ₹10,00,000
Risk per trade = 1%
Maximum loss allowed = ₹10,000
5. Position Size Calculation Basics
Position size depends on:
Total capital
Risk per trade
Stop-loss distance
Formula:
Position Size = (Capital × Risk %) ÷ Stop-loss per unit
This ensures risk remains constant across trades.
6. Fixed Percentage Position Sizing
Most widely used method.
Risk a fixed percentage of capital on every trade.
Advantages:
Automatically adjusts size as capital grows or shrinks.
Protects during drawdowns.
Encourages consistency.
Example:
Capital grows → position size increases
Capital falls → position size decreases
7. Fixed Rupee (or Dollar) Position Sizing
Risk a fixed monetary amount per trade.
Example: Risk ₹5,000 on every trade.
Advantages:
Simple and psychologically comfortable.
Disadvantages:
Does not adapt to account growth.
Less effective for compounding.
8. Volatility-Based Position Sizing
Position size adjusts based on market volatility.
Uses indicators like:
ATR (Average True Range)
Historical volatility
More volatile stocks → smaller position size.
Less volatile stocks → larger position size.
Helps maintain uniform risk across instruments.
9. Stop-Loss Based Position Sizing
Position size is calculated after defining stop-loss.
Wider stop-loss → smaller position.
Tighter stop-loss → larger position.
Encourages disciplined trading and realistic stop placement.
Prevents emotional stop-loss shifting.
10. Kelly Criterion (Advanced Method)
Mathematical formula based on:
Win rate
Reward-to-risk ratio
Designed to maximize long-term growth.
Often considered too aggressive for real trading.
Many traders use half-Kelly or quarter-Kelly for safety.
Suitable only for traders with reliable historical data.
11. Position Sizing in Different Markets
Equity Trading: Based on share quantity and stop-loss.
Options Trading: Based on premium risk and strategy complexity.
Futures Trading: Must account for leverage and margin.
Forex Trading: Uses lot sizes and pip value.
Each market requires adapting position sizing to its structure.
12. Impact of Leverage on Position Sizing
Leverage magnifies both profits and losses.
High leverage without proper position sizing leads to rapid capital erosion.
Professionals always calculate risk after leverage, not before.
Leverage should enhance efficiency, not increase recklessness.
13. Position Sizing and Drawdowns
Smaller position sizes reduce drawdowns.
Example:
10% drawdown requires ~11% recovery
50% drawdown requires 100% recovery
Position sizing keeps drawdowns shallow, making recovery realistic.
This is critical for long-term consistency.
14. Psychological Benefits of Proper Position Sizing
Reduces fear and emotional decision-making.
Helps traders stick to their plan during volatility.
Prevents overconfidence after winning streaks.
Minimizes panic during losing trades.
Supports disciplined execution.
15. Common Position Sizing Mistakes
Increasing size after losses (revenge trading).
Using the same size for all trades regardless of stop-loss.
Ignoring volatility differences.
Risking too much on “high-conviction” trades.
Overleveraging due to greed.
16. Scaling In and Scaling Out
Position sizing is not always static.
Scaling in:
Entering positions gradually.
Reduces timing risk.
Scaling out:
Booking partial profits.
Reduces emotional pressure.
Both techniques require careful size planning.
17. Position Sizing and Portfolio Risk
Risk must be managed at both:
Trade level
Portfolio level
Correlated trades increase hidden risk.
Example:
Multiple banking stocks = higher sector exposure.
Portfolio-level position sizing prevents concentration risk.
18. Long-Term Compounding Effect
Small, consistent gains with controlled risk lead to exponential growth.
Position sizing allows compounding without risking ruin.
Many successful traders focus more on risk control than returns.
19. Position Sizing for Beginners vs Professionals
Beginners:
Should risk less (0.25%–0.5%).
Focus on survival and learning.
Professionals:
Can optimize sizing using performance data.
Adjust size dynamically based on edge and conditions.
20. Conclusion
Position sizing is the foundation of profitable trading.
It determines how well a trader manages uncertainty.
A mediocre strategy with excellent position sizing often outperforms a great strategy with poor sizing.
Traders who master position sizing shift from guessing market direction to managing probabilities and risk.
In the long run, success is not about how much you make on winning trades—but how little you lose on losing ones.

NATURAL GAS BEARISH TRADE
According to RSI and channel on weekly time frame perfect entry to bearish natural gas trade
Second trade is based on trendline brake
We see channel on weekly time frame and find exact entry in 2 HR time frame

If the winters are not sevier Don't worry summers will...Try not to short above the level...
Simple logic if winters were not enough harsh
Then summers will start early and the demand of electricity will increas

Divergence Secrets Who Should Trade Options?
Options are suitable for:
Traders looking for leverage with limited risk
Investors wanting to hedge positions
Experienced traders generating income
Anyone willing to learn market structure and volatility
But they require discipline, knowledge, and proper risk management.

XNGUSD (Natural Gas) – Elliott Wave View | Wave 3 in ProgressStrong Bullish Momentum – Price Near Key Breakout Zone
Natural Gas has continued its upward rally, supported by strong momentum and Elliott Wave structure. Price action suggests that we are currently in Wave 3, which typically produces the strongest impulsive move in the cycle.
The recent breakout above major resistance & rising demand signals sustained strength, while RSI remains bullish but slightly overbought—implying short-term pullback possibilities before further upside.
📍 Current Market Position
Trading around $5.13 with bullish continuation structure
Clean breakout above descending trendline resistance
Holding above strong support cluster of $4.70 – $4.50
RSI near 72, showing aggressive buying but close to exhaustion zone
📈 Elliott Wave Projection
Wave count suggests:
Wave 1 completed at $3.70 – $4.00
Wave 2 corrective low near $2.75
Wave 3 in progress, targeting upside expansion
🎯 Upside Target Zones
Target - Comment
$5.60 – $6.00 - Local resistance zone
$6.16 – $6.64 - Wave 3 extension target
$7.20 – $7.60 – $8.30 - Major supply zone / Wave 3 top possible
$10.00 – $11.55 - Final Wave 5 long-term target region
🟦 Key Buy Opportunity Zones (Pullback levels)
Support area - Comment
$4.70 – $4.50 - First dip buying zone
$4.25 – $4.10 - Strong demand base
$3.00 – $2.75 - Wave 2 reference zone / deep correction low
Only a breakdown below $2.75 would invalidate long-term bullish structure.
📊 RSI View
RSI currently at 71.88 (overbought region)
Possible small correction / sideways consolidation expected
Re-entry signals likely on RSI retracement to 45–55 zone
🎯 Trading Strategy (Personal Bias)
Bullish
Buy dips toward $4.70 / $4.50
Add aggressively if price holds $4.10 support
Target $6.00 → $6.64 → $7.60 → $8.30
Bearish invalidation
Close below $2.75
🧠 Conclusion
Natural Gas remains structurally bullish with Wave 3 expansion underway. Short-term corrections should provide strong opportunities to accumulate long positions for larger targets ahead.
💬 What is your view?
Do you expect Wave 3 to extend sharply?
Comment “Extended 3” if bullish or “Correction first” if expecting pullback.
Previous Analyses:
⚠️ Disclaimer
Educational Elliott Wave analysis only — Not investment advice. Manage risk appropriately.

Time to Trim longs in NaturalgasRange breakout target seem to have been achieved… details are explained in the chart..
Time and o book decent gains and not be greedy.
On weekly, previous supports Turing resistance polarity zone is at 5.3280
Let’s see how this plays out
Open Interest Analysis1. What is Open Interest?
Open Interest refers to the total number of outstanding or open contracts (futures or options) that currently exist in the market. These contracts have not been squared off, exercised, or expired. Unlike volume— which counts total traded contracts for a given session—OI tells you how many active contracts remain open at the end of the trading day.
You can think of OI as the number of "open commitments" between buyers and sellers.
If two parties create a new contract, OI increases by 1.
If they exit or square off, OI decreases by 1.
If contracts are transferred between traders (one enters, one exits), OI remains the same.
This makes OI a direct indicator of market participation and trader conviction.
2. Difference Between Volume and Open Interest
Aspect Volume Open Interest (OI)
Measures Number of contracts traded in a day Total active contracts still open
Reset Reset daily Carry forward until expiry
Shows Activity level for that session Market participation and trend strength
Use Short-term momentum Trend confirmation and sentiment
Both volume and OI together provide a powerful market outlook.
3. How Open Interest is Created and Destroyed
OI Increases When:
A new buyer and a new seller enter the market.
New long and short positions are created.
OI Decreases When:
A buyer and seller close their existing positions.
Squaring off reduces outstanding contracts.
OI Remains Unchanged When:
One trader exits and another takes over the position.
Understanding these mechanics helps traders interpret market signals accurately.
4. Interpreting Open Interest with Price Action
The true power of OI comes when you combine it with price movement. OI alone is not actionable—its interpretation depends heavily on price behavior.
Below are the four essential combinations used in OI analysis:
A. Price Up + OI Up → Fresh Long Build-up (Bullish)
This means traders are entering new long (buy) positions. It shows confidence in upward momentum.
Interpretation:
Strong bullish trend
Buyers aggressively participating
Trend likely to continue
Used for: Swing trades, trend-following trades, and breakout confirmation.
B. Price Down + OI Up → Fresh Short Build-up (Bearish)
When the price falls and OI increases, it signals new short positions being created.
Interpretation:
Strong bearish sentiment
Traders expect further price decline
Downtrend gaining strength
Used for: Short selling strategies, bearish breakouts, continuation trades.
C. Price Up + OI Down → Short Covering (Bullish but Temporary)
As shorts exit their positions, OI declines, leading to a temporary upward price move.
Interpretation:
Rally driven by short covering—not fresh longs
Trend may not sustain
Usually seen before resistance breakouts or reversals
Used for: Intraday trades, profit booking zones, cautious buying.
D. Price Down + OI Down → Long Liquidation (Bearish but Temporary)
Longs square off their positions, reducing OI and causing price to fall.
Interpretation:
Weakness in bullish sentiment
Not necessarily aggressive bearishness
Might lead to consolidation or reversal
Used for: Stop-loss resets, exit signals for long positions.
5. Open Interest in Options Trading
Options (Calls and Puts) provide even deeper insights into market psychology.
Key Concepts:
Call OI shows resistance zones.
Put OI shows support zones.
Change in OI shows if traders are adding or unwinding positions.
A. High Call OI → Resistance Zone
Large Call OI means sellers are confident that price will not exceed that level.
Example: Bank Nifty 48000 CE highest OI = strong resistance.
B. High Put OI → Support Zone
Put writers believe price will not fall below this level.
Example: Nifty 21500 PE highest OI = strong support.
C. PCR (Put–Call Ratio)
PCR = Total Put OI / Total Call OI
This helps measure market sentiment.
PCR > 1 → Bullish (more Put writing)
PCR < 1 → Bearish (more Call writing)
Extreme readings indicate reversals
6. Open Interest and Market Structure
OI acts as a backbone for understanding the structure of trends.
1. In a Strong Uptrend:
Price makes higher highs
OI increasing
More long positions accumulating
2. In a Strong Downtrend:
Price making lower lows
OI rising steadily
Shorts dominating
3. During Consolidation:
Price range-bound
OI rises (indicating buildup for breakout)
Option writers dominate (call & put both increase)
4. During Reversal Signals:
Price moves opposite of OI direction
Divergences form
Indicates weakening trend
7. Open Interest in Futures
For futures traders, OI helps identify:
Trend strength
Reversal chances
Institutional participation
Liquidity zones
Breakout reliability
Futures OI Build-up Types:
Long Build-up
Short Build-up
Long Unwinding
Short Covering
Each type gives a specific trading opportunity.
8. How Institutions Use Open Interest
Smart money (FIIs, prop desks, institutions) uses OI to:
Hedge large portfolios
Accumulate positions silently
Trap retail traders in false breakouts
Control liquidity and volatility
Institutions track OI changes to understand where retail traders are vulnerable.
Example:
If huge Call writing appears before a breakout, it may be a trap to absorb liquidity before moving higher.
9. Open Interest as a Risk Management Tool
OI not only helps predict trends but also helps manage risk:
Avoids trading in low OI contracts (illiquid)
Helps identify expiry-week volatility
Shows where stop-hunts may happen
Indicates where option sellers are positioned
High OI zones act as magnets for price due to hedging flows.
10. How to Use OI for Better Trading Decisions
Step-by-Step Approach:
Look at price trend (up/down/sideways).
Check OI change (increasing/decreasing).
Identify build-up type (long/short/unwinding/covering).
Mark support and resistance using option OI.
Check PCR for sentiment direction.
Use volume + OI + price for confirmation.
Place trades near OI cluster levels for best risk–reward.
11. Limitations of OI Analysis
While OI is powerful, it has limitations:
Does not show whether buyers or sellers are stronger
Can give false signals during low liquidity
Options OI can create misleading levels before expiry
Sudden changes may be due to hedge adjustments, not trend
News-driven markets can invalidate OI-based setups
Therefore, combine OI with price action, volume, and market structure.
12. Conclusion
Open Interest analysis is an essential tool for understanding the psychology and commitment of market participants. By combining OI with price and volume, traders can identify trend strength, potential reversals, support and resistance zones, and institutional activity. Whether analyzing futures or options, OI serves as a reliable indicator for planning trades with precision. While it has limitations, when used with proper risk management and complementary tools, OI analysis significantly enhances trading accuracy and confidence.
NATURALGAS in Demand/Support zone - Buying opportunity?
TF: 1 hour
CMP: 4.4550
The decline from the top is zig/zag (overlapping structure), hence, I feel that there could be one more move pending on the upside.. If not break of the swing high, at least a retracement of 60-75% is potentially on the cards.
Price is now at the Demand/support zone
Price is taking support at the AVWAP
ABC correction seems to be nearing it's completion (script could make one more low or equal low below 4.4216)
This could very well be the W leg of a complex correction.. but still, a bounce is imminent.
My view:
Definitely not a place to initiate fresh shorts..
Trail your existing short positions with tight SL (as the price moves strongly in a single bar itself)
Wait for confirmation to for LONG set up.
Disclaimer: I am not a SEBI registered Analyst and this is not a trading advise. Views are personal and for educational purpose only. Please consult your Financial Advisor for any investment decisions. Please consider my views only to get a different perspective (FOR or AGAINST your views). Please don't trade FNO based on my views. If you like my analysis and learnt something from it, please give a BOOST. Feel free to express your thoughts and questions in the comments section.

natural gas bearish setupnatural gas reaching resistance from the most recent swing which also happens to be bearish ob.
from last year we can expect a fall

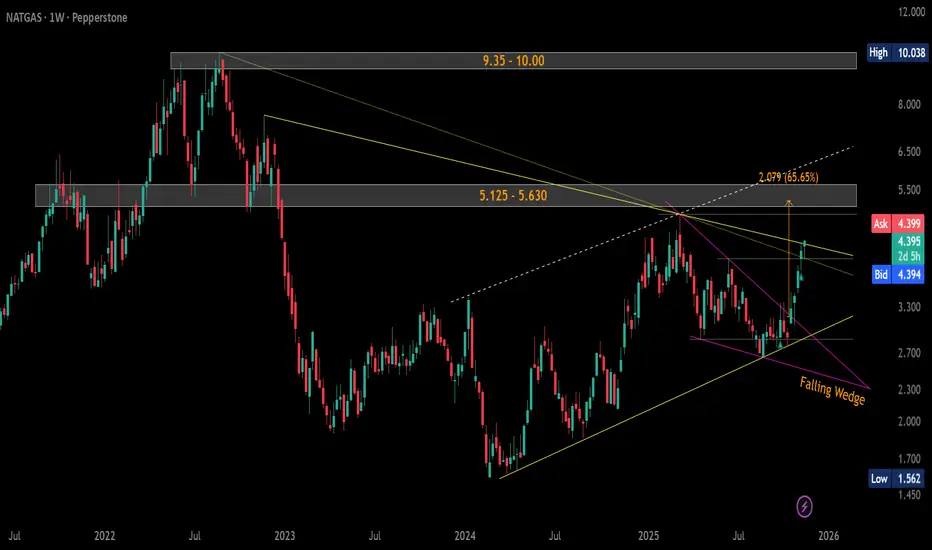
#NaturalGas ($NG) Weekly Update — Trading at Breakout ZoneCMP: $4.400
+54% from suggested levels and +58% from lows. 🚀
Price trading in the key resistance zone $4.339–4.417.
WCB > $4.417 = Symmetrical Triangle breakout → Falling Wedge target: $5.246 🎯
🛡 Supports: $4.067 / $3.803 / $3.625–$3.572
🚧 Major Resistances:
• ST: $5.125–$5.630
• LT: $9.35–$10.00
Tight structure… breakout looks close. 🔥
#NG VANTAGE:NG #NaturalGas #Commodities #PriceAction #SymmetricalTriangle #FallingWedge #ChartPatterns #Breakout
📌 #Disclaimer: This analysis is shared for educational purposes only. It is not a buy/sell recommendation. Please do your own research before making any trading decisions.
NATURALGAS - Approaching Harmonic CRAB PRZ (Short Term)
TF: 15 Minutes
CMP: 4.6464
Please note that this view is ONLY for the short term as the TF is 15 minutes. So plan your trade accordingly.
The ideal pattern target for the PRZ is 1.618 fib extension (of the XA leg) at 4.7740 and we should be expecting at least 50% pullback from that level.
If you are long, trail you SL strictly.
If you intend to play short here, better to wait for the price to reach and react at the PRZ zone and decide with better RR
Details are explained in the chart for better understanding.
Disclaimer: I am not a SEBI registered Analyst and this is not a trading advise. Views are personal and for educational purpose only. Please consult your Financial Advisor for any investment decisions. Please consider my views only to get a different perspective (FOR or AGAINST your views). Please don't trade FNO based on my views. If you like my analysis and learnt something from it, please give a BOOST. Feel free to express your thoughts and questions in the comments section.

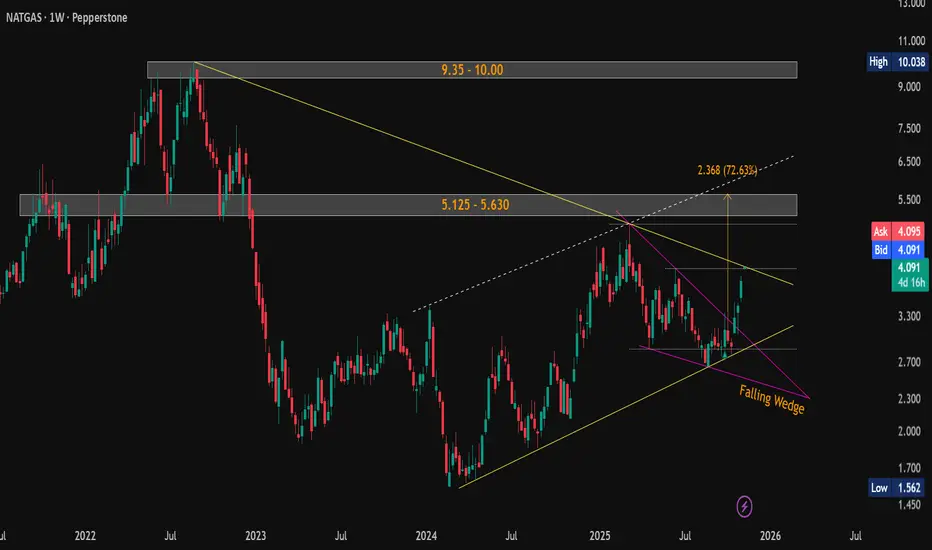
#NaturalGas ($NG) Weekly Update — Testing Critical Resistance!CMP: $4.092
💥 Up +38% from mentioned support ( $3.013–$2.956 ) and +46% from lows in a month . 🚀
The falling wedge breakout played out strongly, and price is now testing the critical resistance of the falling yellow trendline near the previous swing high $4.067 .
A weekly close above this trendline will confirm a major breakout , potentially triggering the next leg higher.
📊 Key Levels:
🛡 Supports: $4.067 / $3.013–$2.956 / $2.692–$2.643
🚧 Resistances / Targets: $5.125–$5.630 / $9.35–$10.00
Structure now forming a larger Symmetrical Triangle between rising and falling yellow trendlines — watch for breakout confirmation .
⚠️ Possible short-term pause/retest before continuation.
#NaturalGas #NG #Commodities #FallingWedge #RisingChannel #SymmetricalTriangle #ChartPattern #PriceAction
📌 #Disclaimer: This analysis is shared for educational purposes only. It is not a buy/sell recommendation. Please do your own research before making any trading decisions.
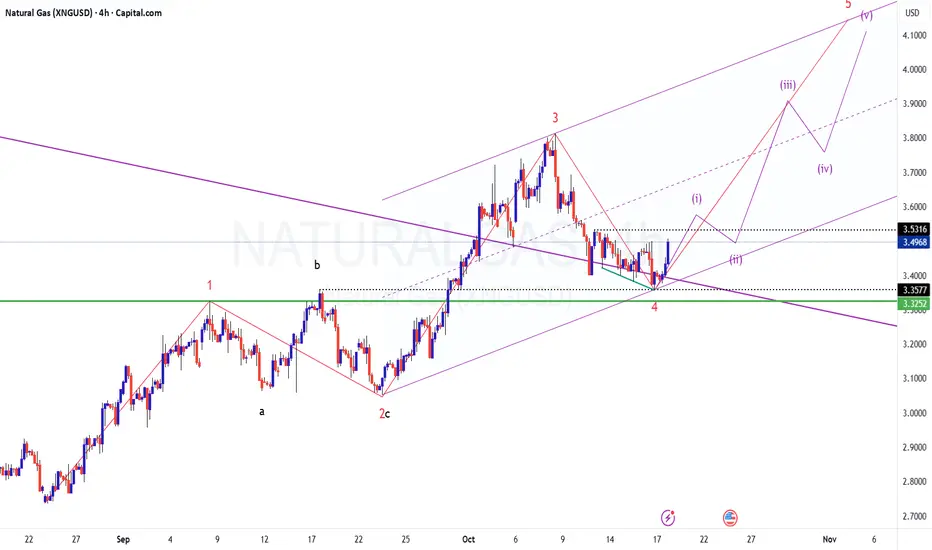
NATURALGAS - Getting Ready for the next impulse?
CMP: 3.4970
TF: 4 Hours
The script seems to have ended it's correction and ready to move up higher.
wave counts are marked herein for better understanding.
Break of 3.5320 will be the initial confirmation/validation.
This view becomes invalid if we start to trade below 3.3252
On Pitchfork, price is trying to get past the midpoint.. Our confirmation level too confluences around the same level.
On Daily timeframe, it looks like breakout and retest of the falling trendline from the highs.
Disclaimer: I am not a SEBI registered Analyst and this is not a trading advise. Views are personal and for educational purpose only. Please consult your Financial Advisor for any investment decisions. Please consider my views only to get a different perspective (FOR or AGAINST your views). Please don't trade FNO based on my views. If you like my analysis and learnt something from it, please give a BOOST. Feel free to express your thoughts and questions in the comments section.