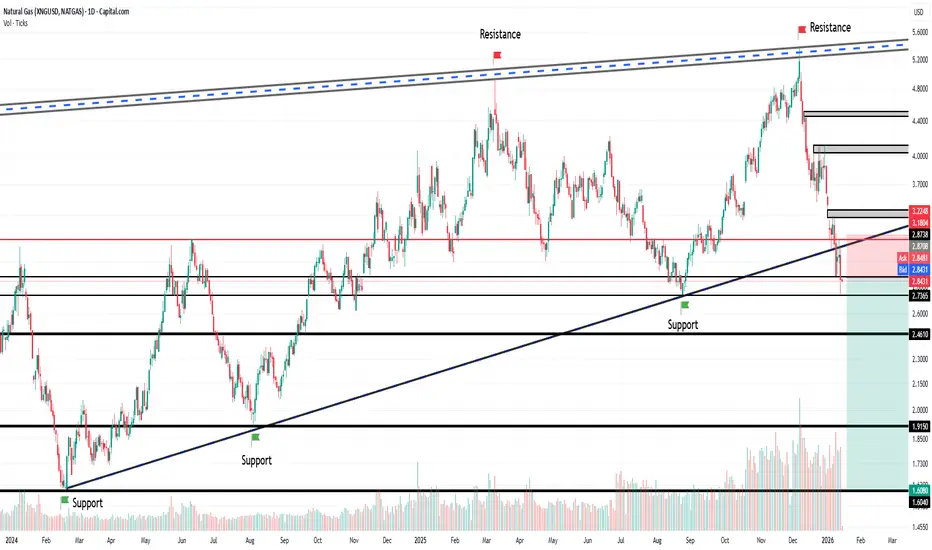
Natural Gas (XNGUSD) | Daily | 24 Mar 2026Structure: Range / Distribution
Location: Upper Range
Supply: 5.00 – 5.27
Pivot: 3.00 – 3.20
Demand: 1.60 – 2.00
Behaviour:
Rejection near supply, rotational behaviour continues.
Invalidation:
Acceptance above supply zone
Continuation:
Rotation within range between defined zones
This analysis
About Natural Gas (Henry Hub)
Natural Gas (NGAS) is a fossil fuel formed from plants and animals buried underground and exposed to extreme heat and pressure. Natural gas is used domestically for cooking, as a power source, in agriculture, and in industrial manufacturing. Natural gas prices fluctuate constantly depending mainly on production issues, stockpiles, weather conditions, economic growth, crude oil prices, and more recently coal. Natural gas is commonly measured in MMBtu, with 1 MMBTu equaling 1 million BTU (British Thermal Units).

Natural gas have never closed below the 2.8 mark line on weekly bases from last 16 month will be interesting to see this month if manages to hold 2.8 on closing bases can see fresh buying power emerging that can move price higher back towards previous swing high levels . strucure to consider fail if weekly/mont

NG suggest double bottom Possibility on Daily ChartsNG suggest double bottom Possibility on Daily Charts.
LTP - 2.915
Targets - 40% Upside
Timeframe - 3-4 Months.
Happy Investing.

XNGUSD — Bottom or Reaction? Structure FirstNatural Gas has reacted sharply from a high-confluence support zone, but structure remains corrective, not impulsive.
What just happened:
• Price tagged the 0.707–0.786 retracement (2.67–2.38)
• Confluence with rising trendline
• Immediate rejection → active demand confirmed
What this means:
✔️ Va

NatGas LongCurrent Price: 3.557, immediate support and SL 3.498 , long with a target of 3.75, and trailing it to 3.9 4.091 and so on. For short positions enter after support 3 break and take support 2 as SL , tgt would be kept at 3.25.

XNG outlookBreak of structure of internal highs , Monthly demand has been tapped . Also , price has tapped into the higher time frame discounted zone from the fibonacci retracement tool
trade idea gives a 3.7 RRR , good zone to go long

Long may be possible Expect this but need patient to follow the Trend. Pattern look like trying to make higher lower and Trent will be broken sooner.
See the trend movement carefully

Natural Gas (XNGUSD) AnalysisNatural Gas (XNGUSD) Analysis
On the daily chart, NG witnessed an aggressive sell-off from the highs made during early November
Although prices are now testing a long-term support base (blue ascending trendline) and have failed to close below the trendline.
A Classic Bullish Divergence has also be

NATURAL GAS BEARISHNATURAL GAS bearish set up according 4hr tf price action
it's brake weekly channel pattern also retest chaneel pattern and move to down side

NG : Raising wedge breakdown• NG was trading in a wedge from Jan-2023.
• The wedge is clearly broken on 9th Jan
• Retest of the wedge is completed on14th Jan.
• SL and Target are mentioned in the chart.
• RR is 1:4.
• Educational purpose only. Happy learning
See all ideas
Displays a symbol's price movements over previous years to identify recurring trends.