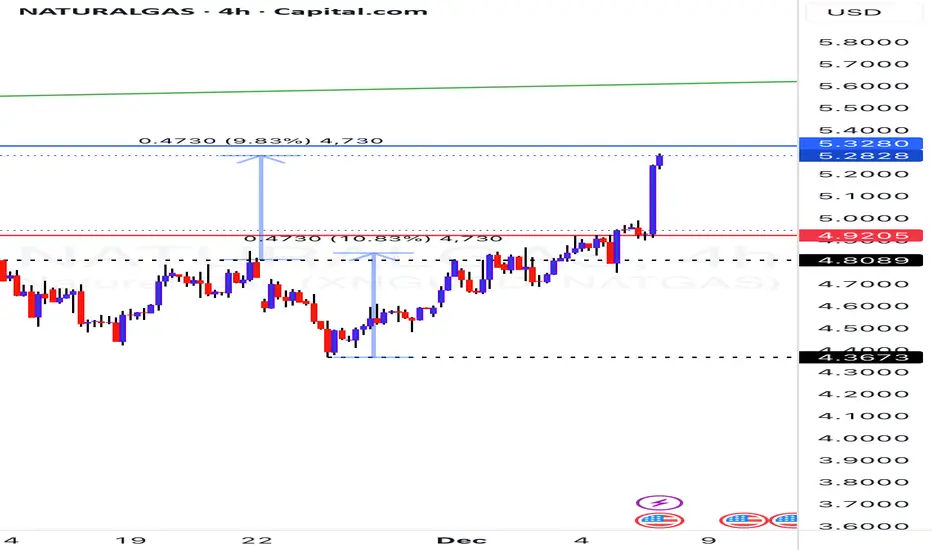
Time to Trim longs in NaturalgasRange breakout target seem to have been achieved… details are explained in the chart..
Time and o book decent gains and not be greedy.
On weekly, previous supports Turing resistance polarity zone is at 5.3280
Let’s see how this plays out
Trade ideas
NATURALGAS in Demand/Support zone - Buying opportunity?
TF: 1 hour
CMP: 4.4550
The decline from the top is zig/zag (overlapping structure), hence, I feel that there could be one more move pending on the upside.. If not break of the swing high, at least a retracement of 60-75% is potentially on the cards.
Price is now at the Demand/support zone
Price is taking support at the AVWAP
ABC correction seems to be nearing it's completion (script could make one more low or equal low below 4.4216)
This could very well be the W leg of a complex correction.. but still, a bounce is imminent.
My view:
Definitely not a place to initiate fresh shorts..
Trail your existing short positions with tight SL (as the price moves strongly in a single bar itself)
Wait for confirmation to for LONG set up.
Disclaimer: I am not a SEBI registered Analyst and this is not a trading advise. Views are personal and for educational purpose only. Please consult your Financial Advisor for any investment decisions. Please consider my views only to get a different perspective (FOR or AGAINST your views). Please don't trade FNO based on my views. If you like my analysis and learnt something from it, please give a BOOST. Feel free to express your thoughts and questions in the comments section.

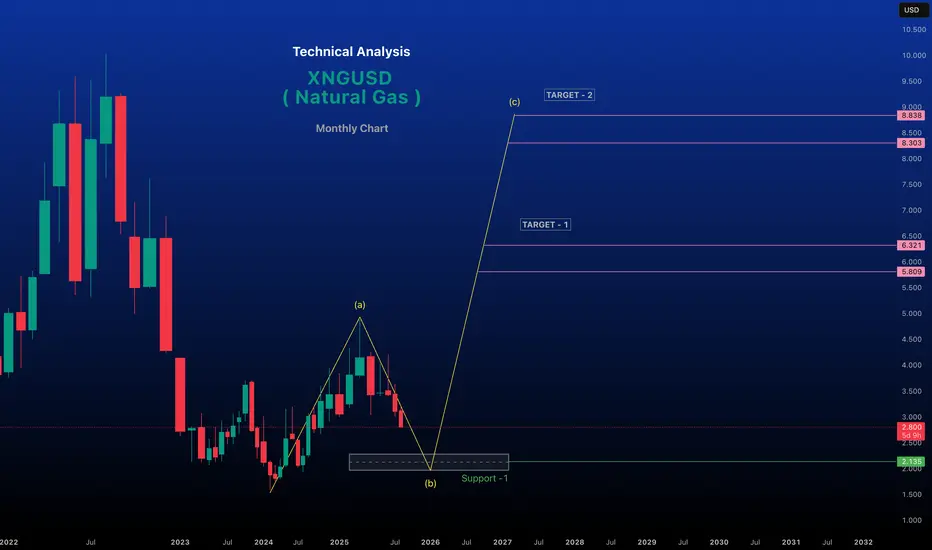
XNGUSD (Natural Gas) – Elliott Wave View | Wave 3 in ProgressStrong Bullish Momentum – Price Near Key Breakout Zone
Natural Gas has continued its upward rally, supported by strong momentum and Elliott Wave structure. Price action suggests that we are currently in Wave 3, which typically produces the strongest impulsive move in the cycle.
The recent breakout above major resistance & rising demand signals sustained strength, while RSI remains bullish but slightly overbought—implying short-term pullback possibilities before further upside.
📍 Current Market Position
Trading around $5.13 with bullish continuation structure
Clean breakout above descending trendline resistance
Holding above strong support cluster of $4.70 – $4.50
RSI near 72, showing aggressive buying but close to exhaustion zone
📈 Elliott Wave Projection
Wave count suggests:
Wave 1 completed at $3.70 – $4.00
Wave 2 corrective low near $2.75
Wave 3 in progress, targeting upside expansion
🎯 Upside Target Zones
Target - Comment
$5.60 – $6.00 - Local resistance zone
$6.16 – $6.64 - Wave 3 extension target
$7.20 – $7.60 – $8.30 - Major supply zone / Wave 3 top possible
$10.00 – $11.55 - Final Wave 5 long-term target region
🟦 Key Buy Opportunity Zones (Pullback levels)
Support area - Comment
$4.70 – $4.50 - First dip buying zone
$4.25 – $4.10 - Strong demand base
$3.00 – $2.75 - Wave 2 reference zone / deep correction low
Only a breakdown below $2.75 would invalidate long-term bullish structure.
📊 RSI View
RSI currently at 71.88 (overbought region)
Possible small correction / sideways consolidation expected
Re-entry signals likely on RSI retracement to 45–55 zone
🎯 Trading Strategy (Personal Bias)
Bullish
Buy dips toward $4.70 / $4.50
Add aggressively if price holds $4.10 support
Target $6.00 → $6.64 → $7.60 → $8.30
Bearish invalidation
Close below $2.75
🧠 Conclusion
Natural Gas remains structurally bullish with Wave 3 expansion underway. Short-term corrections should provide strong opportunities to accumulate long positions for larger targets ahead.
💬 What is your view?
Do you expect Wave 3 to extend sharply?
Comment “Extended 3” if bullish or “Correction first” if expecting pullback.
Previous Analyses:
⚠️ Disclaimer
Educational Elliott Wave analysis only — Not investment advice. Manage risk appropriately.

Divergence Secrets Who Should Trade Options?
Options are suitable for:
Traders looking for leverage with limited risk
Investors wanting to hedge positions
Experienced traders generating income
Anyone willing to learn market structure and volatility
But they require discipline, knowledge, and proper risk management.

natural gas bearish setupnatural gas reaching resistance from the most recent swing which also happens to be bearish ob.
from last year we can expect a fall

Open Interest Analysis1. What is Open Interest?
Open Interest refers to the total number of outstanding or open contracts (futures or options) that currently exist in the market. These contracts have not been squared off, exercised, or expired. Unlike volume— which counts total traded contracts for a given session—OI tells you how many active contracts remain open at the end of the trading day.
You can think of OI as the number of "open commitments" between buyers and sellers.
If two parties create a new contract, OI increases by 1.
If they exit or square off, OI decreases by 1.
If contracts are transferred between traders (one enters, one exits), OI remains the same.
This makes OI a direct indicator of market participation and trader conviction.
2. Difference Between Volume and Open Interest
Aspect Volume Open Interest (OI)
Measures Number of contracts traded in a day Total active contracts still open
Reset Reset daily Carry forward until expiry
Shows Activity level for that session Market participation and trend strength
Use Short-term momentum Trend confirmation and sentiment
Both volume and OI together provide a powerful market outlook.
3. How Open Interest is Created and Destroyed
OI Increases When:
A new buyer and a new seller enter the market.
New long and short positions are created.
OI Decreases When:
A buyer and seller close their existing positions.
Squaring off reduces outstanding contracts.
OI Remains Unchanged When:
One trader exits and another takes over the position.
Understanding these mechanics helps traders interpret market signals accurately.
4. Interpreting Open Interest with Price Action
The true power of OI comes when you combine it with price movement. OI alone is not actionable—its interpretation depends heavily on price behavior.
Below are the four essential combinations used in OI analysis:
A. Price Up + OI Up → Fresh Long Build-up (Bullish)
This means traders are entering new long (buy) positions. It shows confidence in upward momentum.
Interpretation:
Strong bullish trend
Buyers aggressively participating
Trend likely to continue
Used for: Swing trades, trend-following trades, and breakout confirmation.
B. Price Down + OI Up → Fresh Short Build-up (Bearish)
When the price falls and OI increases, it signals new short positions being created.
Interpretation:
Strong bearish sentiment
Traders expect further price decline
Downtrend gaining strength
Used for: Short selling strategies, bearish breakouts, continuation trades.
C. Price Up + OI Down → Short Covering (Bullish but Temporary)
As shorts exit their positions, OI declines, leading to a temporary upward price move.
Interpretation:
Rally driven by short covering—not fresh longs
Trend may not sustain
Usually seen before resistance breakouts or reversals
Used for: Intraday trades, profit booking zones, cautious buying.
D. Price Down + OI Down → Long Liquidation (Bearish but Temporary)
Longs square off their positions, reducing OI and causing price to fall.
Interpretation:
Weakness in bullish sentiment
Not necessarily aggressive bearishness
Might lead to consolidation or reversal
Used for: Stop-loss resets, exit signals for long positions.
5. Open Interest in Options Trading
Options (Calls and Puts) provide even deeper insights into market psychology.
Key Concepts:
Call OI shows resistance zones.
Put OI shows support zones.
Change in OI shows if traders are adding or unwinding positions.
A. High Call OI → Resistance Zone
Large Call OI means sellers are confident that price will not exceed that level.
Example: Bank Nifty 48000 CE highest OI = strong resistance.
B. High Put OI → Support Zone
Put writers believe price will not fall below this level.
Example: Nifty 21500 PE highest OI = strong support.
C. PCR (Put–Call Ratio)
PCR = Total Put OI / Total Call OI
This helps measure market sentiment.
PCR > 1 → Bullish (more Put writing)
PCR < 1 → Bearish (more Call writing)
Extreme readings indicate reversals
6. Open Interest and Market Structure
OI acts as a backbone for understanding the structure of trends.
1. In a Strong Uptrend:
Price makes higher highs
OI increasing
More long positions accumulating
2. In a Strong Downtrend:
Price making lower lows
OI rising steadily
Shorts dominating
3. During Consolidation:
Price range-bound
OI rises (indicating buildup for breakout)
Option writers dominate (call & put both increase)
4. During Reversal Signals:
Price moves opposite of OI direction
Divergences form
Indicates weakening trend
7. Open Interest in Futures
For futures traders, OI helps identify:
Trend strength
Reversal chances
Institutional participation
Liquidity zones
Breakout reliability
Futures OI Build-up Types:
Long Build-up
Short Build-up
Long Unwinding
Short Covering
Each type gives a specific trading opportunity.
8. How Institutions Use Open Interest
Smart money (FIIs, prop desks, institutions) uses OI to:
Hedge large portfolios
Accumulate positions silently
Trap retail traders in false breakouts
Control liquidity and volatility
Institutions track OI changes to understand where retail traders are vulnerable.
Example:
If huge Call writing appears before a breakout, it may be a trap to absorb liquidity before moving higher.
9. Open Interest as a Risk Management Tool
OI not only helps predict trends but also helps manage risk:
Avoids trading in low OI contracts (illiquid)
Helps identify expiry-week volatility
Shows where stop-hunts may happen
Indicates where option sellers are positioned
High OI zones act as magnets for price due to hedging flows.
10. How to Use OI for Better Trading Decisions
Step-by-Step Approach:
Look at price trend (up/down/sideways).
Check OI change (increasing/decreasing).
Identify build-up type (long/short/unwinding/covering).
Mark support and resistance using option OI.
Check PCR for sentiment direction.
Use volume + OI + price for confirmation.
Place trades near OI cluster levels for best risk–reward.
11. Limitations of OI Analysis
While OI is powerful, it has limitations:
Does not show whether buyers or sellers are stronger
Can give false signals during low liquidity
Options OI can create misleading levels before expiry
Sudden changes may be due to hedge adjustments, not trend
News-driven markets can invalidate OI-based setups
Therefore, combine OI with price action, volume, and market structure.
12. Conclusion
Open Interest analysis is an essential tool for understanding the psychology and commitment of market participants. By combining OI with price and volume, traders can identify trend strength, potential reversals, support and resistance zones, and institutional activity. Whether analyzing futures or options, OI serves as a reliable indicator for planning trades with precision. While it has limitations, when used with proper risk management and complementary tools, OI analysis significantly enhances trading accuracy and confidence.
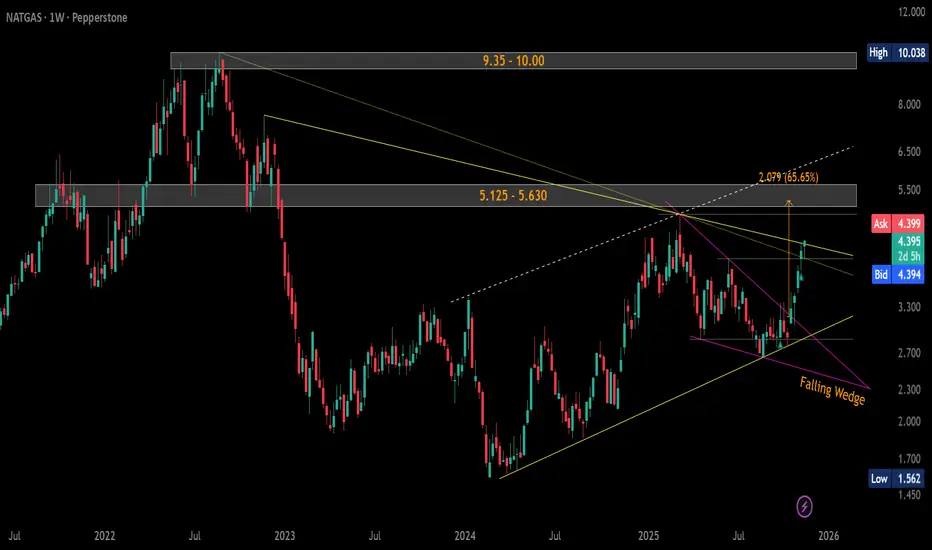
#NaturalGas ($NG) Weekly Update — Trading at Breakout ZoneCMP: $4.400
+54% from suggested levels and +58% from lows. 🚀
Price trading in the key resistance zone $4.339–4.417.
WCB > $4.417 = Symmetrical Triangle breakout → Falling Wedge target: $5.246 🎯
🛡 Supports: $4.067 / $3.803 / $3.625–$3.572
🚧 Major Resistances:
• ST: $5.125–$5.630
• LT: $9.35–$10.00
Tight structure… breakout looks close. 🔥
#NG VANTAGE:NG #NaturalGas #Commodities #PriceAction #SymmetricalTriangle #FallingWedge #ChartPatterns #Breakout
📌 #Disclaimer: This analysis is shared for educational purposes only. It is not a buy/sell recommendation. Please do your own research before making any trading decisions.
NATURALGAS - Approaching Harmonic CRAB PRZ (Short Term)
TF: 15 Minutes
CMP: 4.6464
Please note that this view is ONLY for the short term as the TF is 15 minutes. So plan your trade accordingly.
The ideal pattern target for the PRZ is 1.618 fib extension (of the XA leg) at 4.7740 and we should be expecting at least 50% pullback from that level.
If you are long, trail you SL strictly.
If you intend to play short here, better to wait for the price to reach and react at the PRZ zone and decide with better RR
Details are explained in the chart for better understanding.
Disclaimer: I am not a SEBI registered Analyst and this is not a trading advise. Views are personal and for educational purpose only. Please consult your Financial Advisor for any investment decisions. Please consider my views only to get a different perspective (FOR or AGAINST your views). Please don't trade FNO based on my views. If you like my analysis and learnt something from it, please give a BOOST. Feel free to express your thoughts and questions in the comments section.

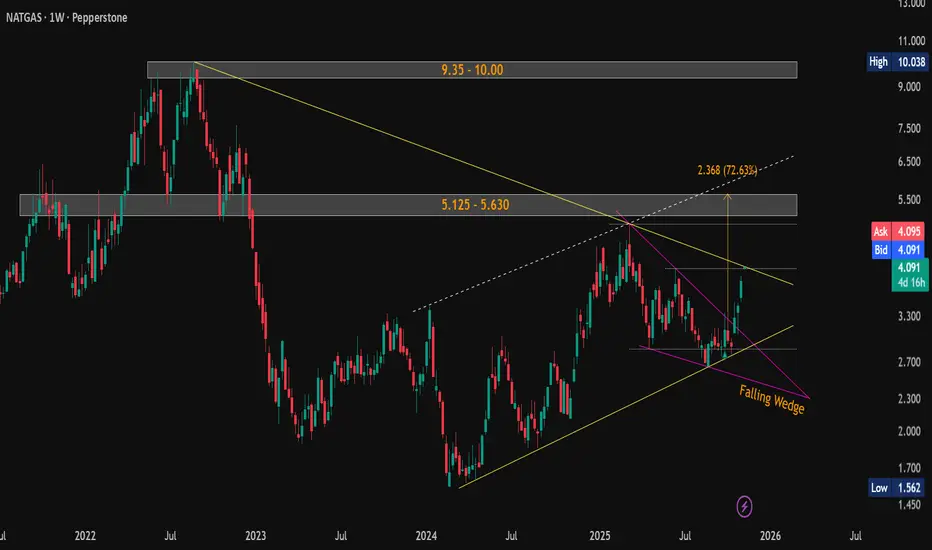
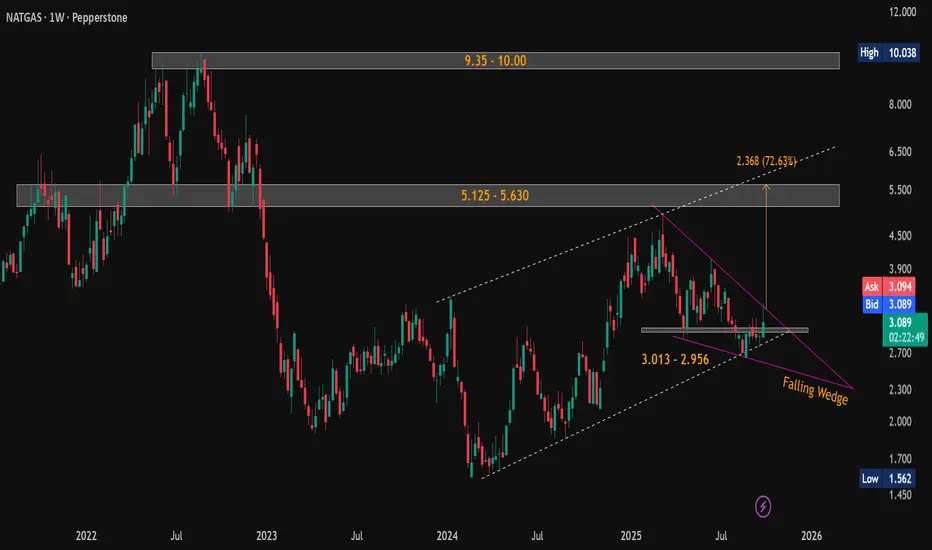
#NaturalGas ($NG) Weekly Update — Testing Critical Resistance!CMP: $4.092
💥 Up +38% from mentioned support ( $3.013–$2.956 ) and +46% from lows in a month . 🚀
The falling wedge breakout played out strongly, and price is now testing the critical resistance of the falling yellow trendline near the previous swing high $4.067 .
A weekly close above this trendline will confirm a major breakout , potentially triggering the next leg higher.
📊 Key Levels:
🛡 Supports: $4.067 / $3.013–$2.956 / $2.692–$2.643
🚧 Resistances / Targets: $5.125–$5.630 / $9.35–$10.00
Structure now forming a larger Symmetrical Triangle between rising and falling yellow trendlines — watch for breakout confirmation .
⚠️ Possible short-term pause/retest before continuation.
#NaturalGas #NG #Commodities #FallingWedge #RisingChannel #SymmetricalTriangle #ChartPattern #PriceAction
📌 #Disclaimer: This analysis is shared for educational purposes only. It is not a buy/sell recommendation. Please do your own research before making any trading decisions.
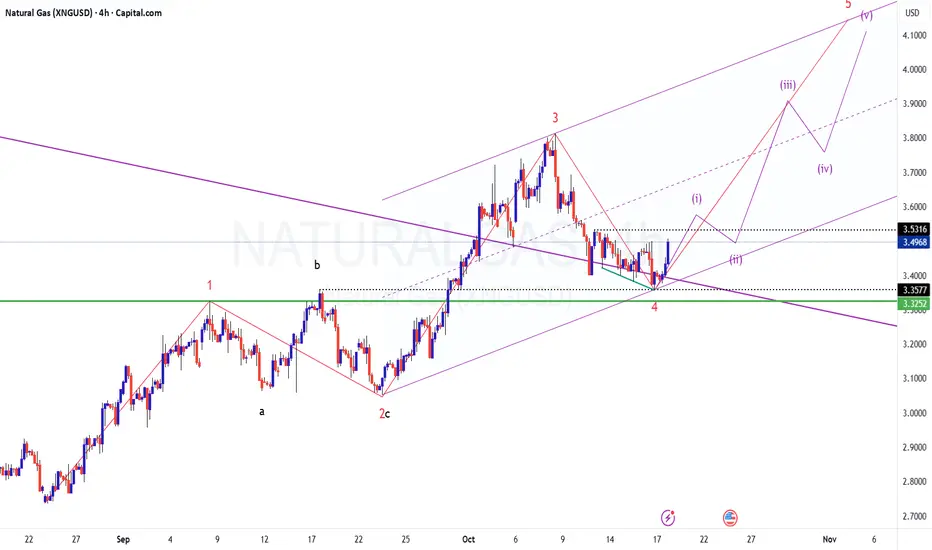
NATURALGAS - Getting Ready for the next impulse?
CMP: 3.4970
TF: 4 Hours
The script seems to have ended it's correction and ready to move up higher.
wave counts are marked herein for better understanding.
Break of 3.5320 will be the initial confirmation/validation.
This view becomes invalid if we start to trade below 3.3252
On Pitchfork, price is trying to get past the midpoint.. Our confirmation level too confluences around the same level.
On Daily timeframe, it looks like breakout and retest of the falling trendline from the highs.
Disclaimer: I am not a SEBI registered Analyst and this is not a trading advise. Views are personal and for educational purpose only. Please consult your Financial Advisor for any investment decisions. Please consider my views only to get a different perspective (FOR or AGAINST your views). Please don't trade FNO based on my views. If you like my analysis and learnt something from it, please give a BOOST. Feel free to express your thoughts and questions in the comments section.
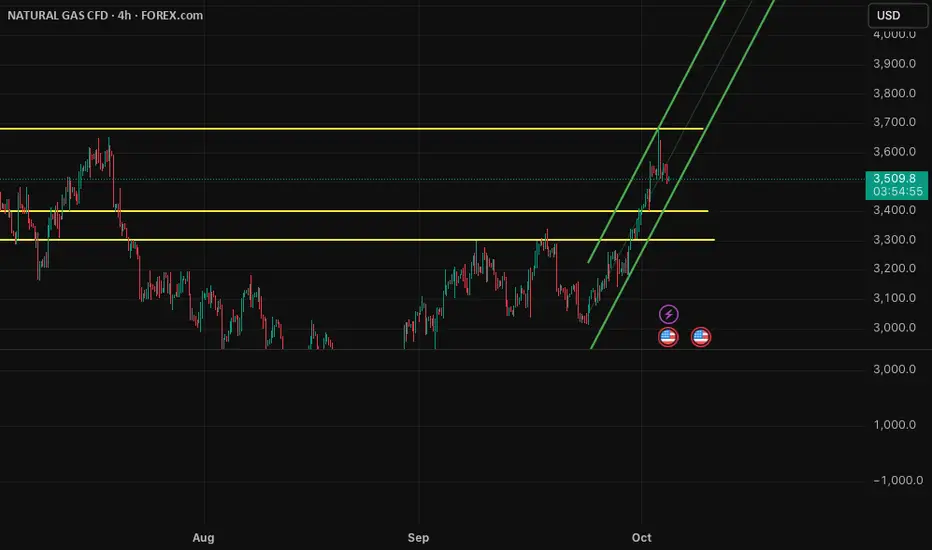
NG Price (FOREXCOM) Outlook: Potential Drop Toward 3.400–3.300Natural gas surged to 3.682 (FOREXCOM CFD), supported by yesterday’s inventory drop and the short-term cold weather forecast.
However, in the short term, if weather conditions normalize, we may see downward pressure on NG prices, with potential retracements to 3.400 and further to 3.300 levels.
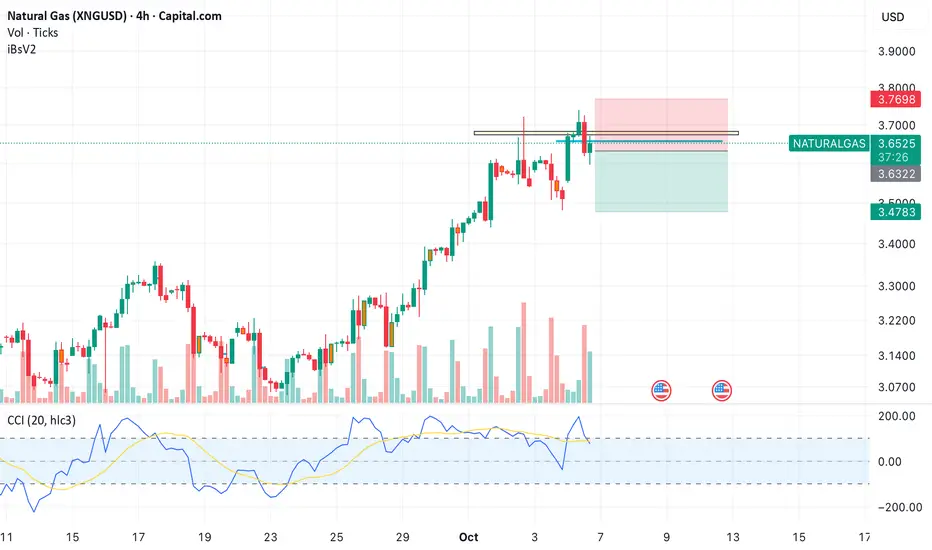
The Euphoria Before the FallThe recent price action in Natural Gas is a textbook example of short-term optimism divorced from underlying fundamentals. While traders celebrate minor weather-related demand forecasts, the broader structure tells a different story — one of excess positioning and complacency.
1. Technical Overextension Disguised as Strength
Natural Gas has rallied sharply over the last few sessions, but the 4-hour chart reveals critical fatigue near the 3.65–3.75 resistance band. This zone aligns with previous supply pockets and the upper boundary of the last major distribution phase.
• The CCI is rolling over from overbought levels.
• Volumes have thinned out despite higher prices, indicating smart money exiting quietly.
• The most recent candle formation shows clear rejection, suggesting failed attempts to hold above the breakout point.
Such structures rarely sustain without meaningful follow-through volume. This is a market running on fumes, not on fundamentals.
2. Fundamental Dissonance
On the macro front, the narrative doesn’t justify the rally:
• Storage levels in the U.S. remain above the 5-year average, implying no genuine supply stress.
• Mild weather forecasts across key consuming regions reduce the probability of significant short-term demand spikes.
• LNG export growth, while a supportive long-term story, has already been priced in by speculative traders.
In essence, the market is reacting to marginal bullish headlines while ignoring the broader supply overhang. The structural imbalance remains — and it favors lower prices once speculative positioning unwinds.
3. Behavioral Mispricing and Market Psychology
Markets often repeat a familiar behavioral pattern:
• Retail enthusiasm builds on narratives of “early winter demand.”
• Hedge funds chase momentum, ignoring inventory and weather convergence data.
• The setup peaks when conviction is highest and that’s exactly what the price structure at 3.70–3.75 is signaling now.
4. Trade Structure and Risk Framework
• Sell Zone: Below 3.63
• Stop Loss: 3.77 (above structural rejection)
• Targets: 3.40 (first target), 3.25 (extended move)
• Risk–Reward: Approximately 1:2.5, highly asymmetric.
If the correction gains traction, a break below 3.40 could accelerate profit-taking, potentially dragging prices toward 3.20 levels as speculative longs unwind.
5. The Contrarian Premise
Natural Gas is pricing perfection ie the assumption that seasonal demand will spike and storage draws will tighten balances. The data doesn’t confirm it. This is a liquidity-driven bounce within a broader range-bound market, not the start of a structural uptrend. When fundamentals contradict price, the correction is only a matter of timing, not probability.
Natural Gas (NG) Weekly Breakout Brewing — 80% Upside Potential!Current Price: $3.090
Technical View (Weekly Timeframe):
Natural Gas has formed a classic falling wedge pattern on the weekly chart - a strong bullish reversal setup. Price action is currently on the verge of breakout , with increasing volume and narrowing range suggesting imminent movement.
🟢 Strong Support Zones:
$3.013 – $2.956
$2.692 – $2.643
🔺 Key Resistance / Upside Targets:
Short-term: $5.125 – $5.630 (Pattern target: $5.625 )
Long-term: $9.35 – $10.00
📈 The pattern breakout target of $5.625 aligns closely with the major resistance zone of $5.125 – $5.630, representing a potential ~80% upside from current levels.
Look for confirmed breakout above the wedge resistance with strong volume for trend continuation.
#NaturalGas | #NG | #FallingWedge | #ChartPatterns | #TechnicalAnalysis | #PriceAction
📌 Disclaimer: This analysis is shared for educational purposes only. It is not a buy/sell recommendation. Please do your own research before making any trading decisions.
Natural Gas (15M) Buy Setup
Price is showing a strong support around 3.190 zone after the recent pullback.
I expect a bounce towards 3.330 (previous resistance).
✅ Entry: Near 3.190 – 3.200
🎯 Target: 3.330

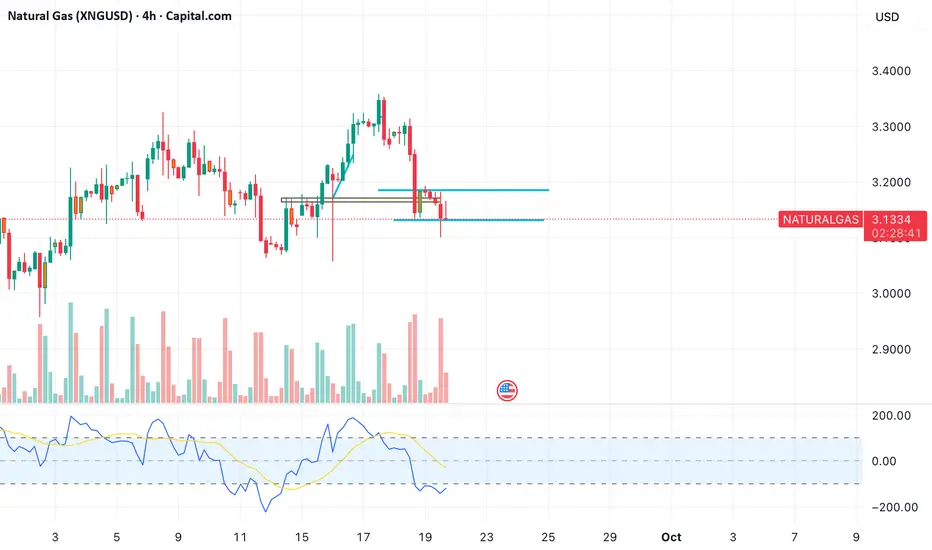
Gas fuelling in for an expiry rally!
Observations:
• Price broke down below the horizontal support zone (~$3.12–$3.13), but the candles show strong rejection wicks which indicats sign of bear trap.
• Bears tried to push below support, but volume did not confirm sustained selling.
• RSI (bottom panel) is in a deeply oversold region and attempting to curl back up with a momentum shift possible.
• Previous swing lows around $3.10–$3.12 held, confirming demand.
Buy:
• Entry Zone (Buy): $3.12 – $3.15 (current levels)
• Stop Loss: Below $3.05 (decisive breakdown level)
• Targets:
• T1: $3.22
• T2: $3.28
• T3: $3.34–$3.38 (major resistance supply zone)
Logic:
• The false breakdown below $3.12 triggered short positions (bears trapped).
• If price sustains above $3.12–$3.15, trapped shorts may cover, fueling an upside bounce.
• Risk–reward here is favorable since SL is tight (~10 cents risk for 20–25+ cents potential gain).

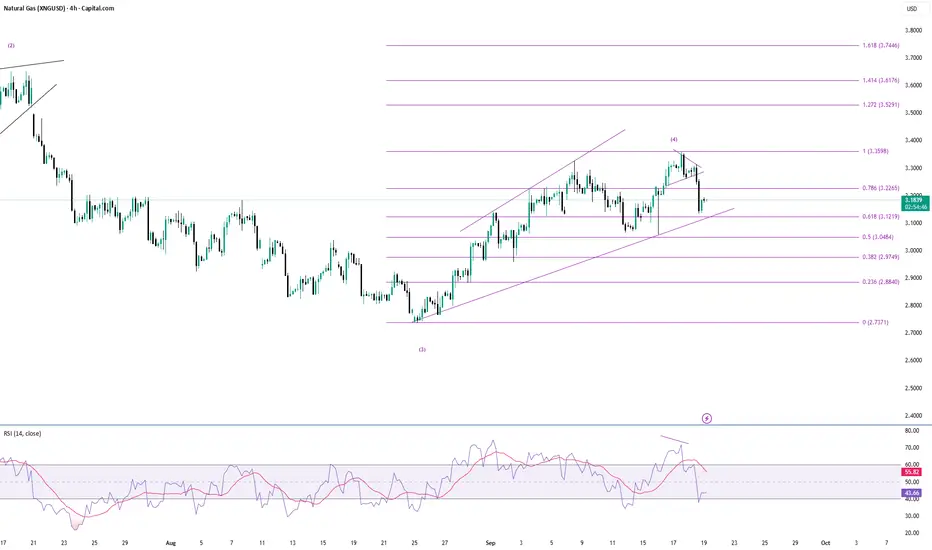
Natural Gas another leg of correction?Looks like natural gas is taking support at the 0.618 level of the previous swing. If this level (3.1228) is broken, we can expect a big move on the down side.
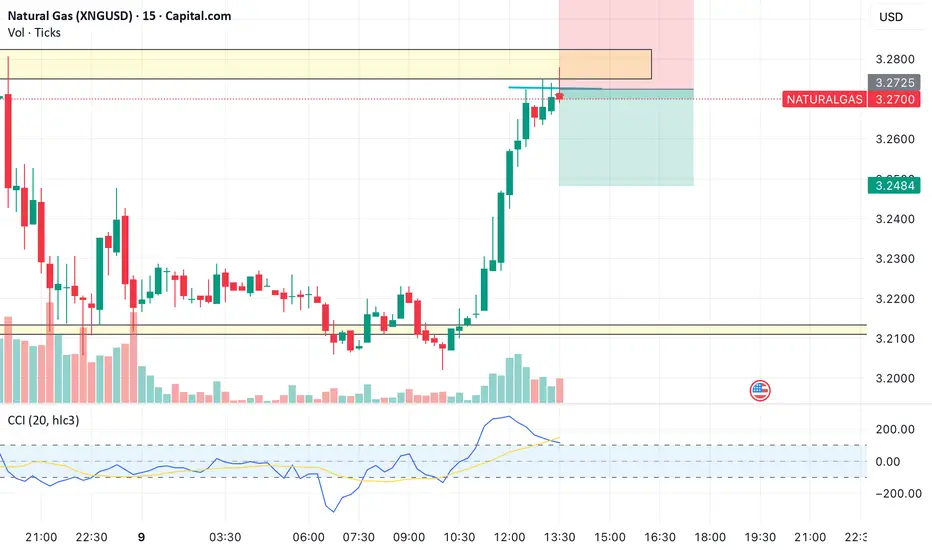
Scalp Shorting opportunity in NG (Risk Appetite High)
• Price: $3.2725 is retesting previous swing high resistance zone (highlighted box).
• Candles: Strong impulsive green candles led price into resistance.
• Volume: Spike during the breakout push, now slowing showing possible exhaustion.
• CCI (20): Was above +100 (overbought) and now rolling down with a negative crossover which is the first sign of bearish momentum shift.
Scalp Short Setup (1:1 RR)
• Entry Trigger: At resistance rejection ($3.2725 area).
• Stop-Loss (SL): Above recent high / resistance box at around $3.2970.
• Target (TP): Equal risk size at around $3.2480 (support + VWAP alignment).
Risk Factors:
• Larger trend is still bullish (based on earlier MA + oscillator analysis).
• This scalp works only if rejection holds. A breakout above $3.2970 invalidates short and could turn into strong continuation long.
This scalp is valid as a short-term contrarian play, but you need to be nimble and exit quickly if momentum shifts.
NG : A FALLING WEDGE BREAKOUT WITH 1:7.5 RR• NG was in downtrend and in a falling wedge for last 2 months
• Today It successfully retest the upper trend line of the wedge and confirming the BO
• A trade with 1:7.5 RR
• SL and the T1 and T2 mentioned in chart.
• Educational purpose only. Happy trading.

Natural gas analysis Monthly Time frameNatural gas markets are influenced by a complex interplay of supply, demand, weather, geopolitical events, and technical factors. Below is a concise analysis based on recent trends and data as of August 24, 2025, covering key aspects of the natural gas market
Price Trends and Market Dynamics
Spot and Futures Prices: The Henry Hub spot price recently fell from $2.92/MMBtu to $2.81/MMBtu, and the September 2025 NYMEX futures contract dropped from $2.828/MMBtu to $2.752/MMBtu. The 12-month futures strip (September 2025–August 2026) averaged $3.501/MMBtu, reflecting a bearish near-term outlook but expectations of tighter balances later.
Supply and DemandSupply: U.S. natural gas production has risen, with a 3% increase in marketed production in 2025, particularly from the Permian (2 Bcf/d), Haynesville, and Appalachia (0.9 Bcf/d each). However, production is expected to stabilize in 2026 as associated gas from oil declines.
Storage: U.S. storage inventories are projected to reach 3,927 Bcf by October 31, 2025, 174 Bcf above the five-year average, due to higher-than-average injections (20% above the five-year average). This surplus is pressuring prices downward.
Demand: Cool weather forecasts for August 2025, potentially the coolest in 50 years, have reduced demand, contributing to bearish price sentiment. However, LNG exports are rebounding, with Freeport LNG operations resuming, providing some support.
LNG Exports: Maintenance at U.S. LNG terminals earlier in 2025 reduced exports, but recovery and new contracts (e.g., ConocoPhillips’ 4 Mt/y from Port Arthur LNG Phase 2) signal growing export potential.
Technical AnalysisBearish Signals: Technical indicators suggest a "strong sell" for Natural Gas Futures across multiple timeframes (daily, weekly, monthly), driven by a head-and-shoulders pattern with prices breaking below the $3.050 neckline, targeting $2.220–$2.000.
Indicators: RSI, MACD, and stochastic oscillators indicate oversold conditions, but negative momentum persists below key resistance levels like $3.100–$3.320. Pivot points and moving averages reinforce bearish trends, with potential support at $2.200.
Geopolitical and Structural FactorsEurope: The 2022–2023 Russian supply shock shifted Europe to rely on LNG, increasing price volatility. Market reforms have boosted trading volumes (7,300 bcm in 2024, 15x demand), but derivatives trading by physical players dominates, limiting speculative impacts.
Weather Impact: Cooling in the Midwest and Northeast (highs of 60s–80s°F) contrasts with hotter conditions elsewhere (80s–100s°F), driving regional demand differences. Weather models (ECMWF, GFS) forecast continued impacts on heating and cooling degree days, affecting prices.
Energy Transition: Natural gas is increasingly vital for electricity generation as coal phases out, linking gas and power markets and amplifying price sensitivity to weather and demand.
Forecast and OutlookShort-Term (1–6 Weeks): Bearish due to high storage, weak demand from cool weather, and technical indicators. Prices may test support at $2.220–$2.080,
Long-Term: Growing U.S. electricity demand (31% over 15 years) and constrained global supply (e.g., limited OPEC spare capacity) suggest bullish prospects for natural gas as a reliable fuel.
Trading ConsiderationsRisks: High volatility, weather-driven demand shifts, and geopolitical uncertainties (e.g., Russia-Ukraine tensions) pose risks.
Strategies: Traders may consider short positions targeting $2.80, but oversold conditions suggest caution for potential reversals. Long-term investors might accumulate near support zones ($2.220–$2.080) for 2026 upside.
Data Tools: Monitor EIA storage reports, weather forecasts (NatGasWeather.com), and technical indicators (RSI, MACD) for real-time insights.
Note: Trading involves high risks, and past performance does not guarantee future results. Always conduct your own research.
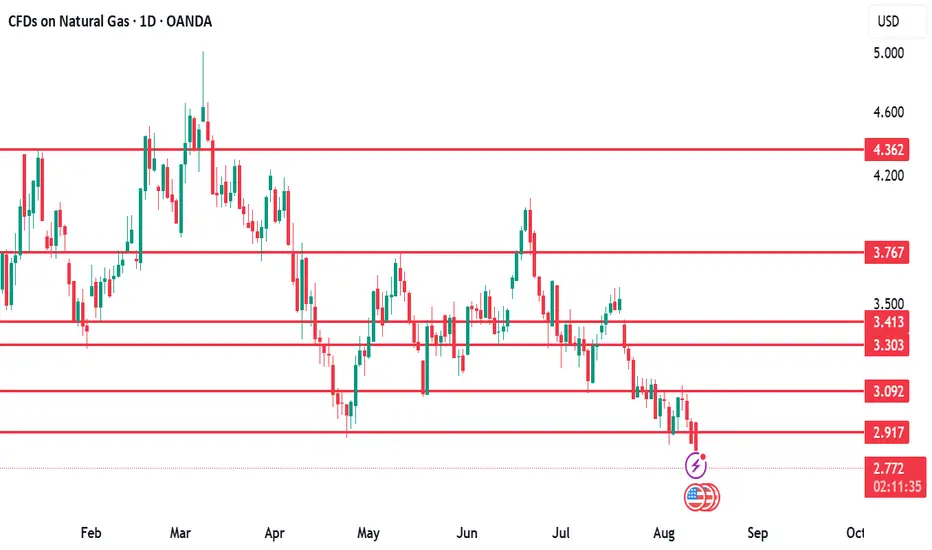
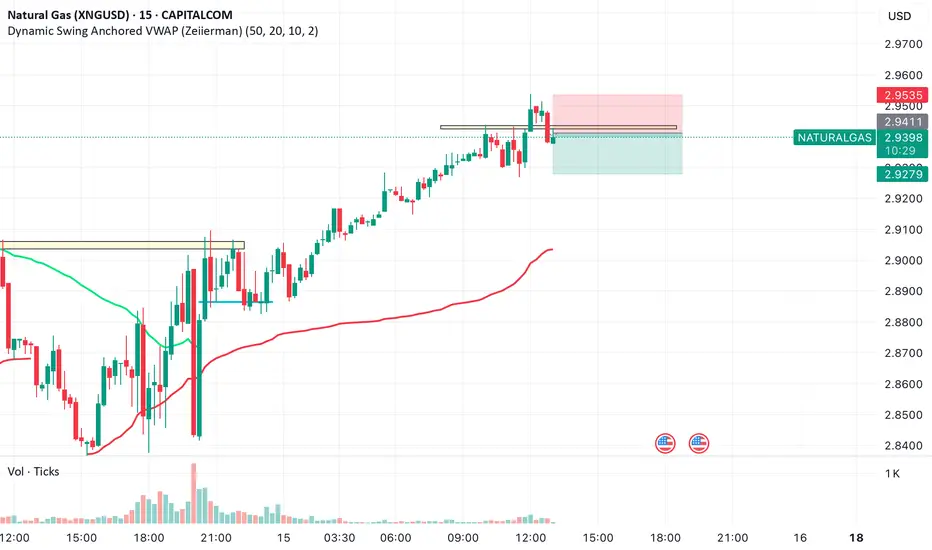
Gas shorting Opportunity again Initiating a short position on Natural Gas (XNGUSD) at $2.919 after a clean breakdown from the rising trendline. Price has slipped below intraday support and is now testing the 50-period anchored VWAP.
Entry: $2.919
Stop Loss: $2.931 (above resistance zone)
Target: $2.883 (near next support)
Bearish momentum building as buyers fail to reclaim trendline. Trade sized for controlled risk.

Scalp in Gas
Scalp Short Plan:
• Entry: Below 2.9390 (confirmation candle close)
• Stop Loss: 2.9465 (above the rejection wick)
• Target 1: 2.9320
• Target 2: 2.9280 (close scalp here unless strong momentum continues)
Since this is a scalp, the idea is quick in-and-out, preferably within 3–5 candles, to avoid getting caught if bulls defend the VWAP which is still far.
Natural Gas Poised for Upside — Target 3.303Natural gas is showing strong buying momentum in the daily trend, and we expect a potential upside in the coming sessions with a short-term target of 3.303."