Natural Gas - Open Market Analysis
Please read the notes as mentioned on the chart.
Time candles which will make waves today
3-21-24 6:14 AM
3-21-24 10:40 AM
3-21-24 3:06 PM (Pivotal)
3-21-24 7:33 PM
Out of the above 3:06 PM candle is pivotal and will decide future trend.
Disclaimer:
I am not a Registered Analyst with any of the National/International agency and it is only for educational purposes. Please consult your financial advisor before making any decision. I will not be responsible for any of your profits or losses.
Trade ideas

Natural Gas - Bullish live market analysis
Presented is the Elliot wave structure of commodity concerned.
Bullish above 1.8 USD and 144 in INR.
Disclaimer:
I am not a registered analyst with any of the National/International agency. It is only for educational purposes.

Natural Gas - Live Market Analysis
Please read the notes as mentioned on the chart/
Time candles for today morning session are
3-19-24 12:59 AM
3-19-24 5:25 AM
3-19-24 9:51 AM (Pivotal) Buy above and sell below
3-19-24 2:18 PM
Disclaimer:
I am not a Registered Analyst with any of the National/International agency and it is only for educational purposes. Please consult your financial advisor before making any decision. I will not be responsible for any of your profits or losses.

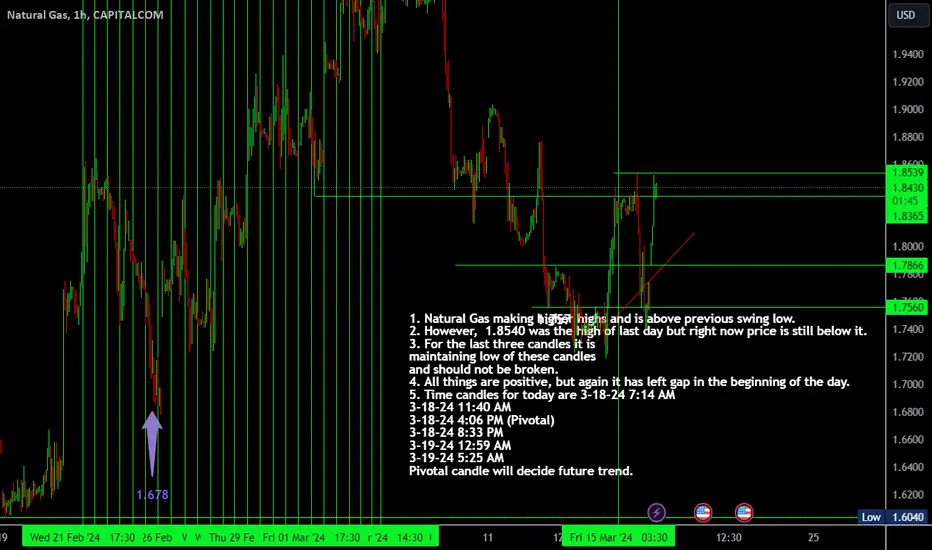
Natural Gas - Live Market Analysis1. Natural Gas making higher highs and is above previous swing low.
2. However, 1.8540 was the high of last day but right now price is still below it.
3. For the last three candles it is maintaining low of these candles and should not be broken.
4. All things are positive, but again it has left gap in the beginning of the day.
5. Time candles for today are 3-18-24 7:14 AM
3-18-24 11:40 AM
3-18-24 4:06 PM (Pivotal)
3-18-24 8:33 PM
3-19-24 12:59 AM
3-19-24 5:25 AM
Pivotal candle will decide future trend.
Conclusion: Previous day high should be broken and pivotal candle's high should be watche.
Disclaimer:
I am not a Registered Analyst with any of the National/International agency and it is only for educational purposes. Please consult your financial advisor before making any decision. I will not be responsible for any of your profits or losses.
Let you grow. May! I follow you.
#XNGUSD #NaturalGas update || 15 Mar
🕓TimeFrame: 1 hour
Technically: Natural gas found support at 1.740 and rose post-inventory data. Currently moving above the 100EMA, indicating a positive outlook in the 1-hour timeframe. If manage to sustain above 1.889 we will see further upside levels
As per the news:
🔸Nat-gas prices surged after a larger-than-expected inventory drawdown of -9 bcf.
🔸Cooler weather forecasts and short-covering also contributed to the price rally.
🔸However, abundant supplies and reduced LNG exports due to a terminal closure in Texas are still pressuring prices

Natural Gas update - Bullish
As informed earlier, Natural Gas has turned bullish above 1.792 marked by the horizontal line. Do not short Natural Gas any more.
Time candles for tomorrow are
3-15-24 8:14 AM
3-15-24 12:40 PM
3-15-24 5:06 PM (Pivotal) - Will decide the future trend for the commodity.
3-15-24 9:33 PM
3-16-24 1:59 AM
Disclaimer:
I am not a Registered Analyst with any of the National/International agency and it is only for educational purposes. Please consult your financial advisor before making any decision. I will not be responsible for any of your profits or losses.

Natural Gas - update
Please read the notes on the chart. It is in the consolidation mode and will be fully bullish above 1.792. So, have patience and watch for atleast 8 hours today and reversal from 18th March 2024 only.
Disclaimer: I am not a SEBI registered analyst with any of the National/international agency and it is only for educational purposes. Please consult your financial advisor before making any decision. I will not be responsible for any of your profits or losses.

Is Natural gas stagging reversal? 1-2 1-2 wave patterns seen and gap up opening given today. The gap need to sustain and it shouldn't break invalidation level to continue upside momentum.
Disclaimer: There is no guarantee of profits nor exceptions from losses in world of stock Market.
FnO Trading is Highly Risky business you can loose more that your trading capital.
This chart is solely the personal views of my research and development of market it can go wrong as well.
Do your own study or ask your financial advisors before investing/trading blindly.

Natural Gas - Live Market update
Natural Gas making jump start and is trading above 18 SMA. Please read the instructions on the chart above price and time levels today. 3-11-24 6:37 AM candle is pivotal. Buy above high of it and sell below.
Disclaimer:
I am not a Registered Analyst with any of the National/International agency and it is only for educational purposes. Please consult your financial advisor before making any decision. I will not be responsible for any of your profits or losses.
Let you grow. May! I follow you.

Natural Gas - How to trade on Monday
Please refer to notes on the chart. Watch candle of 10:30 a. m. tomorrow and buy above high of this candle else sell.
Disclaimer:
I am not a registered analyst with any of the National/International agency. This is for educational purposes only. Please consult your financial advisor before making any decision.

Summer season for NG, heading lower?A Good short setup in NG with SL of the TL. Summer seasons coming up and can see a decrease in demand for now

Natural Gas - How to trade
Please read the notes as mentioned on the chart and act accordingly.
Disclaimer:
I am not a Registered Analyst with any of the National/ International agency and it is only for educational purposes. Please consult your financial advisor before making any decision. I will not be responsible for any of your profits or losses.
Let you grow. May! I follow you.

Natural Gas - How to trade today
Please read the notes as mentioned on the chart and act accordingly.
Disclaimer:
I am not a Registered Analyst with any of the National/ International agency and it is only for educational purposes. Please consult your financial advisor before making any decision. I will not be responsible for any of your profits or losses.
Let you grow. May! I follow you.

Natural Gas - How to trade on Monday
1. Resistance got created on 29th February 2024. One way to trade is to wait and let it go past high of 2029, but this will make intermediate opportunities lost. That is where the returns are multiplied manifold by the smart money. If we have multiply then we have to follow their steps and do it accordingly. For that, please read the notes as mentioned on the chart and act accordingly.
2. Candle of 11:30 A.M. on Monday will decide the future trend.
Disclaimer:
I am not a Registered Analyst with any National/International agency and it is only for educational purposes. Please consult your financial advisor before making any decision. I will not be responsible for any of your profits or losses.
Let you grow. May! I follow you.

Natural Gas - How to trade today
Please read the notes as mentioned on the chart and act accordingly.
Disclaimer:
I am not a SEBI Registered Analyst and it is only for educational purposes. Please consult your financial advisor before making any decision. I will not be responsible for any of your profits or losses.
Let you grow. May! I follow you.

XNGUSD || Update 28 Feb
Time Frame: 1 Hour
Anticipating a significant breakout of 7% above 1.852. 📈
European natural gas futures rise to around $24.5 per MWh, showing a potential rebound from May 2021 lows.
Mild temperatures until mid-March reduce gas withdrawal rates, maintaining high reserves at 63.8% capacity in Europe.
Lower gas prices may increase demand from Asia, especially impacting LNG supplies.
Potential unexpected outages in Norway pose a risk to market stability despite steady gas flows to Europe.
S

Natural Gas - Live Market update
Please read the notes on the chart and act accordingly. Watch candle of 10.30 a.m. today and buy only above high of that candle or sell below it,
Please stay connected.
Disclaimer:
I am not a SEBI Registered Analyst and it is only for educational purposes.
Let you grow. May! I follow you.

Natural Gas - Game of patience
Please read the notes as mentioned on the chart and act accordingly.
Please stay connected.
Disclaimer:
I am not a Registered Analyst with any of the National/ International Agency and it is only for educational purposes.
Let you grow. May! I follow you.

Natural Gas - How support moves up?
In continuation of today's post on HDFC Bank, I have tried to show here that support is moving up but, still it is below resistance, then when will it happen? that remains unanswered. Wait for another post.
Please stay connected.
Disclaimer:
I am not a SEBI Registered Analyst and it is only for educational purposes.
Let you grow. May! I follow you.

Natural Gas - update
Please read the notes on the chart and act accordingly.
Disclaimer: It is only for educational purposes and I will not be responsible for any of your profits and losses. Please consult your financial advisor before making any decision.

Natural Gas - update
Natural Gas making higher highs. Today's time candles have been provided on the chart. Out of these 2-22-24 12:41 PM (this candle is pivotal). Buy above high of this else sell.
Note: I am not a registered analyst with any of the national/international regulatory agency. Please consult your financial advisor before making any decision. I will not be responsible for any of your profits/losses.
Let you grow. May! I follow you.

Natural Gas - bullish Live Market Analysis
Plotted is my indicator Rekhi144 and it is showing that the resistance has also been broken and fresh support have been created in natural Gas.
Please wait for 3 more candles above support. Next time candles have been reflected on the chart also.
Disclaimer: I am not a Registered Analyst with any of the National/International agencies. Please consult your financial advisor before making any decision.

XNGUSD | Forex | NG Breakout XNGUSD || Update |Feb 21st
Timeframe: 1-hour
After a gap-up opening, Natural Gas (NG) appears to be range-bound.
Strategy: Currently, the trend suggests a move towards the resistance level at 1.861. The price action indicates a consolidation phase, and the market is poised for a potential upward movement.
Key Level: Keep a close eye on the resistance level at 1.861 as a potential target.
This analysis is based on the, providing insights into the current market dynamics for Natural Gas. No financial advise!
