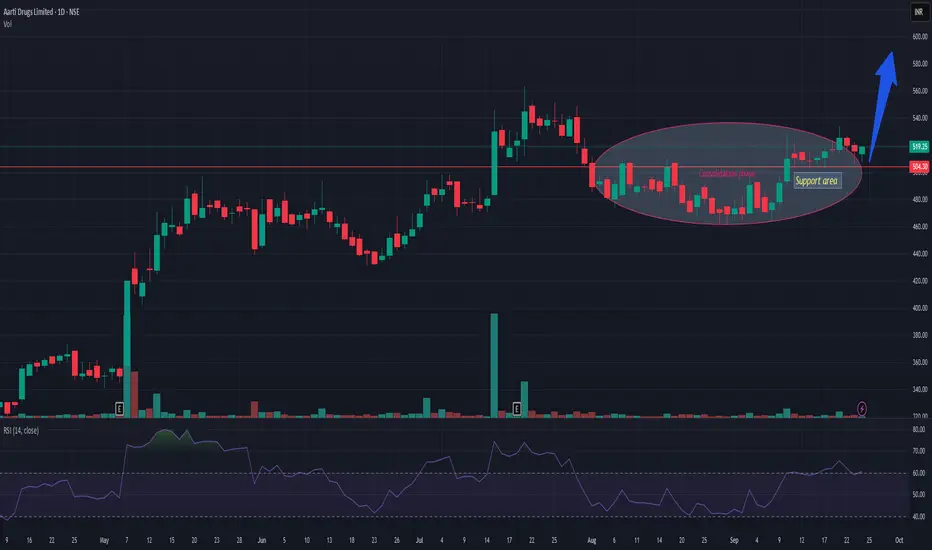
AARTIDRUGSAARTIDRUGS is trading in long consolidation zone with dried volume. Support zone is near 495-500. Currently trading near 515-17. Once it gets market participation then the probability of resuming continuation of uptrend is very high. Risk reward is quite in favor. Keep it in your watch list.
Trade ideas
AARTIDRUGS : Swing Pick ( 1:2 RR Trade)#AARTIDRUGS #momentumstock #breakoutstock
AARTIDRUGS : Swing Trade
>> Good Setup (1: 2 Risk Reward Trade)
>> Good Strength in Stock
>> Volumes Dried up
>> Low PE Stock
Swing Traders can lock profit at 10% and keep Trailing
Please Boost, comment and follow us for more Learnings.
Disc : Charts shared are for learning purpose only, not a Trade recommendation. Do your own research and consult your financial advisor before taking any position.
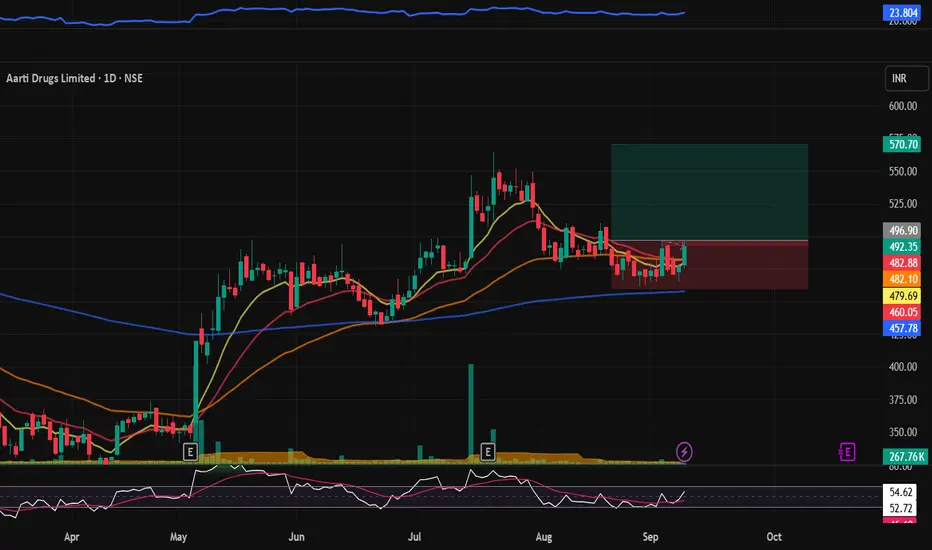
Aarti Drugs Ltd (Daily Timeframe) - Potential BreakOutThe resistance zone (560-570) was breached only once , and thereafter, the stock was in a downtrend for a prolonged duration. Recent past, the stock has been forming Higher Lows & a buildup in volume in the past few days. The stock gained almost 19.5% over the last few days, assisted by huge volume. On Jul 15, the stock BrokeOut of a major resistance with huge volume, and today it tried to breach the long-term resistance.
The Short-term EMAs are in PCO state as well as a Golden Cross-over has formed few days back, which indicates further uptrend.
We should monitor the stock in the coming days for its price action to take a call.

AARTIDRUGS | Inverted Head & ShouldersAarti Drugs (#NSE: #AARTIDRUGS) based on the chart and investment notes.
🔍 Technical Analysis:
🧠 Pattern:
Inverted Head & Shoulders (H&S) – Classic reversal pattern.
Breakout confirmed above the neckline (~₹496), now retesting and holding above ₹523.
Projection: Neckline to Head depth: ~₹184
Target: ₹496 + ₹184 = ₹680–685
🔑 Key Levels:
Support: ₹482(neckline), then ₹440–450
Resistance: ₹644.50 (historical), then ₹683–685 (pattern target)
Volume: Decent rise during breakout, confirming strength.
📉 Risk:
If the price breaks back below ₹496 with volume, the setup weakens.
Keep stop-loss below ₹468 swing low.
💹 Fundamental Insights :
Metric Comment
🏗️ Capex ₹600 Cr completed, expansion nearly done 🔁 Turnover 2.5x → Significant revenue efficiency 💰 Revenue Impact ₹1500 Cr new capacity to kick in 📈 Margin Expansion - Utilization to improve → better margins
💹 Return Ratios RoCE and RoE likely to improve
💵 Shareholder Returns 15–30% of PAT to be distributed
🧠 Interpretation:
Capex cycle ending = lower costs + higher output.
ROCE + RoE expansion + PAT payout = strong re-rating candidate.
Operating leverage + volume growth = multi-quarter compounding story.
📆 What to Expect Next Week (22–26 July 2025):
Scenario Expectation
📈 Bullish (likely)
Follow-through rally toward ₹550–₹575 in short term
🔄 Sideways
Retest ₹496–510 zone before heading higher
📉 Bearish (low chance)
Breakdown below ₹496 would delay the up move
✅ Summary:
Factor Signal Chart
✅ Inverted H&S breakout
Fundamentals
✅ Strong capex-led growth + margin + return expansion
Volume
✅ Supporting breakout
Risk Management
Use SL below ₹468
Short-term Target
₹550–575
Medium-term Target
₹644–683

aarti pharma past winner studyaarti pharma past winner study- how the stock moved , from what levels , how it behaved around key MAs

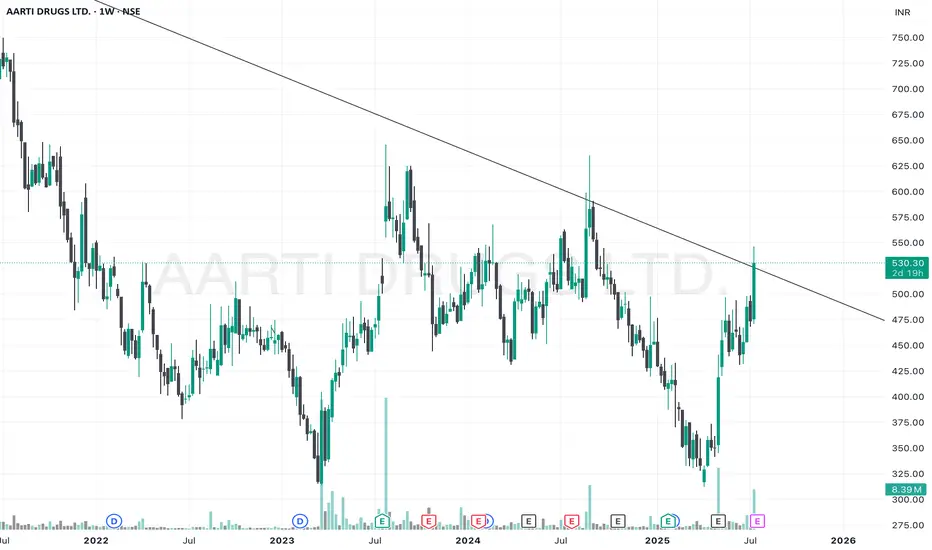
Aarti Drugs – Trendline Breakout in Play
📈 Aarti Drugs – Trendline Breakout in Play
Price breaks above key descending trendline after sideways action. Signs of accumulation visible. Breakout may trigger a fresh upside rally.
⚠️ Watch for retest and continuation for a high-probability entry.
AARTIDRUGSAARTIDRUGS is crossing the resistance, moving above 9-20EMAs.
Now there is probability of an upside move, keep watching.
✅ If you like my analysis, please follow me as a token of appreciation :)
in.tradingview.com/u/SatpalS/
📌 For learning and educational purposes only, not a recommendation. Please consult your financial advisor before investing.
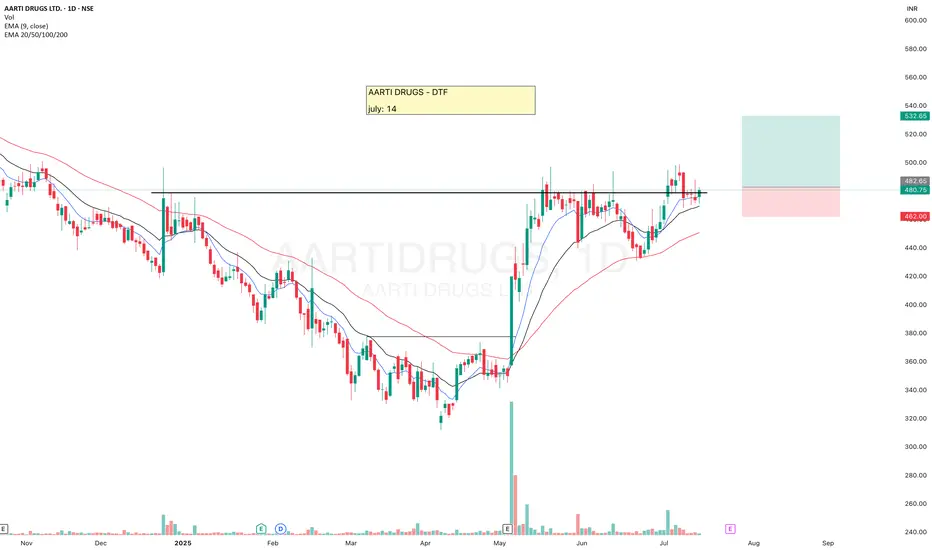
Aarti drugs Short Term TradeA breakout has occurred through the resistance of 502 , after a head and shoulder pattern with neckline of the same level,
surge in volume and atr provides confirmation,
For a short term trade,
tgt 571, sl 504

Aarti Drugs - Wedge BreakoutAarti Drugs looking to breakout in upcoming month. Wedge formation. Candle & RSI breakout nearby. Monthly chart looks good with big upside potential. Not a recommendation.

BUY TODAY SELL TOMORROW for 5%DON’T HAVE TIME TO MANAGE YOUR TRADES?
- Take BTST trades at 3:25 pm every day
- Try to exit by taking 4-7% profit of each trade
- SL can also be maintained as closing below the low of the breakout candle
Now, why do I prefer BTST over swing trades? The primary reason is that I have observed that 90% of the stocks give most of the movement in just 1-2 days and the rest of the time they either consolidate or fall
Trendline Breakout in AARTIDRUGS
BUY TODAY SELL TOMORROW for 5%

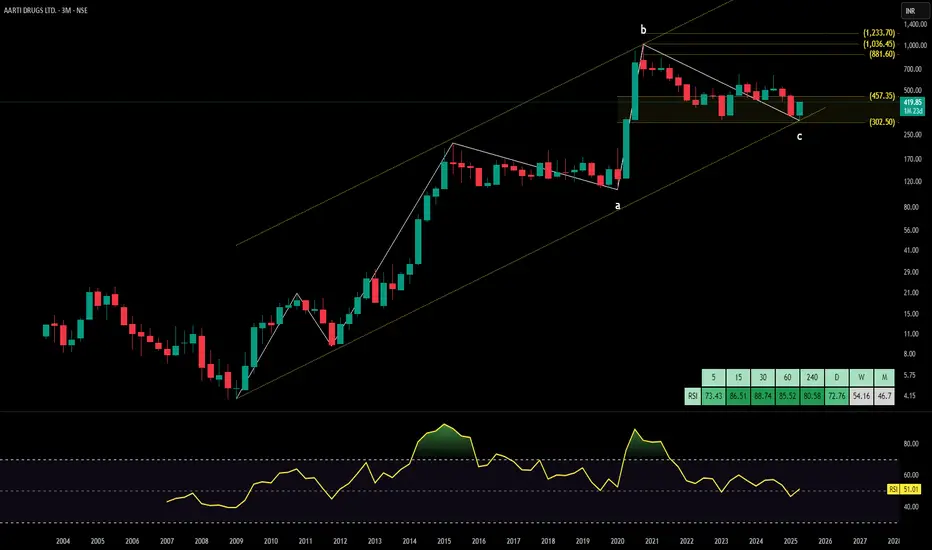
AARTI DRUGS technical analysisAarti Drugs Ltd. (NSE: AARTIDRUGS) is currently priced at INR 419.85. The company operates in the pharmaceutical sector, specializing in the manufacturing of bulk drugs, active pharmaceutical ingredients (APIs), and formulations.
Key Levels
Support Level: INR 302.50
Swing Level: INR 437.35
Possible Upside Levels: INR 586.30, INR 881.60, INR 1,036.45, INR 1,233.70
Technical Indicators
RSI: The Relative Strength Index (RSI) is currently at 51.01, indicating neutral momentum. RSI values between 30 and 70 typically suggest that the stock is neither overbought nor oversold.
Volume: The trading volume stands at 12.36M, reflecting moderate activity. Higher volume during price increases signals strong buying interest, while lower volume during declines suggests weak selling pressure.
Sector and Market Context
Aarti Drugs Ltd. operates within the pharmaceutical sector, which has demonstrated resilience and growth potential, particularly in the wake of increased healthcare demand. The broader market trends indicate cautious optimism, with investors seeking stable and growth-oriented stocks. The pharmaceutical sector is expected to benefit from ongoing healthcare advancements, regulatory support, and increasing demand for APIs and formulations. However, global economic conditions and sector-specific challenges may influence stock performance.
Risk Considerations
Regulatory Changes: Any modifications in pharmaceutical regulations or policies could impact the company’s operations and profitability.
Market Competition: The pharmaceutical space is highly competitive, with new entrants and existing players posing challenges.
Economic Factors: Macroeconomic conditions, such as inflation and currency fluctuations, can influence the stock’s performance.
Company-Specific Risks: Operational challenges, product recalls, or negative clinical trial results can adversely affect the stock price.
Analysis Summary
Aarti Drugs Ltd. exhibits growth potential within the pharmaceutical sector, supported by its strong presence in API manufacturing. The stock is currently in a neutral momentum phase, with key levels indicating possible upside opportunities. Investors should weigh the risks associated with market volatility, regulatory changes, competitive pressure, and economic factors. A balanced approach, considering both growth prospects and associated risks, is advisable for making informed investment decisions.
Trend Reversal in Aarti DrugsNSE:AARTIDRUGS is showing signs of Trend Reversal Although Still below 100 DSMA and Key Levels if it closes above it and Sustains Those Levels We can see New Highs Quickly, as it broke a Major Trendline with MACD Showing Buy Signal.
Today it increased by 12% on the back of US FDA Clearance of its API Facility at Tarapur.
📌Thank you for exploring my idea! I hope you found it valuable.
🙏FLLOW for more
👍BOOST if useful
✍️COMMENT Below your views.
Meanwhile, check out my other stock ideas below until this trade is activated. I would love your feedback.
Disclaimer: This analysis is intended solely for informational and educational purposes and should not be interpreted as financial advice. It is advisable to consult a qualified financial advisor or conduct thorough research before making investment decisions.

Bullish run Can start in Aarti drugsPerfect buying range is 480 to 510.
Strong technicals supported by strong fundamentals .
Mid term holding can give 10% profit from here in 3 to 6 month range
long term holding target is 970 atleast in span of 1 to 2 years.

Aarti Drugs - Fibonacci Retracement ToolWe have used fibonacci retracement tool to check the retracement of price. The price has reached 0.382 and once cross this, we can see change of trend. We can also see the EMA20 about to cross EMA200, which will show bullishness in the stock. The fibonacci at 0.5 level, 0.618 as resistances, and on crossing each resistance we can see price moving up.
Other factors:
1. MACD about to be positive
2. RSI is a bit down, however, we can expect it to move above
3. Volume candles; buy candles are bigger than sell candles
"Clean Charts, Easy Charts"
Learning & Earning!!
Cheers!!

AARTI Drugs CMP 530Forming a good Pattern
Only hurdle is near 570
Can be a buy on dip, with a SL of 494
Expecting 650, 800+++
It's just a view, not any recommendations.


AARTI DRUGS - Price Observation & OverviewPrice Observation & Overview:
1. Currently reacting from the supply zone and trendline.
2. Volumes are dry!
3. Earnings are weak.
4. Buying strength is lacking at the moment.
Plan:
1. Wait and observer.
2. Will try to update a follow-up review post in the next week if found anything interesting and significant...
- Stay tuned for further insights, updates and trade safely!
- If you liked the analysis, don't forget to leave a comment and boost the post. Happy trading!
Disclaimer: This is NOT a buy/sell recommendation. This post is meant for learning purposes only. Please, do your due diligence before investing.
Thanks & Regards,
Anubrata Ray

AARTI DRUGS - Monthly Chart - LongAarti Drugs Ltd (NSE: AARTIDRUGS) has been trading within a well-defined parallel channel on the monthly timeframe since 2009. The stock is currently at the bottom of the channel, having successfully retested the channel support. This retest could signify a potential bounce, presenting a long-term buying opportunity.
The RSI is also on an upward trajectory.
Sharing this analysis for Long-Term investors.
Disclaimer: This analysis is for informational purposes only and should not be considered financial advice. Always conduct your own research before making any investment decisions.

Bullish signal 800+ targetBullish signal. May be consolidated some month but jan 2025 it will give top return tringle shaped consolidated goining on in this share ,
After fake breakout it will fly against fake breakout side

AARTIDRUGS [descending triangle pattern bullish]I try new swing trading strategy .. if it work then explain everything to you . all trg open , SL always paid
1) Descending Trendline Breakout: The stock price has broken above a descending trendline, which is a bullish signal. This indicates a potential change in trend from bearish to bullish.
2)Support Zone : There is a significant support zone marked in red between approximately 440 and 470. The stock has tested this zone multiple times and has recently bounced back, suggesting strong support.
3)The stock has just broken out of the descending trendline and is currently around 511.70. This breakout needs to be confirmed with continued upward movement and volume is above of 20ma line like good signal .
4)Based on the chart and technical analysis provided, Aarti Drugs shows potential bullish momentum with targets at 560 and 620. However, it is important to monitor the stock for continued upward movement and volume to confirm the breakout. Keep an eye on the support zones as well to manage risk effectively.
for MORE check in my TradingView ID
If You LIKE👌👌 MY Idea ......Boost.🔥🔥🔥.. its.
"Disclosure : I am not Sebi-registered." This channel is for only educational purpose. Any profit/loss, I am not responsible.
Before taking any trade on our charts / calls, please consult your financial advisors. Thanks

waiting for Breakoutit has a strong resistance at the trendline, wait for the B'out. can see 100pts move

Long consolidation, some more time for a good breakoutEnter if it closes above 780 in weekly and daily chart
SL 675
Target: will update according to trend
SL will be activated only after entry condition is satisfied.
Note: Trade at your own risk.

AARTI DRUGS LTDAARTI DRUGS LTD my view is bullish .
I INVESTED IN CMP@485
First target@570
Second target@650
SL@422
