ABB monthly chart form Bearish engulf and double top.NSE:ABB
ABB under watch . Check for Cup and handle formation on weekly/ daily chart as double top has formed.
ABB trade ideas

ABB, Getting readyABB
setting up good in resistance area.
Will wait for a clear breakout or breakdown to trade. !!
#vr

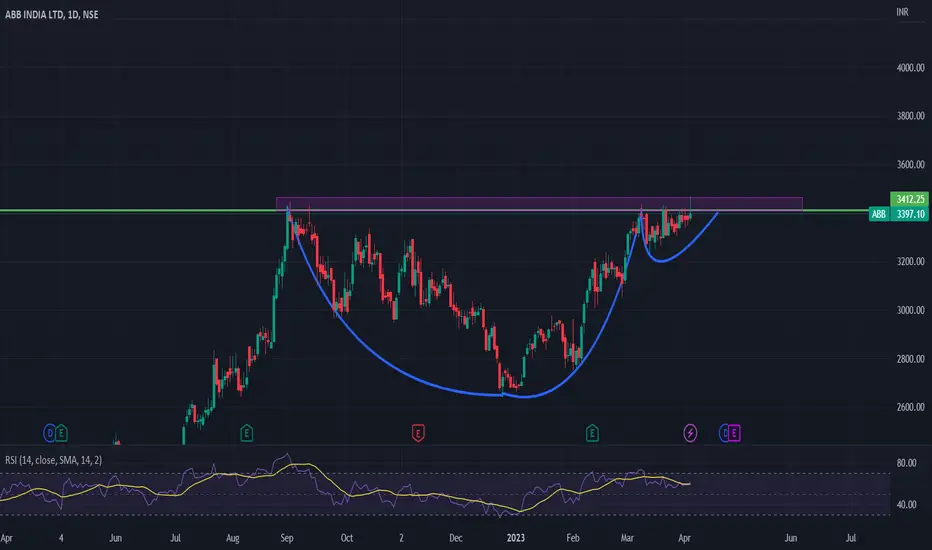
Bullish Chart Pattern Alert:ABB India Ready for liftoff ?Description: ABB India stock has formed a saucer with handle pattern on the chart, which is a bullish chart pattern indicating a potential buying opportunity. The saucer shape shows a gradual bottoming out of the stock price followed by a period of consolidation, while the handle represents a brief period of retracement. The stock is currently trading near the breakout level, which is the resistance line connecting the highs of the saucer pattern. If the price breaks above this 3468 level , it could signal a further upward move in the stock price. Traders can consider going long on the stock once the breakout occurs, and set stop-loss levels below the handle to manage risk. As always, it's important to conduct your own analysis and assess your risk tolerance before making any trading decisions.
Note: Please note that I am not a SEBI-registered financial advisor, and any trade ideas shared are solely for educational purposes. Trading in the financial markets carries a high level of risk and may not be suitable for all investors. It is important to conduct your own research and analysis and make trading decisions based on your own risk appetite and financial situation. Any trades you decide to make based on the information provided are at your own risk, and I am not liable for any losses incurred. NSE:ABB
ABBABB:- Rounding bottom is formed, wait for the breakout, till then keep an eye
Hello traders,
As always, simple and neat charts so everyone can understand and not make it too complicated.
rest details mentioned in the chart.
will be posting more such ideas like this. Until that, like share and follow :)
check my other ideas to get to know about all the successful trades based on price action.
Thanks,
Ajay.
keep learning and keep earning.

ABB- Swing Sell IdeaABB
Sell-Below 3365
Sl-3470
T- 3200 2987
Stocks is at resistance and signs of reversal can be spotted. Reversal will be confirmed below the sell level.


ABB Cmp 3274 dated 13-3-2023 Bearish Engulfing @ ResistanceABB Cmp 3274 dated 13-3-2023
1. Bearish Engulfing Candle @ Resistance
2. Trendline breakdown @ 3235
3. RSI breakdown
Sell below 3265 for target 3220-3130-3060-3000 SL 3370
It is just a view, please trade at your own risk.

ABB correction completeCorrection in ABB is complete.
Took support at 200MA which is its regular support area.
Also made a higher high.
Buy on dips....

Double top pattern reversal in ABBABB
Key highlights: 💡
✅On 1D Time Frame Stock Showing Reversal of double top Pattern .
✅ It can give movement upto the Reversal target of below 2655-.
✅Can Go Long in this stock by placing a stop loss above 3460+.


ABB INDIA--BULLISH~All the information given in the chart is for the educational purpose only.
~Do your own research before investing.
~This is not my recommendation.
~My recommendation--LEARN MORE EARN MORE.


ABB - Ichimoku Bullish Breakout Stock Name - Abb India Limited
Ichimoku Cloud Setup :
1). Today's close is above the Conversion Line
2). Future Kumo is Turning Bullish
3). Chikou span is slanting upwards
All these parameters are showing bullishness at Current Market Price
and more bullishness AFTER crossing 3247
#This is not Buy and Sell recommendation to any one. This is for education purpose and a helping hand to learn trading in Market.
# Cloud Trading
# Ichimoku Cloud
# Ichimoku Followers
I hope you all like my analysis.
Please do share your thoughts into comment section.
Please give a like, share & subscribe for daily analysis.

low cheat entry1. ABB is in uptrend
2. 23% retracement from top
3. short and long term RS positive and uptrending
4. second base in making
5. tight flag pattern for trade

Abb - At BreakoutThe chart setup clearly shows that the stock is near the breakout level. If fails to do so, may come down around 2940/2840.
keep an eye.
Only for learning and sharing purposes, not a piece of trading advice in any form.
All the best.

ABB Cmp 2832 dated 2-2-2023ABB Cmp 2832 dated 2-2-2023
1. Triangle formation
2.RSI Divergence
Buy @ Cmp for target 2865-2900-2950-3000-3050
SL 2750
Disclaimer :
I am not a SEBI registered Analyst so please do your own Analysis before taking any action.
The above view is shared just for educational purpose.
By no means shall be responsible for any losses amounting out of it incase if any trades on it.
It is just a view, please trade at your own risk.

ABB 2805 is the best buying level ABB 2805 is the best buying so please check the levels
And studying buying

ABB INDIA LTD. inverse head and sholder pattern looking good for up side , just for eduaction porpose

Abb - Long SetupAll levels are mentioned on the charts if stock sustains above 2900, it may go up to 3050/3080. After crossing 3090 further upward move may come.
Only for learning and sharing purposes, not a bit of trading advice.
Always keep your loss management in your control.
All the best.

#ABBABB Which Support at Previous Levels and Q1 RRG Momentum has something in place
Bullish structure and in Momentum

ABB showing weakening trendABB is seen in a downtrend on daily charts. The downward trending channel seems strong as it has been active since August 2022 and has also been tested many times. ABB can be shorted at around 2933 level to monthly support level of 2693.

Morning star pattern ABBI India Ltd., which is trading inside the parallel channel, is now making a morning star pattern on the support trend line, and there is 200 EMA support on the day chart. Looking at all this, we can expect a bullish trend in the stock.

abb looking bullish for medium termAbb has taken support from fibonacci level and price action suggest a reversal.
