ABBOTINDIA Price Action## Current Price and Recent Movements
ABBOTINDIA is currently trading around ₹34,150–₹34,200, with recent price action showing stability near all-time highs. Over the last year, the stock has risen more than 22%, maintaining strong uptrend momentum. Its 52-week range is ₹25,325 to ₹37,000, reflecting both solid growth and periodic volatility within the healthcare sector.
## Performance and Returns
- **Short-term:** The price has experienced mild negative movement in the latest week but climbed nearly 9% over the last month.
- **Medium-term:** Returns for the last six months stand at roughly 23%, with a 10% advance over the previous quarter.
- **Long-term:** Returns over three years have exceeded 70%, and five-year returns are above 125%, indicating sustained capital appreciation.
## Valuation and Financials
- The stock trades at an elevated price-to-earnings ratio above 51, signaling significant growth expectations already priced in.
- Price-to-book is around 17, considerably higher than the sector average, emphasizing a premium valuation.
- Return on equity remains robust, typically above 35% over recent years, accompanied by consistent increases in earnings per share.
- Dividend yield is attractive at about 1.4%, and the company maintains a high dividend payout ratio, often exceeding 70%.
## Business Strengths
- ABBOTINDIA is almost debt-free, featuring strong operational efficiency and high profitability margins.
- Profit growth has averaged 19% CAGR over the last five years, despite sales growth being more modest.
- The company regularly ranks within the top tier of the healthcare sector for both market capitalization and operational performance.
## Risks and Weaknesses
- At current levels, the stock is considered overvalued relative to its book, earnings, and sector peers.
- Sales growth, while steady, has lagged behind profit expansion, suggesting improvements are driven by margins rather than revenue acceleration.
- The share is nearly 1.8 times as volatile as the broader Nifty index, making it less suitable for risk-averse investors.
## Outlook
ABBOTINDIA continues to deliver on profitability and efficiency, with long-term technical and fundamental momentum strongly intact. Caution is warranted on valuation, as the premium is substantial, but the business fundamentals remain solid. Investors should monitor for sustained sales growth to support ongoing strength in price.
ABBOTINDIA trade ideas

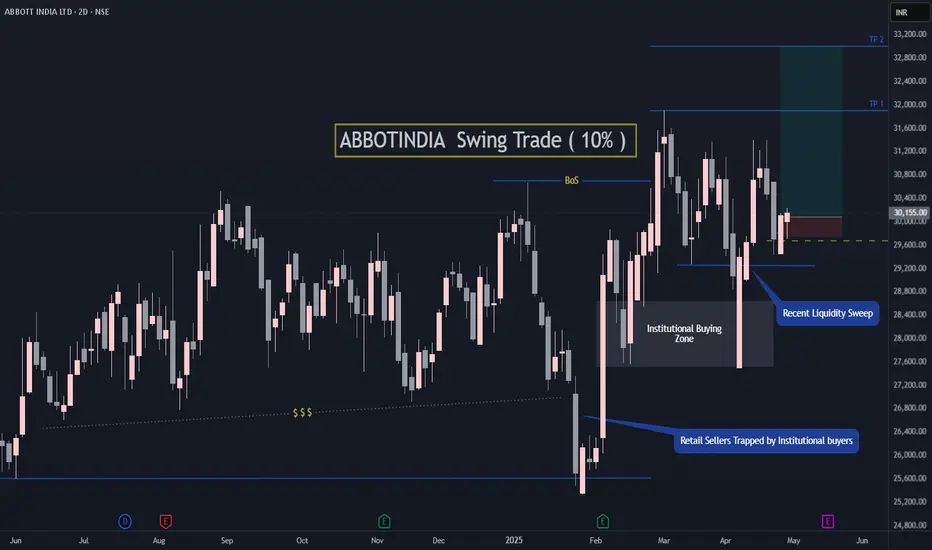
ABBOTINDIA Swing Trade ( 10% upside potential) Abbott India is near to the previous Institutional Buying zone and has upside potential of 10%.
Simple Demand Zone buying setup.
Don't keep hard stop loss. Manage positions as per situation.
Follow for more such setups.
I have been very busy lately because of renovation at home. Will be sharing more setups soon. Thanks.
Abbott india target 34000On weekly charts Abbott india is forming flag and pole pattern. Looks strong on technical charts till now.
Stop loss will be lower end of following flag channel on weekly closing basis.
Once the pattern breakout occurs. Following are the targets -
Target 1 - 31500
Target 2 - 32600
Target 3 - 34000
Don't fall in FOMO mode and wait.


Abbott India Swing TradeOn weekly time frame, sellers are trapped badly in Abbott India which can fuel a good potential up move. Also it has recently grabbed liquidity from previous week low so if Nifty holds above 23000 then there are high chances of Abbott to reach T1 and T2 which will be a 1:5 RR trade.


BUY TODAY SELL TOMORROW for 5% DON’T HAVE TIME TO MANAGE YOUR TRADES?
- Take BTST trades at 3:25 pm every day
- Try to exit by taking 4-7% profit of each trade
- SL can also be maintained as closing below the low of the breakout candle
Now, why do I prefer BTST over swing trades? The primary reason is that I have observed that 90% of the stocks give most of the movement in just 1-2 days and the rest of the time they either consolidate or fall
Resistance Breakout in ABBOTINDIA
BUY TODAY SELL TOMORROW for 5%

ABBOTT INDIA LTD – Channel Breakout The weekly chart of ABBOTT INDIA LTD (NSE) is showing a significant development with a confirmed channel breakout. Along with this breakout, there is a well-defined trade setup with a Risk/Reward ratio of 2.63, making it a compelling opportunity for traders. Let’s analyze the price action and the potential trade scenario.
Breakout Holding Strong – What’s the Next Target?
The price has broken out of the long-term consolidation range and is now trading above 30,600 INR. This breakout signals the potential for a sustained uptrend, provided it holds above key levels.
Target: 35,420 INR (+19.16% upside)
Stop-Loss: 27,557 INR (-7.30% downside)
Risk/Reward Ratio: 2.63
This trade setup presents a favorable risk-to-reward opportunity if the breakout sustains.
Key Technical Indicators Supporting the Move
1. Fibonacci Pivot Levels – Testing R1 Resistance
The price is currently testing the R1 resistance level. A breakout above this level could trigger further upside toward R2 and R3, aligning with the 35,420 INR target.
If rejected at R1, a pullback toward 29,600 INR may occur before another breakout attempt.
2. MACD – Momentum Turning Bullish
The MACD line has crossed above the signal line, confirming upward momentum.
The histogram is turning green, indicating increasing buying pressure.
This confirms that bullish momentum is building, reinforcing the breakout.
3. Volume Confirmation Needed
A breakout is more reliable when supported by strong volume.
If volume remains weak, a pullback before continuation is possible.
Trading Strategy – How to Play This Move?
Bullish Trade Setup (Breakout Confirmation)
Entry: If the price remains above 30,600 INR and breaks R1 convincingly.
Target: 35,420 INR (R3 pivot level).
Stop-Loss: Below 27,557 INR (previous resistance turned support).
Risk/Reward: 2.63, which is a favorable setup for a swing trade.
Bearish Scenario (If Breakout Fails)
If the price rejects R1 and falls back into the channel, a downside move may occur.
Entry for shorts: Below 29,600 INR if price re-enters the consolidation range.
Stop-Loss: Above 31,000 INR.
Targets: S1, S2 (24,800 - 22,600 INR range).
Final Thoughts – Bulls in Control, But Watch the Retest
The breakout appears strong, but it is crucial to see whether the price holds above 30,600 INR or retests before making the next move. If the breakout is sustained, a move toward 35,000+ INR seems likely. However, if the breakout fails, a return to the previous range could present an opportunity for short trades.


Abbott India - Possible end of bullishnessStock reaching daily supply zone
Stock also reaching hourly supply zone also
Hourly zone between 29780 - 29860
Daily zone between 29900 - 30650
As overall market structure is bearish, it is a high
possibility stock may try to reverse from either hourly or daily supply zone
Possible downside expected 28650 / 27500

Abbott India a breakout under formation Abbott India Ltd. is an interesting stock with following
1. RSI on daily and monthly time frames above 60
2. Narrowing Bollinger Bands on weekly chart
3. Strong Bullish Anchor Candle engulfing previous almost 20 candles with strong volume
4. Price trading above all major moving averages
5. Stock consolidating in range of 25360 to 30300 since Jan-2024
Lets See How it Evolves.
Disclaimer: NOT A BUY / SELL RECOMMENDATION. I am not an expert I just share interesting charts here for educational purpose and not to be taken as buy/sell recommendation. Please seek expert opinion before investing and trading as trading/ investing in market is subject to market risks. I do hold some position in the stock as on date and I may look to take some more with my own Risk Reward matrix.

Abbott India - Potential Breakout SetupObservations:
1. Ascending Trendline Support:
Price is forming higher lows, respecting the green ascending trendline, indicating bullish momentum.
The trendline acts as a dynamic support zone.
2. Consolidation Zone:
Price is consolidating just below a key resistance zone around ₹28,165–₹28,200.
A breakout above this level could lead to a strong upward move.
3. RSI Bullish Divergence:
RSI has made higher lows while the price made similar lows, indicating weakening bearish momentum.
RSI currently holds above the 50 level, supporting bullish sentiment.
4. Volume Profile:
Volume near the trendline support has shown spikes, suggesting buying interest.
Reduced volume during consolidation indicates potential accumulation before a breakout.
Confirmation Checklist:
Watch for a bullish candlestick breakout above resistance.
Ensure breakout is accompanied by increased volume.
Confirm strength in RSI (above 60-70) levels

ABBOT INDIAAbbott India, a subsidiary of Abbott Laboratories, has been a prominent player in the Indian healthcare sector since 1910. It specializes in branded generic pharmaceuticals, nutritional products, diagnostics, and medical devices. Known for its focus on women's health, cardiology, diabetes care, and gastroenterology, Abbott India combines global expertise with local market needs. The company operates through owned and third-party manufacturing units and distributes its products across India, maintaining high-quality standards and innovation in healthcare solutions.


Probable downward move.● Abbot have fallen below secondary trend support (rising wedge)
● A head &shoulder formation and probable downside target of 27000 which is support of primary trend line.
●An immediate resistance 27378, i.e weekly candle has not closed below this price for past 20 weeks.
Therefore a weekly close below 27378 might indicate a increasing probability of downside move following the micro down trend.
Study purpose only.
Its always beautifull to see a stocks behavior with probablity mindset.


ABBOTINDIA Premium Stock Ready to FlyHey Family, there is a one more stock Which is showing a great opportunity.
Key Points:-
* Formation of Ascending Triangle Pattern in Daily TF.
* From Feb 2024 to Aug 2024 its in 2,000 Points range.
* From Feb 2024 to Aug 2024 Tested & Moving Near Resistance Many times.
* It's Near resistance Zone and trying to Break Resistance Zone with good volume.
* Volume Accumulation (Volume is Rising).
What is your view please comment it down and also boost the idea this help to motivate us. We are Certified. All views shared on this channel are my personal opinion and is shared for educational purpose and should not be considered advise of any nature.


ABBOTINDIA 1HRINTRADAY TRADE
- EARN WITH ME DAILY 10K-20K –
ABBOTINDIA Looking good for Downside..
When it break level 28609 and sustain.. it will go Downside...
SELL @ 28609
Target
1st 28283
2ND 28121
FUTURE AND OPTION
ABBOTINDIA JUL FUT – LOT 10 (Qty-200)
ABBOTINDIA JUL 29000 PE – LOT 10 (Qty-200) – PRICE (693.20)
Enjoy trading traders.. Keep add this STOCK in your watch list..
Big Investor are welcome..
Like this Post??? Hit like button..!!!
Follow me for FREE Educational Post and Alert..

ABBOTINDIA - Short term trade based on tightness in priceThe analysis is done on Daily TF hence price may take few weeks to few months in order to reach the targets.
Trade setup is explained in image itself.
One should also look at its peers in Pharma sector for more opportunities -
check below charts -
#CIPLA
#STAR
#SANOFI
The above analysis is purely for educational purpose. Traders must do their own study & follow risk management before entering into any trade
Checkout my other ideas to understand how one can earn from stock markets with simple trade setups. Feel Free to comment below this or connect with me for any query or suggestion regarding this stock or Price Action Analysis.


ABBOTINDIA | Rally Base Rally Demand zone 🎯⭕ Swing Trading opportunity ! Daily Chart Alert !!!⭕
======================================================
Technical Reasons to trade or Strategy applied :-
1) After a Major uptrend , Stock is retracing at 0.618 Fib level
2) it Has Rally base rally Demand Zone as well if Holds then expect upside movement for 1:2 RR minimum but if breaks down then it can move to take Trendline Support
3) Volume is increasing as well
4) Trading above 200Ema
Guys check out the related ideas as well, it will work really well GUARANTEED !
🙏FOLLOW for more !
👍LIKE if think is useful !
✍COMMENT Below your view !

Channel Break in Abbot India Hello Trading community, mates and friends sharing today a bullish breakout on Daily time frame for Abbot India a Great Pharma company.
This 10% upside target identified from the previous resistance to previous high and it feels like a good swing trade.
RSI is also in a bullish range with good volume trades on green candles.
I hope you will like and work and give your valuable support to my publication too, Any other questions are most welcome in comment box. Thanks for reading mates.
This idea is meant for only educational purposes, not any kind of trading or investment advice.
