ABBOTINDIA trade ideas

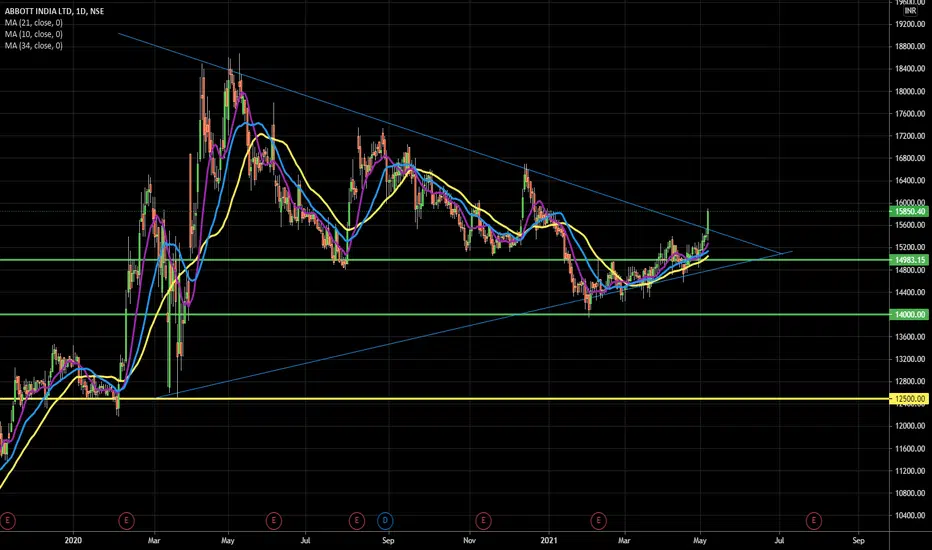
Abbot IndiaAbbot India - Cmp 15850
Breakout from downward trendline on Daily and Weekly time frame. Good support at 14800. Possible targets 0f 16250/17400/18500 are marked on the chart.

Long term opportunity in AbbottGo long above 16401 for Targets 17799, 19203, and 20592 with SL 15003
Reason to go Long :
1. The stock formed a pole & flag pattern and in May month it gave breakout.

Intraday Trade: resistance breakout and sustained buy above 16405 which is previous day high plus 5 points buffer
For stoploss in Intraday use 5 minute chart and see nearest support.
for target use 5 min chart and fibonacci pivots as i don't keep predefined target.
try to book partially and trail.
Note: this is not a prediction for LONG/SHORT, trade will trigger only on given level as per technical analysis
NOTE: For Gapup or bo before 9:20
If gapup is more than 1% from bo level than avoid completely.
if less than 1% or gives bo before 9:20 than wait for
first 5 minute candle and entry above 5 minute candle
and revised SL below candle Low.


Abbot india LongBreaking out of trendline. potential long candidate with good risk reward bcoz of the new box formation

TriangleBreakOut - UnderRetracement - UpwrdTrndMayContinueUpward trend under retracement . As break out has happened continuation of the upward trend likely

ABBOTT finally looking to end the downtrendWith Pharma as a sector is amazing set up, ABBOTT is looking to end the downtrend.
Looking forward to break the trendline.

Abbott India channel breakout and cup and handle in progressAs we can see the channel is broken and now the cup is formed. with handle formation and retest of channel any break above 16300 will lead this to the upper zone as per the path.

Abott India... tringle breakout clear long Tgt ATHYou can go long with 50% qty and another 50% on retracement to the breakout level.
SL Latest swing low WCB. Tgt ATH.
a very good risk reward.
Thank you

Buy Abbot IndiaBuy Abbot India Stoploss 14500 Target 16000
Study: Symmetrical Triangle pattern Breakout and Retest Done + Small Cup & Holder pattern Breakout

Abbot India Falling wedgeAbbott India one of the Portfolio stock was underperformer last many weeks, it has formed falling wedge Pattern on daily chart. Breakout will be good trading opportunity if closes above top trendline and sustains.
(Disclaimer : Study purpose, do your own analysis!)

Abbot India weekly breakout#Abbotindia #weekly #breakout
Clear breakout on monthly chart for long
Educational purpose


ABBOTT INDIA,LONGABBOTT INDIA,DTF,it has given breakout from descending channel pattern after very long consolidation, expect to move upside from this levels

Major BreakoutAbbott India has given a major breakout on the daily charts. It looks bullish on positional basis.
Wedge Pattern Abbott India Limited Weekly ChartStock is making Wedge Pattern : Buy before breakout
Trader Stop Loss below 14500 for Target of 16500 and 17500
Investor with 6 to 12 Months time horizon can buy for New 52 Week High
