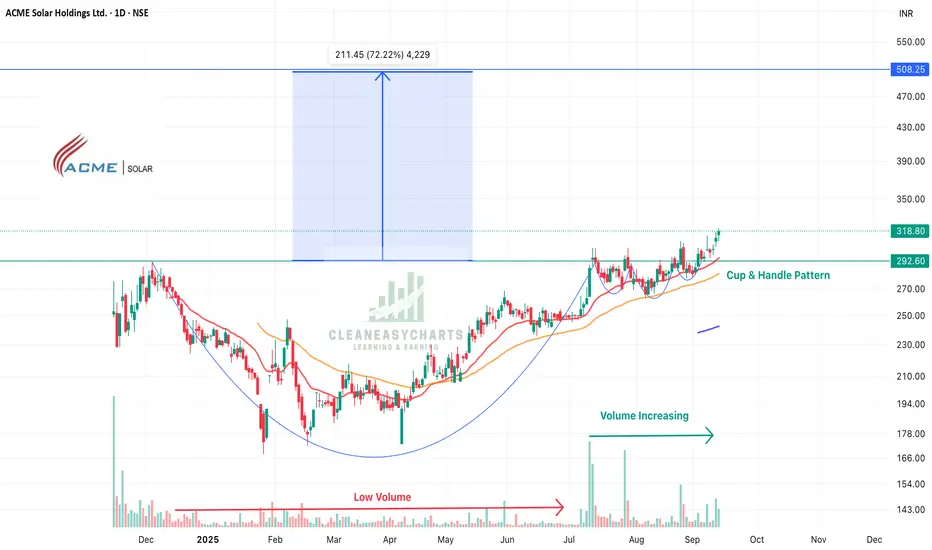
ACME Solar - Cup & Handle Patter + IPO StrategyACME Solar is heading for a 75% jump from current price. Following are the factors:
Technical Analysis:
1. IPO Strategy - The price has crossed the high of its price post listing
2. Volumes during the fall was low and now it has started picking
3. Complex Cup & Handle pattern breakout
Fundamental Analysis:
1. First Independent Power Producing Company in India
2. Super Strategic locations in India
3. Increasing profits year on year
4. Recent 3k cr loan by SBI for its project
Keep following @Cleaneasycharts for more such stocks as we provide "Right Stocks at Right Time at Right Price"
Cheers!!
ACMESOLAR trade ideas
ACME Solar Holdings Ltd – Short-Term Price ProjectionRate for this projection by analyst ⭐️⭐️⭐️⭐️ (4/5)
Current Snapshot
CMP: ~₹313
PE: ~47× (high, premium valuation)
PB: ~4.2× (fairly expensive vs book)
Profit growth strong, but sales growth weak.
Revenue growth modest recently; profit growth strong. E.g., FY25 net profit rose ~130% over FY24, revenue growth ~7.4%.
Interest coverage low → financial risk.
Market optimism: capacity additions, better upcoming quarters.
Short-Term Price Projection (3–6 Months)
Bullish: ₹350 – ₹370
Base Case: ₹300 – ₹330
Bearish: ₹270 – ₹290
Disclaimer: lnkd.in
ACME sola holding1. The price is braking all time high range.
2. The revenue is growing qoq.
3. Operating at >90% margin.
4. RSI >60 in all the time frame (i.e. weekly, monthly, daily)
All above information is for study only.

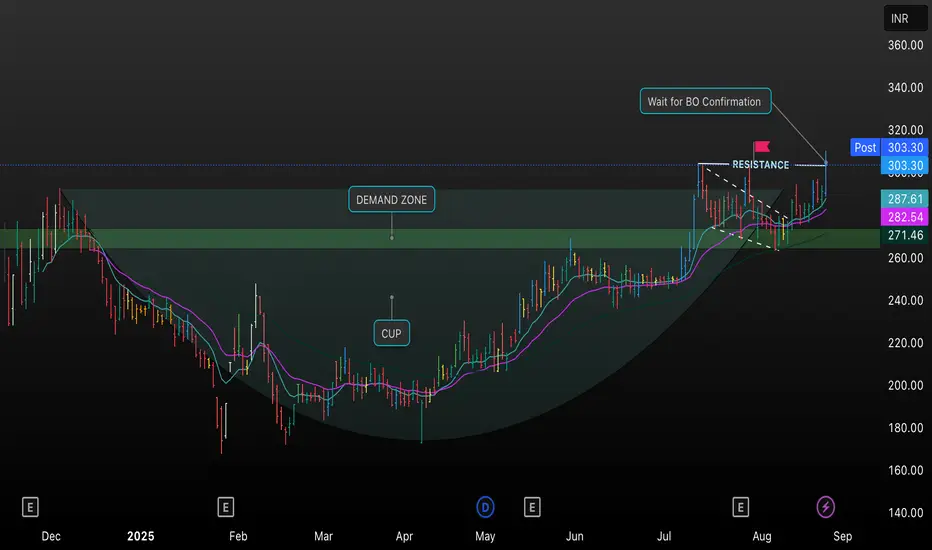
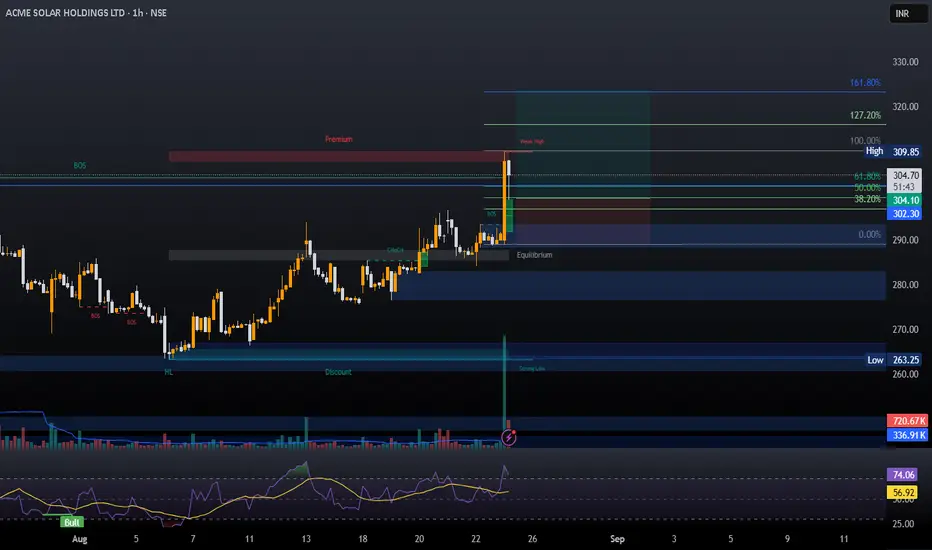
ACME Solar: Cup & Handle Breakout SetupThis TradingView chart analyzes ACME Solar, highlighting a classic Cup & Handle pattern forming since early 2025, with price action consolidating in a defined demand zone before recently breaking through resistance around INR 303.30.
Key elements include buying interest at support levels, the emergence of bullish momentum, and a breakout trigger that traders should confirm before entry. The setup suggests a potential trend reversal, with EMA overlays supporting the upward move while resistance acts as the next critical decision level.
Traders are advised to watch for sustained volume and closing above resistance for reliable breakout confirmation, as indicated on the chart.
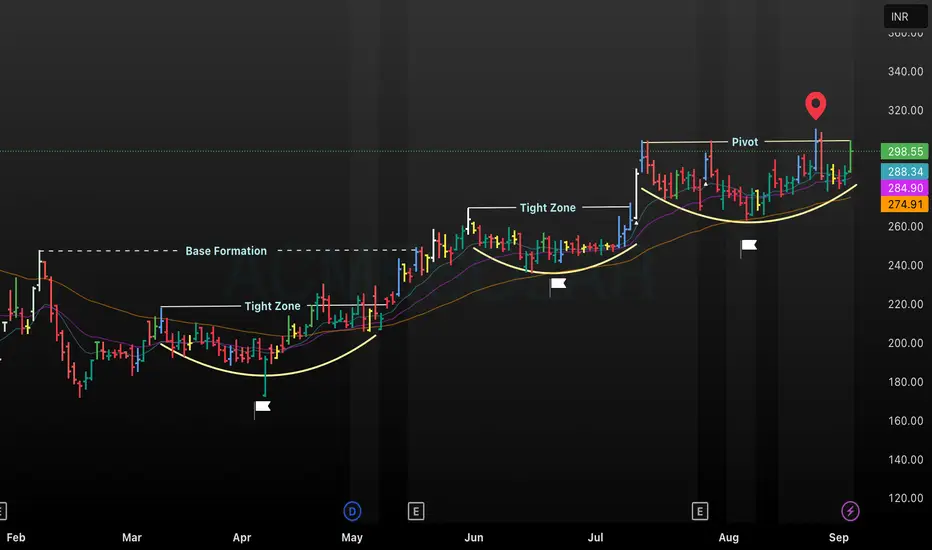
ACMESOLAR : Base Formation, Tight Zones, and Pivot Analysis This chart of ACME shows price action over several months, highlighting key technical levels and zones. A clear base formation is established early, followed by successive tight zones indicating consolidation phases, which often precede breakouts. The pivot level mark signals a critical resistance point, with price action approaching and ultimately breaking out above it. Multiple moving averages are shown for trend context, and all major formations are annotated for quick identification, supporting both educational and trading analysis.
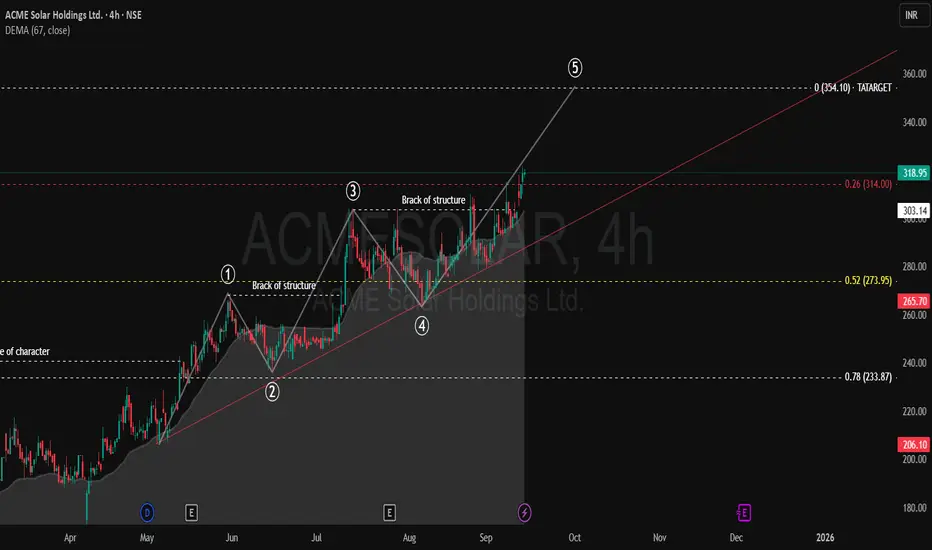
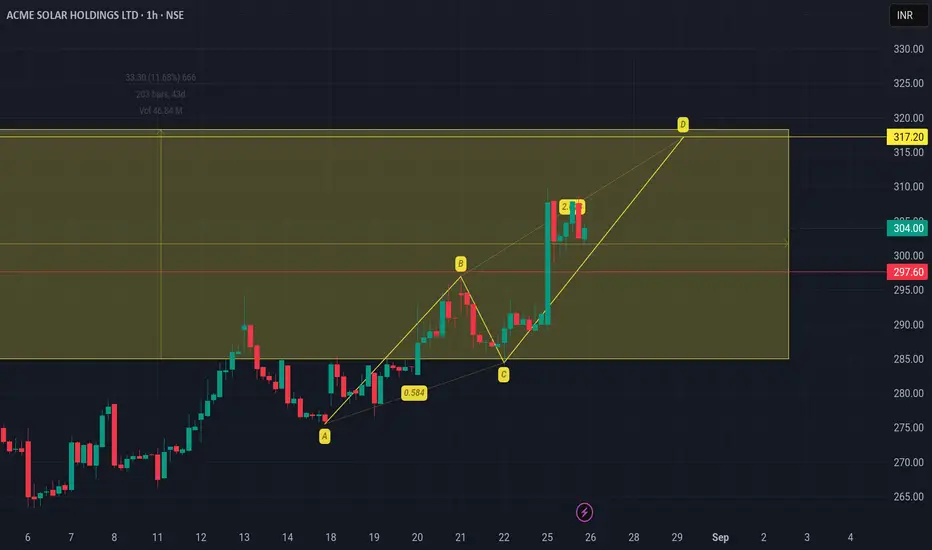
Acme solar will go further up ??As per harmonic PRZ pattern, Acme solar can go upto 317 with stop loss 298 within few days
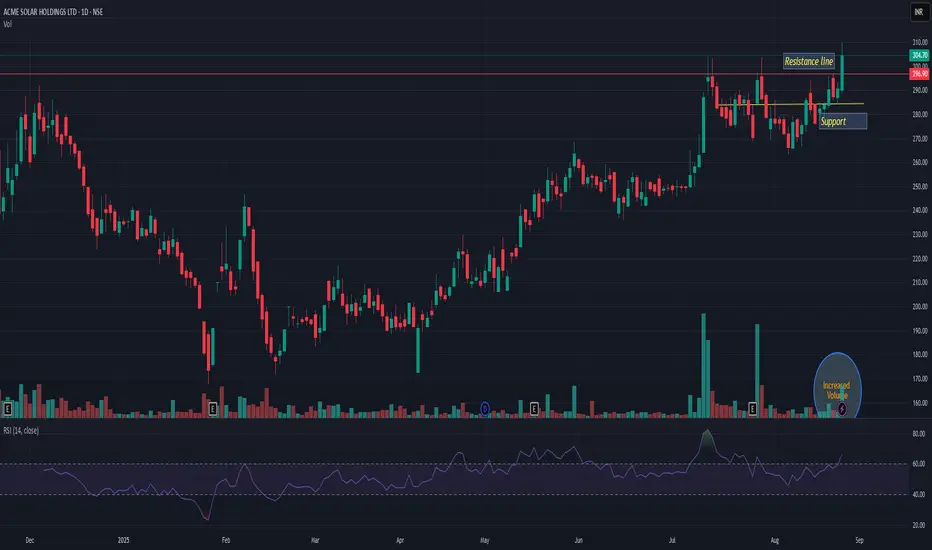
ACMESOLARACMESOLAR giving resistance breakout with decent volume. Support is near 280. Seems like this may take a new ride; trading at ATH. Very high probability that it can add up 12-15% from current level. Its very good risk-reward trade. Keep in yr watchlist
ACME SOLAR IPO BASEEntry- 300-302
Target- 315, 325, 340
Support- 285
Reason- Acme Solar has given a IPO base breakout. One can take a long here with todays low as a SL. It has given a strong closing above its IPO base high. IPO base breakout trade usually has great win ratio. One can also hold it for 25 to 30 percent returns. Keep Check.
Disclaimer- This is just for educational purpose.
Jai Shree Ram.
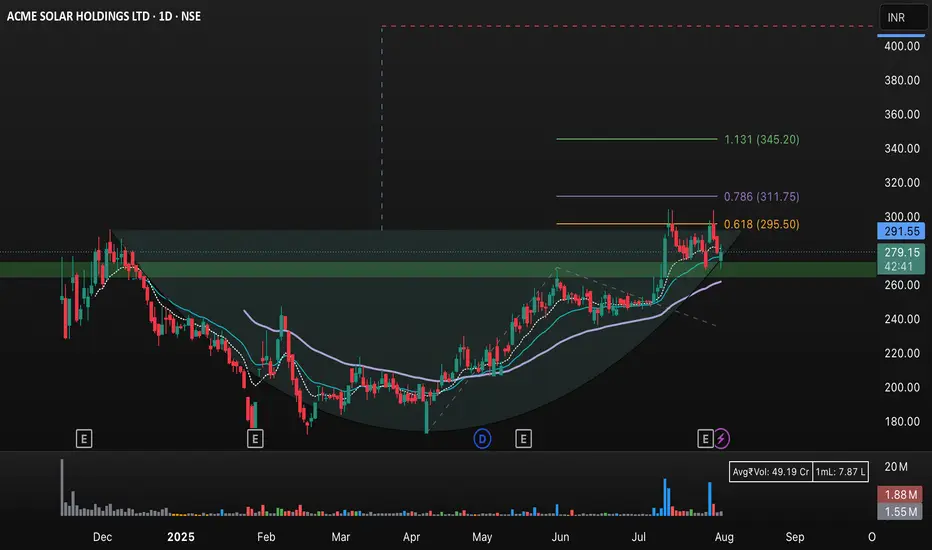
ACME Solar Holdings Ltd (NSE: ACMESOL) – Daily Chart Analysis This image displays the daily candlestick chart of ACME Solar Holdings Ltd (NSE: ACMESO) on TradingView. The chart highlights key technical analysis indicators and chart patterns:
• Fibonacci retracement levels at 0.618 (₹295.50), 0.786 (₹311.75), and an extension to 1.131 (₹345.20).
• Support and resistance zones are shaded green, with significant activity around the ₹260–₹300 range.
• A potential cup-and-handle formation is visible, supporting the bullish momentum.
• The current price is ₹279.50, slightly above the 50- and 200-day moving averages (shown as blue lines).
• Volume bars at the bottom indicate substantial trading activity during recent movement.
• The chart suggests a bullish breakout if the price sustains above resistance, with targets at ₹295.50, ₹311.75, and ₹345.20 based on Fibonacci projections, while ₹260 acts as a critical support.
This setup can be used to monitor future price actions, possible breakouts, and key zones for traders and investors.
ACME SOLAR HOLDINGS LTDACME Solar Holdings Ltd. is currently showing strong bullish momentum, supported by key technical indicators that suggest a positive trend.
Trading volume has been notable at approximately 774,891 shares, indicating increased investor interest. This recent performance, along with the commissioning of their 26.4 MW wind power project in Gujarat, appears to have positively influenced market sentiment.
Investors may want to closely monitor the stock's behavior around the immediate resistance level of 258. If the stock can maintain levels above this point, it could potentially move upwards towards 295.

IPO BreakoutRecent IPO breakout! Stock listed on 13th November and today closed above listing day high.
CMP: 280
Good Range to Buy: 260 to 280
Targets: 325
SL: 250 Daily Close
Disclaimer: This is for educational purposes only, not any recommendations to buy or sell. As I am not SEBI registered, please consult your financial advisor before taking any action.

Acme Solar Holdings LtdIncorporated in 2015, ACME Solar Holdings is a renewable energy company in India with a portfolio of solar, wind, hybrid, and firm and
dispatchable renewable energy (“FDRE”) projects. [
Promoters + 83.41%
FIIs + 6.69%
DIIs + 5.81%
Public + 4.08%
No. of Shareholders 2,07,288.
Target--- 290,300,310,350.. my view.
youtube -- @babatrading
