Adani Port Price action.Adani Grp is in bullish mode. Adani port is at Breakout level. it break major resistance 1000. it can long from here or add more if come 985. it may test 1125 and 1165 soon.
Trade ideas

FLAG POLE BULLISH BREAKOUT IN ADANIPORTBuy Adani port fut above 765 where flag pole breakout confirmation will establish. Target 800/820 and 870. Invalid below 740

AdaniPort: another 22% move?Looks like adani port is moving towards 1024, lets see if that is happening

ADANIPORTS - 3 years consolidation breakoutADANIPORTS
1) Time Frame - Weekly.
2) 3 Years of consolidation breakout happened on 1st week of December 2023 & Now the stock has retraced its breakout point & consolidated 3 weeks & broken and closed today with a strong bullish weekly candle.
3) Recommendation - Strong Buy

Ahead of Supreme Court VerdictWe were bullish on ADANI PORTS in the very beginning and shared the chart analysis in mind....
Here, is just for traders and investors outlook to get better decisions making ahead of supreme court verdict...
Enjoy the Ride ....

flag pattern breakout trading opportunity in ADANIPORTS entry above the line
stop below the line
flag pattern breakout trading opportunity in ADANIPORTS ( anticipation)


Adani port intraday tradesetuphi every one adaniport intraday trade setup
we can but above 1050 closing base and first tp 1150

ADANI PORTS | SELL @ 1080 - 1050Adani Ports has strong resistance zone at 1050 - 1080 and formed a bearish pattern at the top. Sell trade can be initiated in the resistance zone for the marked targets on the chart until 1120 is intact on the upside.
To motivate us, Please like the idea If you agree with the analysis.
Happy Trading!
InvestPro India

ADANIPORT DOUBLE BOTTOM APPROACH ABOVE 770-75 AREAas last time it not closes above 770 ..
this time again trying to cross that area ...
as double bottom pattern approach on daily weekly monthly,
indicator moving average positive way..
one may take risk with appropriate stop out observation or more addition till that level.
market always risky it may sharply go up or down.
decission is ur. risk is ur .
posted as me learning to try price movement trend and pattern with indicators.

adani port long viewadani port on daily chart closing above 772-776-778 area may it take upto 802,
to complete triangle pattern target level.(b.o at 702 for 100 point ).
and already 50% move done.
820-802 area is gapdown. filling this
but monthly closing above previous
highest closing area 776-780 will give more strength.

ADANIPORT good breakoutStage-1 ) Consolidation For almost 3 years
Stage-2 ) Breakout done
Stage-3) Entry while Retest would be good
Good For Swing Trading !!

Adani ports- Chart shared for learning purpose onlyADANI PORTS- Chart shared for learning purpose. Despite hinderburg or whatever negative news, the stock went according to the technicals. Initially it was trading within a range of 260 point as can been seen in the yellow box and after that the box was broken down and went to the desired target of -260 points from the box bottom. The same can bee seen in the red box. within few weeks it came back to its original range. So whatever the news is, most of the time it performs according to the technicals only. very rarely due to panic selling, stocks will go against the technicals.


ADANIPORTS looks good for Swing TradeThe stock had been in a noticeable downtrend pattern, characterized by a series of lower highs. However, in a recent development, the price managed to break above the resistance line formed by connecting these lower highs. This break has resulted in a significant shift in the market dynamics.
The area where the price successfully breached the resistance line has now transformed into a demand zone. This demand zone serves as a pivotal support level, attracting buyers who believe the stock is undervalued at this level.
Interestingly, after reaching the demand zone, the price formed a remarkably bullish candlestick pattern. This candlestick indicates strong buying interest and suggests a robust bullish sentiment in the market.
Considering these developments, it appears that the stock is now primed for a swing trade opportunity. The shift from a downtrend to a bullish breakout, along with the confirmation of a demand zone and bullish candlestick, makes this stock an attractive option for traders looking to capitalize on potential price movements in the upward direction.

Adani ports Highly BearishAdani Ports Broke a uptrend which it could have gone back to but it went even more down and broke a support and sustains below making it bearish

ADANI PORTS ADANI PORTS looking good above796 sl of 734 in weekly time.
buy after above weekly candle close
please wait for weekly candle close.
NOTE- Only for Education Purpose.
Please Give A Like If You Like
FOLLOW FOR MORE

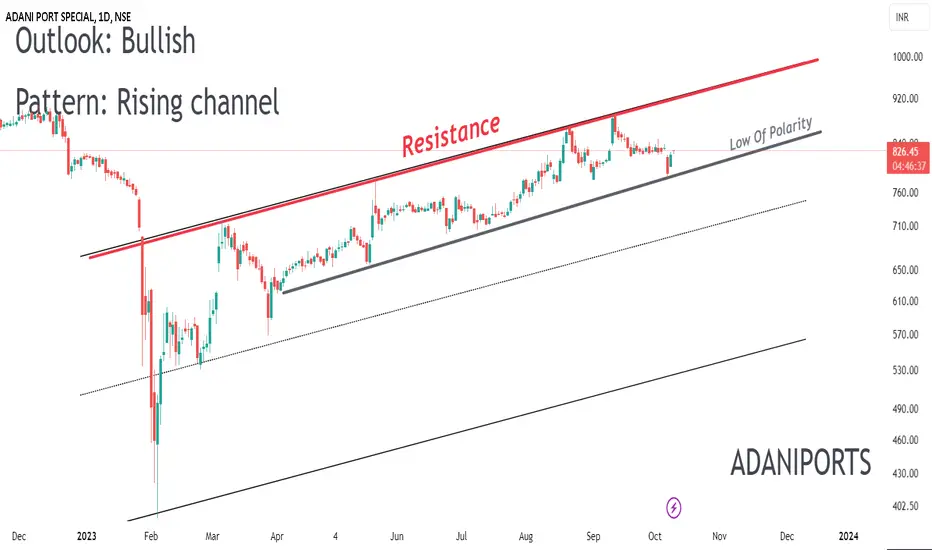
📈 Exciting Bullish Pattern Alert! 🐂📈 Exciting Bullish Pattern Alert! 🐂
📊 Pattern: Rising channel
📌 Symbol/Asset: ADANIPORTS
🔍 Description: Stock is in a Rising channel and now around Law of Polarity support. We might see bounce from here on.
👉 Disclosure: We are not SEBI registered analysts, this is not a buy or sell recommendation. Technical patterns are just one piece of the puzzle. Consider conducting further research, consulting with a financial advisor, and managing your risks appropriately.
AdaniportsHere, is the chart for traders and investors favorite stock....
Invest and trade accordingly...

Adani Enterprise Intraday TradeAdanient is looking good for intraday above 832-835 supported by volumes Have suitable sl and go long above this zone

ADANIPORTS - Bullish Consolidation with volumesNSE: ADANIPORTS is closing with a bullish consolidation candle supported with volumes.
Today's volumes and candlestick formation indicates strong demand and stock should move to previous swing highs in the coming days.
The stock has been moving along the horizontal support for the past few days which is indicating demand.
One can look for a 8% to 13% gain on deployed capital in this swing trade.
The view is to be discarded in the event of the stock breaking previous swing low.
#NSEindia #Trading #StockMarketindia #Tradingview #SwingTrade

AdaniPort at the topHere, is the chart of Adaniport daily time frame..
It is at the top (Resistance)...
What's your opinion?

📉 Alert! Bearish Pattern Spotted! 🐻📉 Alert! Bearish Pattern Spotted! 🐻
📊 Pattern: Rising Channel
📌 Symbol/Asset: ADANIPORTS
🔍 Description: Stock is around the resistance
👉 Disclosure: We are not SEBI registered analysts, this is not a buy or sell recommendation. Technical patterns are just one piece of the puzzle. Consider conducting further research, consulting with a financial advisor, and managing your risks appropriately.
