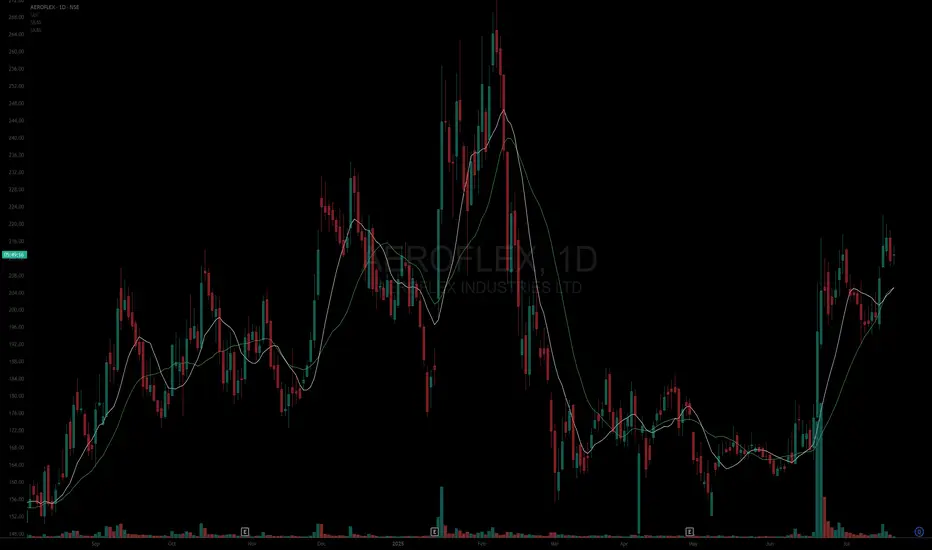
AEROFLEX | RSI positive divergence + Reversal signalsAEROFLEX | RSI positive divergence + Reversal signals
CMP : 193
Aeroflex Industries Ltd.
No trades
3.80 INR
525.08 M INR
3.70 B INR
35.36 M
About Aeroflex Industries Ltd.
Sector
Industry
CEO
Asad Daud
Website
Headquarters
Mumbai
Founded
1993
IPO date
Aug 31, 2023
Identifiers
2
ISIN INE024001021
Aeroflex Industries Ltd. manufactures and sells stainless steel corrugated hoses and hose assemblies. The firm offers stainless steel hoses and braids, automotive exhaust connector, special assemblies hose, end connectors, and cam-lock couplings. The company was founded by Yusuf Mohammed Kagzi on October 19, 1993 and is headquartered in Mumbai, India.
Related stocks

Aeroflex Industries - A matter of time before the breakout!Upcoming player in steel sector doing well fundamentally about to give a rally once it breaks out of the wedge marked in green. Looking at T1 and T2 (2 horizontal blue lines marked on chart) in quick succession once breakout is achieved.
Long term investors are looking at a potential 2xer to 3xer

#AEROFLEXAsset: Aeroflex Industries Ltd (AEROFLEX)
Breakout Level: 215
Potential Target: 272
Stop Loss: 205 (~4%)
Timeframe: Short to Medium term
Risk to Reward ratio : 1:6
Rationale:
Fundamentals -
Fundamentally decent stock with the following attributes:
* ROCE - 22.3%
* ROE - 16.6%
* Debt to Equity - 0
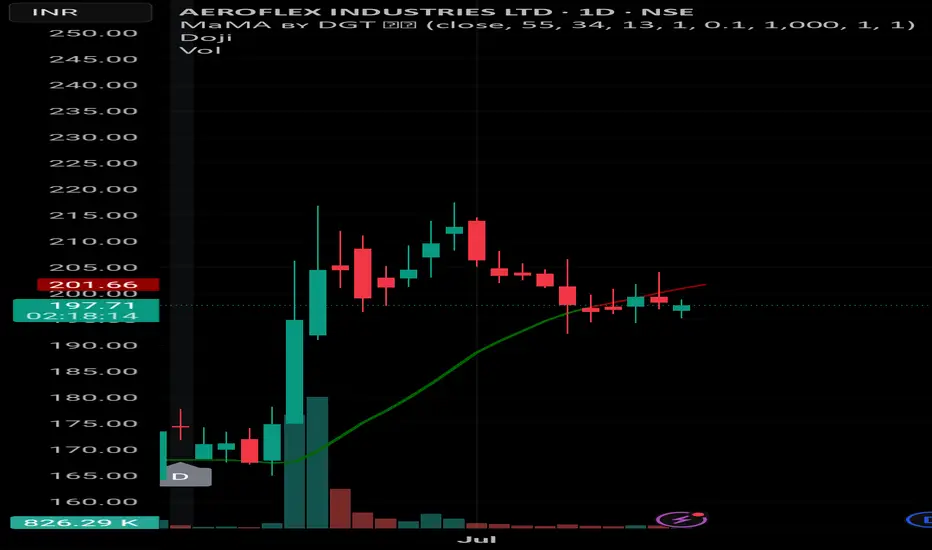
AEROFLEX INDUSTRIES LTD – Short-Term Swing Setup🟢 AEROFLEX INDUSTRIES LTD – Short-Term Swing Setup
📊 Chart: Daily (1D)
📍 CMP: ₹198.33
📅 Date: July 14, 2025
---
🔍 Technical View:
Price bounced after short correction, holding above 20 EMA.
Volume spike on prior breakout shows buyer interest.
UP signal printed again — showing short-term stren
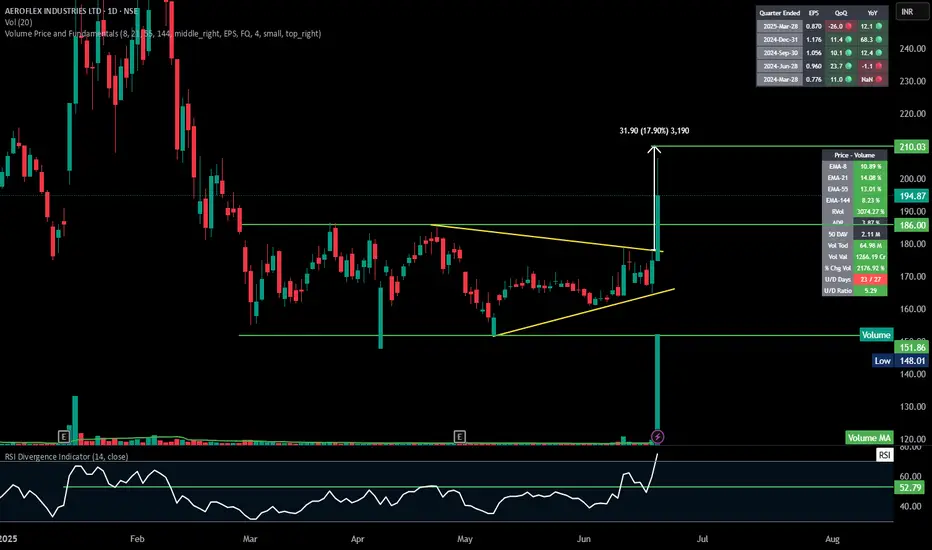
Aeroflex | Symmetrical triangle breakout ### 📊 **Aeroflex Industries Ltd - Technical Analysis Summary (Daily Chart)**
#### 🚀 **Breakout Overview**
* **Pattern**: Symmetrical triangle breakout (tight range → explosive move)
* **Breakout Confirmation**: Massive bullish candle (+11.45%) with **volume spike (64.98M)** — over **1200% above av
Aeroflex Ind Short Term TradeRectangle pattern breakout
The stock has been consolidating since the last three months, with a low volume and falling atr
On breakout the rise in volume and atr is visible
Also a slight surge in volume were seen during bullish days in the last week, confirming the bullish strength in the stock
Osci

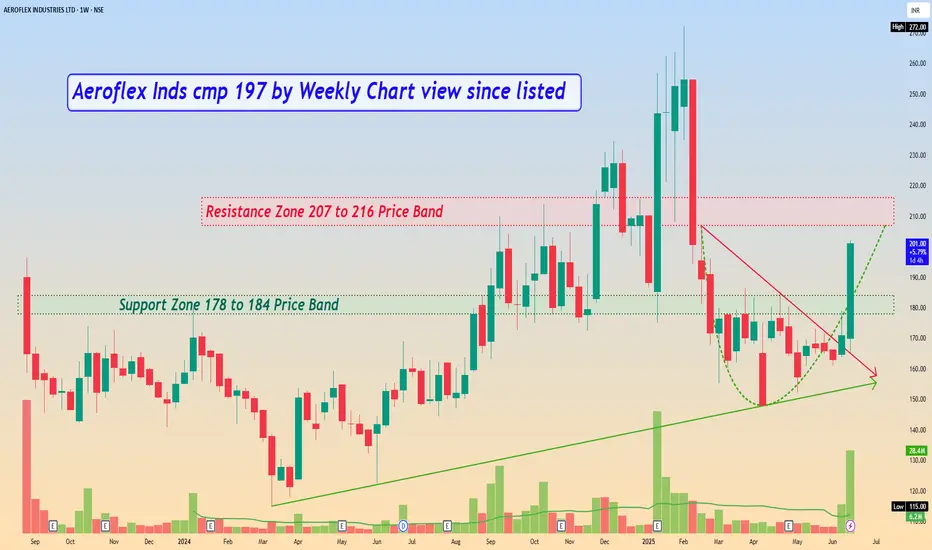
Aeroflex Inds cmp 197 by Weekly Chart view since listed*Aeroflex Inds cmp 197 by Weekly Chart view since listed*
- Support Zone 178 to 184 Price Band
- Resistance Zone 207 to 216 Price Band
- Rising Support Trendline well respected and sustained
- Falling Resistance Trendline Breakout done and maintained
- Heavy Volumes traded over past few days and we
Good for investment Strengths
• The company has shown a good profit growth of 90.71% for the Past 3 years.
• The company has shown a good revenue growth of 29.98% for the Past 3 years.
• The company has significantly decreased its debt by 44.88 Cr.
• Company has been maintaining healthy ROE of 29.59% over the past 3 ye
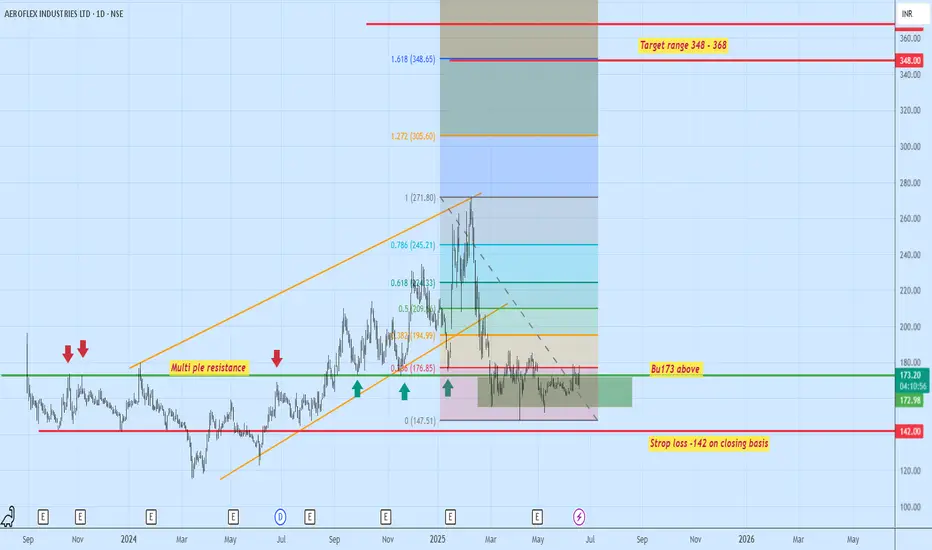
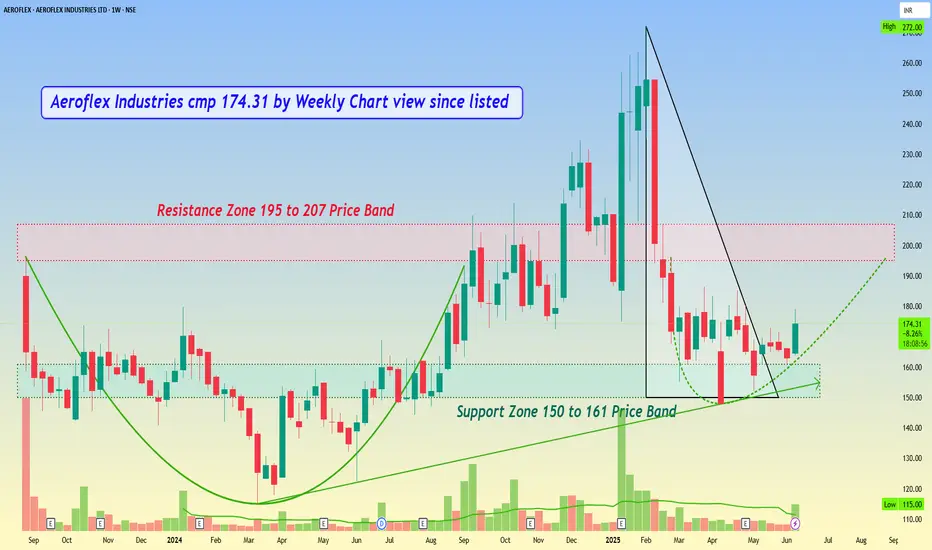
Aeroflex Industries cmp 174.31 by Weekly Chart view since listedAeroflex Industries cmp 174.31 by Weekly Chart view since listed
- Support Zone 150 to 161 Price Band
- Resistance Zone 150 to 161 Price Band
- Descending Triangle pattern Breakout sustained
- Volumes spiked out and traded heavily yesterday
- Old Bullish Rounding Bottom from Aug 23 to Sept 24
- New
Aeroflex Industries Limited (India)Aeroflex Industries Limited (India) is a Mumbai-based manufacturer of stainless steel flexible flow solutions, including corrugated hoses, hose assemblies, and expansion joints. Founded in 1993, it serves industries such as aerospace, defense, semiconductors, robotics, hydrogen, natural gas, and pet

See all ideas
Summarizing what the indicators are suggesting.
Oscillators
Neutral
SellBuy
Strong sellStrong buy
Strong sellSellNeutralBuyStrong buy
Oscillators
Neutral
SellBuy
Strong sellStrong buy
Strong sellSellNeutralBuyStrong buy
Summary
Neutral
SellBuy
Strong sellStrong buy
Strong sellSellNeutralBuyStrong buy
Summary
Neutral
SellBuy
Strong sellStrong buy
Strong sellSellNeutralBuyStrong buy
Summary
Neutral
SellBuy
Strong sellStrong buy
Strong sellSellNeutralBuyStrong buy
Moving Averages
Neutral
SellBuy
Strong sellStrong buy
Strong sellSellNeutralBuyStrong buy
Moving Averages
Neutral
SellBuy
Strong sellStrong buy
Strong sellSellNeutralBuyStrong buy
Displays a symbol's price movements over previous years to identify recurring trends.
Frequently Asked Questions
The current price of AEROFLEX is 185.65 INR — it has decreased by −1.24% in the past 24 hours. Watch Aeroflex Industries Ltd. stock price performance more closely on the chart.
Depending on the exchange, the stock ticker may vary. For instance, on NSE exchange Aeroflex Industries Ltd. stocks are traded under the ticker AEROFLEX.
AEROFLEX stock has risen by 0.77% compared to the previous week, the month change is a −5.27% fall, over the last year Aeroflex Industries Ltd. has showed a −29.94% decrease.
AEROFLEX reached its all-time high on Feb 6, 2025 with the price of 272.00 INR, and its all-time low was 115.00 INR and was reached on Mar 13, 2024. View more price dynamics on AEROFLEX chart.
See other stocks reaching their highest and lowest prices.
See other stocks reaching their highest and lowest prices.
AEROFLEX stock is 2.61% volatile and has beta coefficient of 2.16. Track Aeroflex Industries Ltd. stock price on the chart and check out the list of the most volatile stocks — is Aeroflex Industries Ltd. there?
Today Aeroflex Industries Ltd. has the market capitalization of 23.96 B, it has increased by 0.82% over the last week.
Yes, you can track Aeroflex Industries Ltd. financials in yearly and quarterly reports right on TradingView.
AEROFLEX net income for the last quarter is 164.91 M INR, while the quarter before that showed 142.34 M INR of net income which accounts for 15.86% change. Track more Aeroflex Industries Ltd. financial stats to get the full picture.
Yes, AEROFLEX dividends are paid annually. The last dividend per share was 0.30 INR. As of today, Dividend Yield (TTM)% is 0.16%. Tracking Aeroflex Industries Ltd. dividends might help you take more informed decisions.
Aeroflex Industries Ltd. dividend yield was 0.18% in 2024, and payout ratio reached 7.39%. The year before the numbers were 0.21% and 7.38% correspondingly. See high-dividend stocks and find more opportunities for your portfolio.
As of Feb 8, 2026, the company has 556 employees. See our rating of the largest employees — is Aeroflex Industries Ltd. on this list?
EBITDA measures a company's operating performance, its growth signifies an improvement in the efficiency of a company. Aeroflex Industries Ltd. EBITDA is 886.00 M INR, and current EBITDA margin is 20.10%. See more stats in Aeroflex Industries Ltd. financial statements.
Like other stocks, AEROFLEX shares are traded on stock exchanges, e.g. Nasdaq, Nyse, Euronext, and the easiest way to buy them is through an online stock broker. To do this, you need to open an account and follow a broker's procedures, then start trading. You can trade Aeroflex Industries Ltd. stock right from TradingView charts — choose your broker and connect to your account.
Investing in stocks requires a comprehensive research: you should carefully study all the available data, e.g. company's financials, related news, and its technical analysis. So Aeroflex Industries Ltd. technincal analysis shows the buy rating today, and its 1 week rating is strong buy. Since market conditions are prone to changes, it's worth looking a bit further into the future — according to the 1 month rating Aeroflex Industries Ltd. stock shows the buy signal. See more of Aeroflex Industries Ltd. technicals for a more comprehensive analysis.
If you're still not sure, try looking for inspiration in our curated watchlists.
If you're still not sure, try looking for inspiration in our curated watchlists.