Aeroflex Industries - A matter of time before the breakout!Upcoming player in steel sector doing well fundamentally about to give a rally once it breaks out of the wedge marked in green. Looking at T1 and T2 (2 horizontal blue lines marked on chart) in quick succession once breakout is achieved.
Long term investors are looking at a potential 2xer to 3xer based on future growth projections. Lets sit tight with this one 🚀🚀
AEROFLEX trade ideas

#AEROFLEXAsset: Aeroflex Industries Ltd (AEROFLEX)
Breakout Level: 215
Potential Target: 272
Stop Loss: 205 (~4%)
Timeframe: Short to Medium term
Risk to Reward ratio : 1:6
Rationale:
Fundamentals -
Fundamentally decent stock with the following attributes:
* ROCE - 22.3%
* ROE - 16.6%
* Debt to Equity - 0
* Stock PE 52.2 / Industry PE - 25.5 || Stock PBV 8 / Industry PBV 2.43 - Company is overpriced
* EPS / Revenue - Increasing
Technicals -
* HVE edge carry over, the stock is now showing tight price and volume action
* Price is surfing the 10/20 DMA
* 200 DMA is forming a slightly increasing structure
* Multiple timeframe analysis - Not much to be gathered from monthly charts however weekly charts are showing consolidation as well
* RS is increasing
* ADR 4.2%
Market analysis
* Forecasted for ~33% further increase
* Promoter holding at 67% and remains steady
* MFs are increasing their holding
Cons
* Momentum is slow holding patterns are not that ideal
This analysis is for educational purposes only and should not be considered as financial advice. Trading and investing in financial markets involve significant risk, and past performance is not indicative of future results. You should conduct your own research and consult with a qualified financial advisor before making any trading or investment decisions. The author is not responsible for any financial losses or damages that may result from the use of this information.
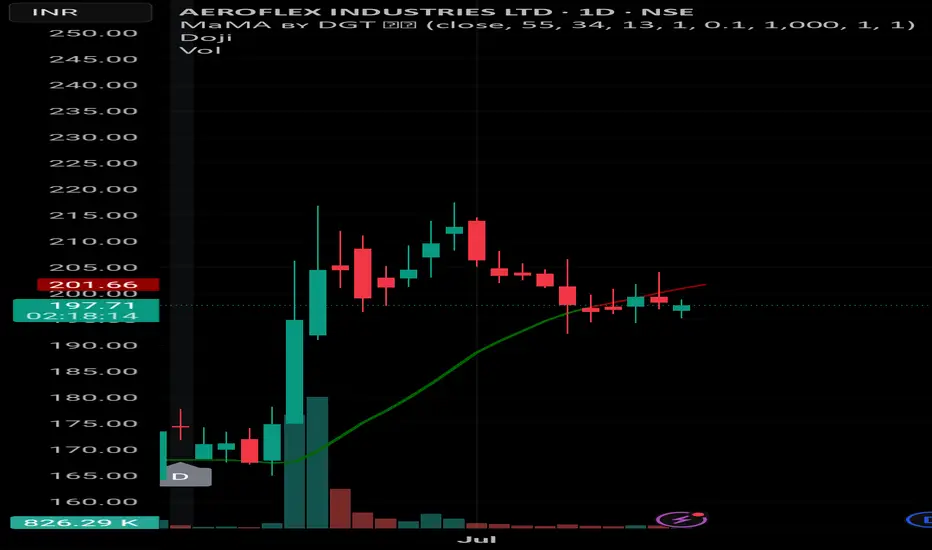
AEROFLEX INDUSTRIES LTD – Short-Term Swing Setup🟢 AEROFLEX INDUSTRIES LTD – Short-Term Swing Setup
📊 Chart: Daily (1D)
📍 CMP: ₹198.33
📅 Date: July 14, 2025
---
🔍 Technical View:
Price bounced after short correction, holding above 20 EMA.
Volume spike on prior breakout shows buyer interest.
UP signal printed again — showing short-term strength.
---
🎯 Trade Plan:
Entry Zone: ₹195–198
Target 1: ₹210
Target 2: ₹220 (partial profit booking suggested)
Stoploss: ₹191 (closing basis below 20 EMA)
📋 Action Plan:
✅ If price sustains above ₹200 with volume — hold for full target.
⚠️ If price hovers below ₹195 for too long — exit or re-evaluate.
❌ If closing below ₹191 — exit completely (setup invalidated).
🔁 Trail SL to ₹198 once ₹210 is hit, to lock partial profit.
⚠️ Disclaimer: This is purely educational and not investment advice. I am not a SEBI-registered advisor. Do your own analysis or consult a financial expert before trading.
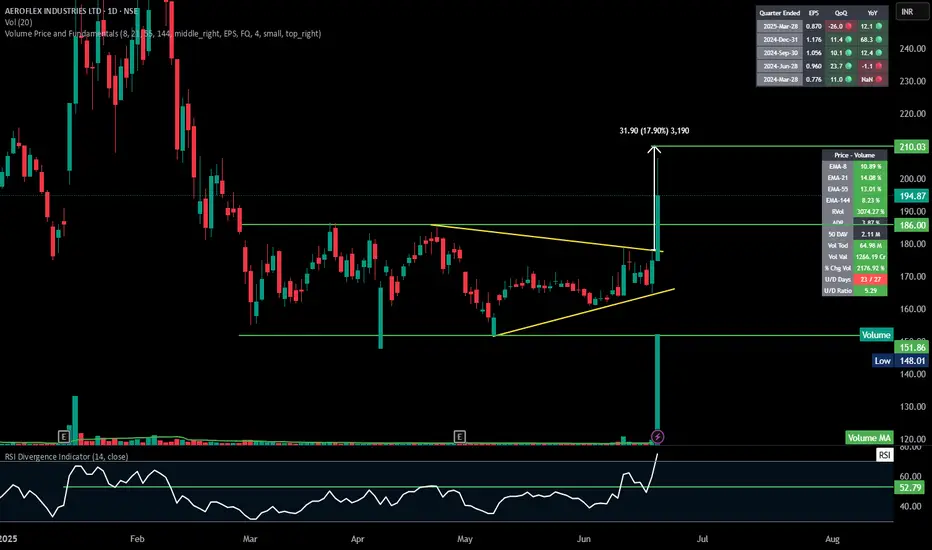
Aeroflex | Symmetrical triangle breakout ### 📊 **Aeroflex Industries Ltd - Technical Analysis Summary (Daily Chart)**
#### 🚀 **Breakout Overview**
* **Pattern**: Symmetrical triangle breakout (tight range → explosive move)
* **Breakout Confirmation**: Massive bullish candle (+11.45%) with **volume spike (64.98M)** — over **1200% above average**
* **Breakout Level**: \~₹174–₹176
#### 🎯 **Target Projection**
* **Height of Triangle (Approx)**: ₹31.90
* **Target Price**: ₹176 (breakout level) + ₹31.90 ≈ **₹210**
#### 📌 **Key Price Levels**
* **Current Price**: ₹194.87
* **Immediate Resistance / Target**: ₹210
* **Support**: ₹186 (previous swing high and breakout retest level)
* **Stop Loss Zone**: Below ₹174
#### 📈 **Volume & Indicators**
* **RSI**: 74.80 — Overbought, but confirms strong momentum
* **EMA Confluence**:
* EMA-8: +10.89%
* EMA-21: +14.08%
* EMA-55: +13.01%
* EMA-144: +8.23%
* **RVol**: 3074.27% — Heavy institutional activity likely
* **U/D Ratio**: 5.29 — Strong buying dominance
#### 🧠 **Inference**
* **Strong bullish breakout** with rising volume and RSI confirmation.
* Good follow-through expected up to **₹210**.
* Watch for minor pullbacks or consolidation near ₹186 for potential entry on retest.
---
Aeroflex Ind Short Term TradeRectangle pattern breakout
The stock has been consolidating since the last three months, with a low volume and falling atr
On breakout the rise in volume and atr is visible
Also a slight surge in volume were seen during bullish days in the last week, confirming the bullish strength in the stock
Oscillators also provide good confirmation
Thus, for a short term trade,
tgt 212.5, sl 184

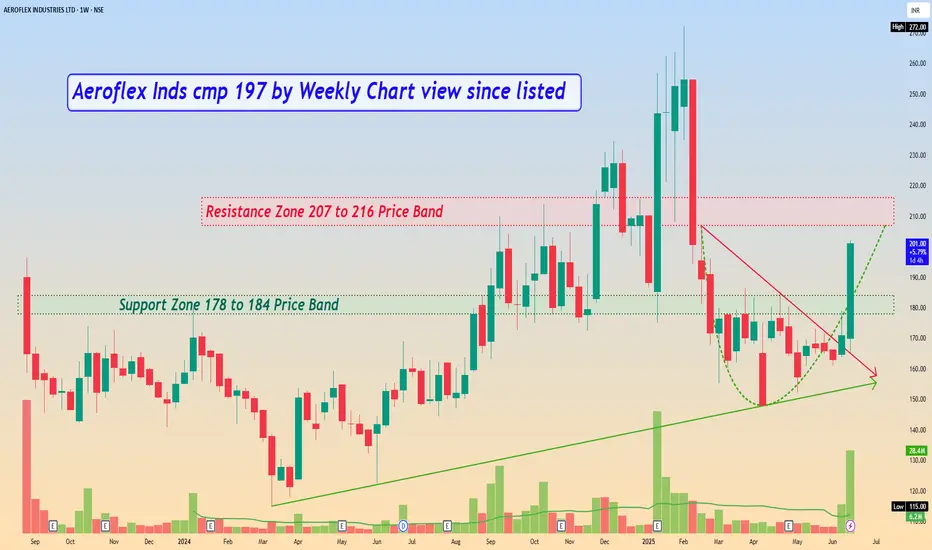
Aeroflex Inds cmp 197 by Weekly Chart view since listed*Aeroflex Inds cmp 197 by Weekly Chart view since listed*
- Support Zone 178 to 184 Price Band
- Resistance Zone 207 to 216 Price Band
- Rising Support Trendline well respected and sustained
- Falling Resistance Trendline Breakout done and maintained
- Heavy Volumes traded over past few days and well above avg traded quantity
- *Bullish Rounding Bottom in the making process with the Resistance Zone neckline*
Good for investment Strengths
• The company has shown a good profit growth of 90.71% for the Past 3 years.
• The company has shown a good revenue growth of 29.98% for the Past 3 years.
• The company has significantly decreased its debt by 44.88 Cr.
• Company has been maintaining healthy ROE of 29.59% over the past 3 years.
• Company has been maintaining healthy ROCE of 31.64% over the past 3 years.
• Company is virtually debt free.
• Company has a healthy Interest coverage ratio of 22.77.
• The company has an efficient Cash Conversion Cycle of 75.84 days.
• Company has a healthy liquidity position with current ratio of 3.46.
• The company has a high promoter holding of 66.99%.
Entry, Target and Stop loss mentioned in chart.
Note: I am not authorized stock analyst. Please do your own financial assessment before investment.
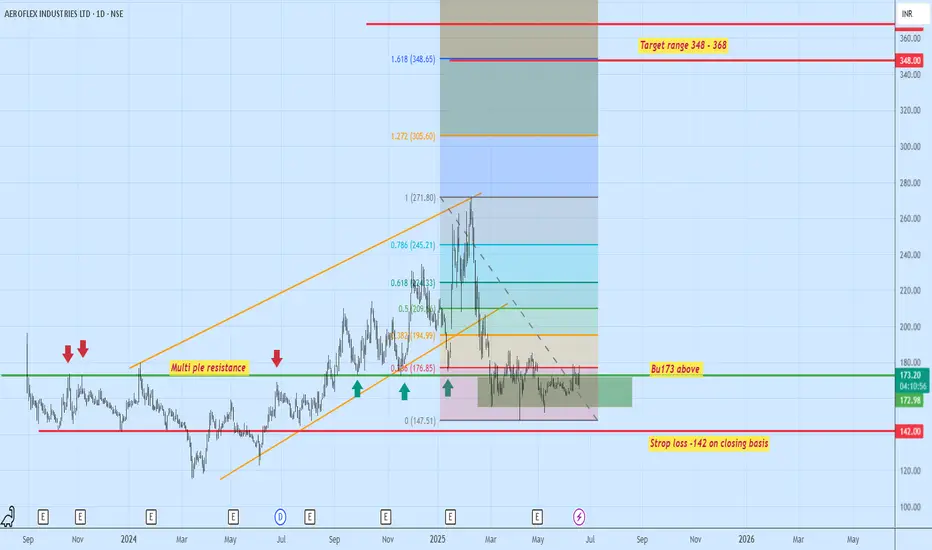
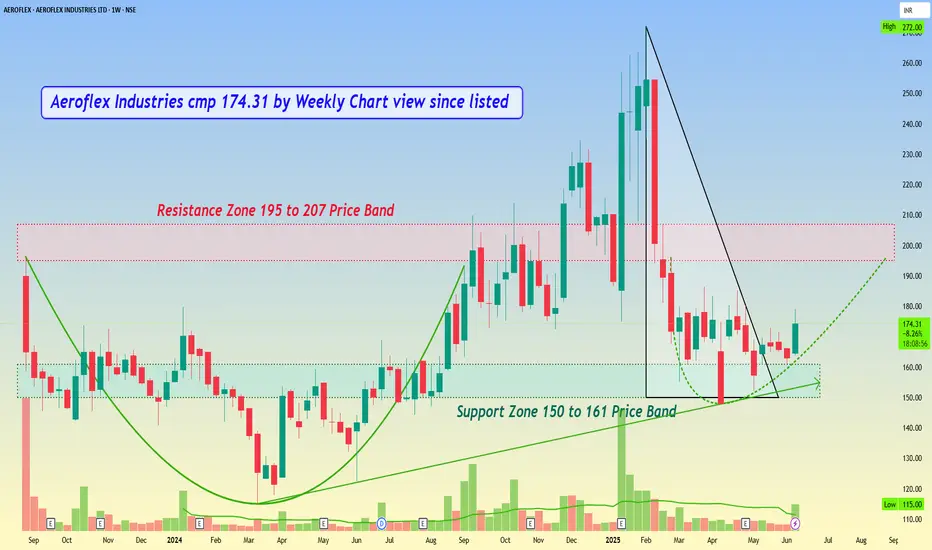
Aeroflex Industries cmp 174.31 by Weekly Chart view since listedAeroflex Industries cmp 174.31 by Weekly Chart view since listed
- Support Zone 150 to 161 Price Band
- Resistance Zone 150 to 161 Price Band
- Descending Triangle pattern Breakout sustained
- Volumes spiked out and traded heavily yesterday
- Old Bullish Rounding Bottom from Aug 23 to Sept 24
- New Bullish Rounding Bottom from Feb 25 to.... in the making process
- Rising Support Trendline respected, hope to see upside momentum gradually carry on
- Will History be repeated and we get to see a New Lifetime High Milestone beyond ATH 272
Aeroflex Industries Limited (India)Aeroflex Industries Limited (India) is a Mumbai-based manufacturer of stainless steel flexible flow solutions, including corrugated hoses, hose assemblies, and expansion joints. Founded in 1993, it serves industries such as aerospace, defense, semiconductors, robotics, hydrogen, natural gas, and petrochemicals. The company, part of Sat Industries Limited, exports to over 80 countries and holds ISO 9001:2015, ISO 45001:2018, and ISO 14001:2015 certifications.
Market Cap : Approximately ₹2,178 crore (as of recent data).
Recent Financial Performance (FY25)
Q4 FY25 (March 2025):
Net profit rose 11.96% to ₹11.23 crore from ₹10.03 crore in Q4 FY24.
Sales increased 17.90% to ₹91.69 crore from ₹77.77 crore.
Full Year FY25 (ended March 2025):
Net profit up 25.83% to ₹52.51 crore from ₹41.73 crore in FY24.
Sales grew 18.34% to ₹376.23 crore from ₹317.91 crore.
Accrual ratio of 0.51, with negative free cash flow (outflow of ₹769 million), raising concerns about underlying earnings power.
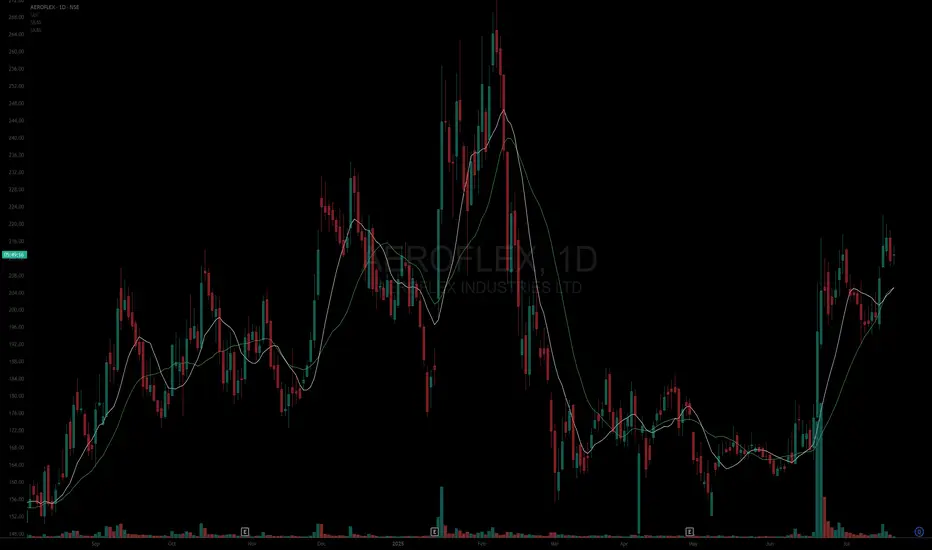
Price Movement and Trends
Current Price (June 11, 2025): The stock closed at ₹177.50, up 8.03% from the previous close of ₹164.30. Today’s trading range was ₹164.06 (low) to ₹176.50 (high), with a traded volume of 21.45 lakh shares.Breakout above the ₹180–₹181 resistance level in early 2025, followed by a retest of this level as support. The stock bounced back from the 50-day Exponential Moving Average (EMA) after the retest, signaling continued bullish momentum. So, I expect a Bullish move

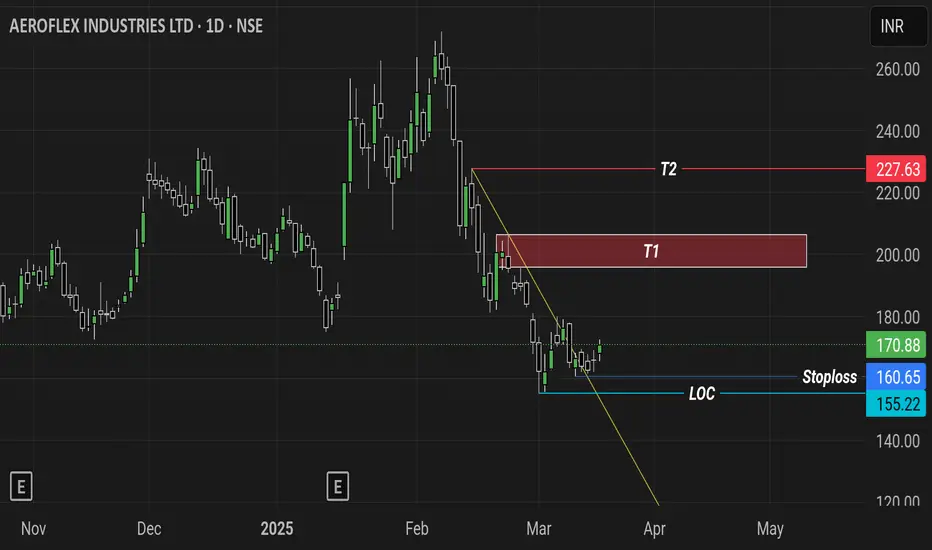
20% move or not? Let's analyse Chart is self explanatory
Bullish breakout above declining trendline with even taking support at it
Already at entry
Resistance and targets are all described in chart
Stoploss is must due to global uncertainty
Line of control is last point above which bulls can take control over bears
No buy or sell tip just an analysis. Do as per your own financial advisor
BUY TODAY SELL TOMORROW for 5% DON’T HAVE TIME TO MANAGE YOUR TRADES?
- Take BTST trades at 3:25 pm every day
- Try to exit by taking 4-7% profit of each trade
- SL can also be maintained as closing below the low of the breakout candle
Now, why do I prefer BTST over swing trades? The primary reason is that I have observed that 90% of the stocks give most of the movement in just 1-2 days and the rest of the time they either consolidate or fall
Trendline Breakout in AEROFLEX
BUY TODAY SELL TOMORROW for 5%

AEROFLEX Breakout Retest - Looking goodDate : 15-12-2024
-------------------------------------
Breakout Retest (PICK RESEARCH TO OBSERVE)
AEROFLEX Looks Good Above 239
SL 172
Target 252, 265,291, 343++
Hold Period : Few Weeks to Months
Reason for Pick : Breakout, Above 20, 50, 200 SMA
Please consult your financial advisor before investing
All research for educational purposes only.


aeroflexshowing good signs of further up move as long as it hold 200...trendline breakout in weekly was shown and it seems to be holding the level

Aeroflex Industries by KRS Charts4th Oct 2024 / 10:02 AM
Why AEROFLEX ❓
1. Clear Pattern of Reversal to Bullish, Inverted Head & Shoulder❗❗👍
2. Many has Jumped in Breakout due to high calls were given for AEROFLEX but once in Retest ,i think it's right time to enter with more conviction.
3. In smaller TF, 100 EMA is right underneath so multi-TF support ✅↗️
Target would be of ~224 Rs with SL closing below Support as we can see in Chart 📈

AEROFLEX: supply zone breakout2. AEROFLEX
➡️supply zone breakout after consolidation
➡️highest ever sales and PAT
➡️repaid debt
➡️capacity expansion under way would improve financials further
➡️increased cash from operating activities

AEROFLEX : IPO Listing Day High Broken#AEROFLEX #breakout #vcpsetup #vcppattern #IPOstock
AEROFLEX : Swing Trade
>> IPO Listing Day High Broken
>> VCP Formation
>> Good Strength & Volumes
>> Upside Potential min 25-30 %
Swing Traders can lock 10% profit & keep trailing
Note : In the current Market Scenario even the best of Trading setup's can fail so Trade only Good setup's with proper Risk Management, set of rules for Stop-loss & proper position sizing.
Please give a Boost or comment if u r Liking the analysis & Learning from it. Keep showing ur Love by following
Disclaimer : This is not a Trade Recommendations & Charts/ stocks Mentioned are for Learning/Educational Purpose. Do your Own Analysis before Taking positions.

AEROFLEX! RSI Bearish DivergenceTechnical Analysis
Might move towards the support around 160.
Other details mentioned in the chart.
For educational purposes only.
Not a buy/sell recommendation.

AEROFLEX breakoutAEROFLEX has given resistance breakout with decent volume. Above ATH. Seems the rally may continue

AEROFLEX - Cup and Handle BreakoutAEROFLEX Cup & Handle breakout
RSI Rising
The target price is around ₹270, and a stop-loss can be placed below the handle at around ₹185.

AEROFLEX INDUSTRIESHi, Aeroflex a subsidiary of SAT Industries has given breakout of rounding bottom pattern with high volumes and high momentum. The current candle looks like a marobozu formed at all the time high. Looks like a good breakout.

AEROFLEXNote:
1. Views are personal and for educational purposes only. Recheck and take the trade as per your RR.
2. Always remember SL is your lifeline, not the big target...
3. Follow us for more patterns and like, share so that we feel it is helpful to many and share more patterns...
3. Views given here is not a tip rather it is for educational purpose... Aftermarket opens, the condition might change so learn to handle different conditions...
Keep an eye ladies and gentlemen. Cheers and Happy Trading

aeroflextrend line breakout with volume retest and holding the support levels and continuation ...looking good on charts
