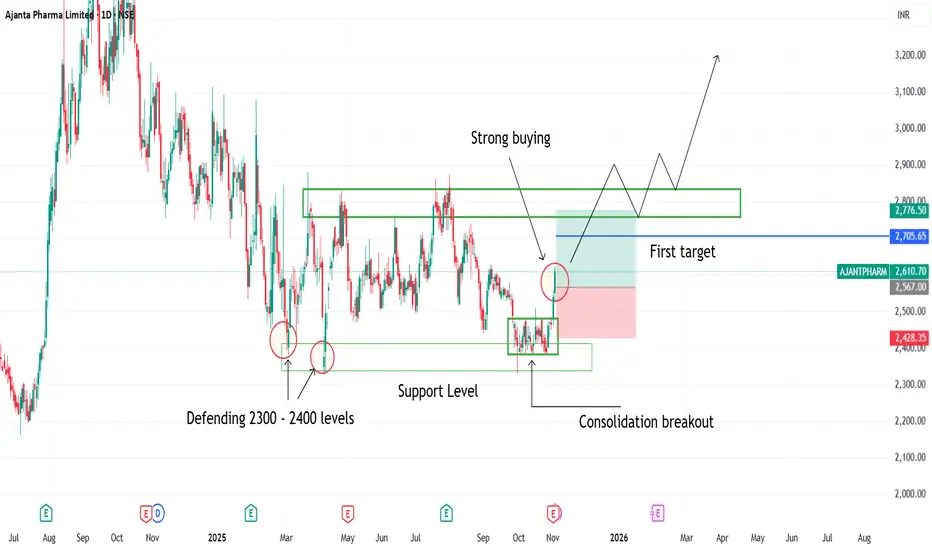
Consolidation breakout seen in ajanta pharma1. Consolidation breakout seen in ajanta pharma
2. Buyers defending 2300 2400 levels
3. Strong Bullish candles indicating strong buyers strength
4. Consolidation breakout has been happened on support levels
Trade ideas
Ajanta Pharma at a Critical Point | Breakout or RejectionAjanta Pharma is currently trading around the ₹2800 mark, which has acted as a strong resistance zone over the past few months. The stock has tested this level 4 to 5 times, indicating significant supply pressure and trader interest at this price point.
At this stage, Ajanta Pharma stands at a crucial inflection point:
📈 Bullish Scenario:
A clean breakout above ₹2800, especially with volume confirmation, could potentially lead to a 10% upside in the near term, with scope for a 20% rally if momentum sustains.
📉 Bearish Scenario:
However, if the stock fails to break through and faces rejection again, we might see a pullback of around 10%, as traders book profits or short near resistance.
This setup presents a high-reward trade opportunity with a well-defined risk level, making it a good candidate to keep on your watchlist.
Disclaimer:
This post is for educational and informational purposes only. I am not a SEBI-registered investment advisor or research analyst. Please do your own research or consult a certified financial advisor before making any investment decisions.

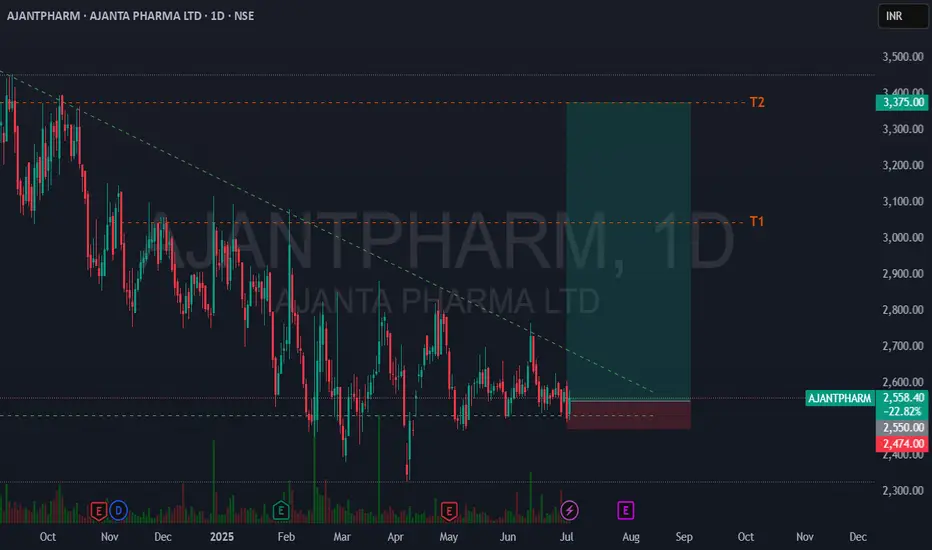
"Strategic Breakout Opportunity: Aiming for 25% Gain"I see a potential breakout with a 25% upside after three months of strong consolidation. I'm planning to enter at 2550 with a stop loss at 2475. Target 1 is 3045, and Target 2 is 3375. Let's monitor this closely! NSE:AJANTPHARM
Ajanta Pharma BTST/Short-Term Buy SetupAjanta Pharma BTST/Short-Term Buy Setup
CMP: ₹2587
Time Horizon: 3–4 Days
Trade Type: BTST / Positional
Confidence Level: ⭐⭐⭐⭐⭐ (90%+)
🧠 Technical Setup & Reasoning:
✅ Price Breakout Zone: Stock has broken out of a mini-consolidation above ₹2575–2580 zone with good price action.
✅ Bullish Candle Formation: Strong green candle near day’s high with decent closing suggests follow-through.
✅ Volume Confirmation: Breakout accompanied by rising volume → confirms participation.
✅ MACD Crossover: MACD turning up from the zero line – a fresh bullish cycle.
✅ RSI Strength: RSI near 60 with room to move higher – not yet overbought.
✅ Higher Highs: Stock is forming a sequence of higher highs, indicating trend continuation.
📊 Targets & Levels
🎯 Target 1: ₹2625
🎯 Target 2: ₹2665
🚀 Stretch Target: ₹2700+ (if momentum holds)
🛑 Stop-Loss: ₹2555 (on closing basis)
📌 Why This Is High Conviction:
Clean breakout from structure
Multiple indicator alignment (MACD + RSI + Volume)
Sector strength + relatively low volatility stock
Strong institutional activity seen in recent sessions
📌 Strategy: Buy on dips near ₹2580–2585 or continue holding if already entered at ₹2585–2587. Trail SL once ₹2625 is crossed.

AJANTPHARM | Consolidation | Breakout | Daily--
### 📊 **Technical Analysis Summary:**
#### 🔹 **Chart Pattern:**
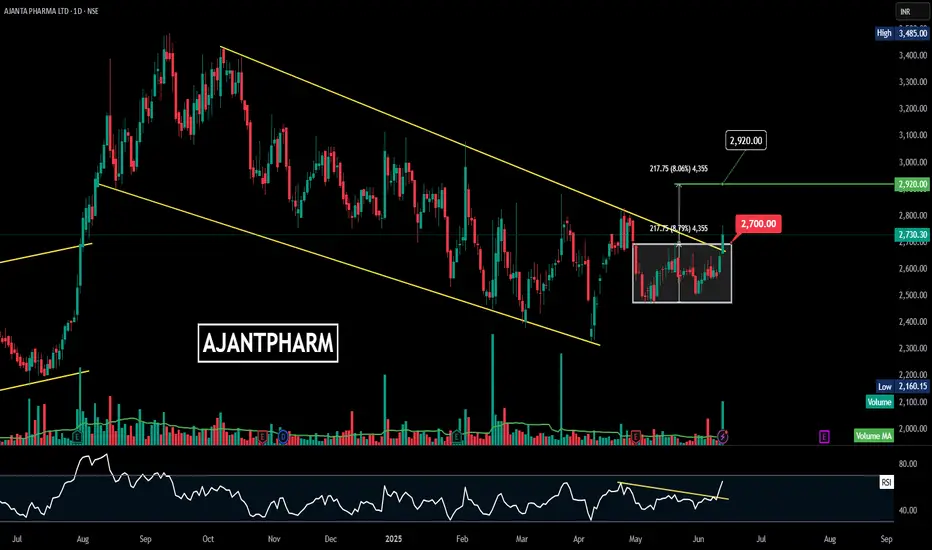
* **Falling Channel** (Yellow trendlines): Price has been respecting a downward-sloping channel since mid-2023.
* Recently, the price **broke out above the upper trendline**, indicating a **potential trend reversal**.
#### 🔹 **Consolidation Zone:**
* There was a **rectangle consolidation** (boxed region) between ₹2,480 and ₹2,700.
* The breakout above ₹2,700 confirms bullish intent and may act as a new support.
#### 🔹 **Breakout Target:**
* The measured move from the box is **approx. ₹217.75**.
* Adding to the breakout level gives a projected **target of ₹2,920**.
#### 🔹 **Volume:**
* **Volume spike** on breakout day = strong confirmation of the breakout.
#### 🔹 **RSI (Relative Strength Index):**
* RSI broke out of its own **downtrend resistance**.
* Now trading above 60 = bullish momentum building up.
---
### 🎯 **Levels to Watch:**
| Type | Price (₹) |
| ----------------------- | ----------- |
| **Breakout Point** | 2,700 |
| **Current Price** | 2,730 |
| **Target** | 2,920 |
| **Support Zone** | 2,480–2,700 |
| **Volume Confirmation** | Yes ✅ |
---
### ✅ **Conclusion:**
Ajanta Pharma is showing strong bullish signs:
* Breakout from falling channel
* Volume-backed move
* RSI confirmation
**As long as the price holds above ₹2,700**, the upside towards ₹2,920 remains intact.
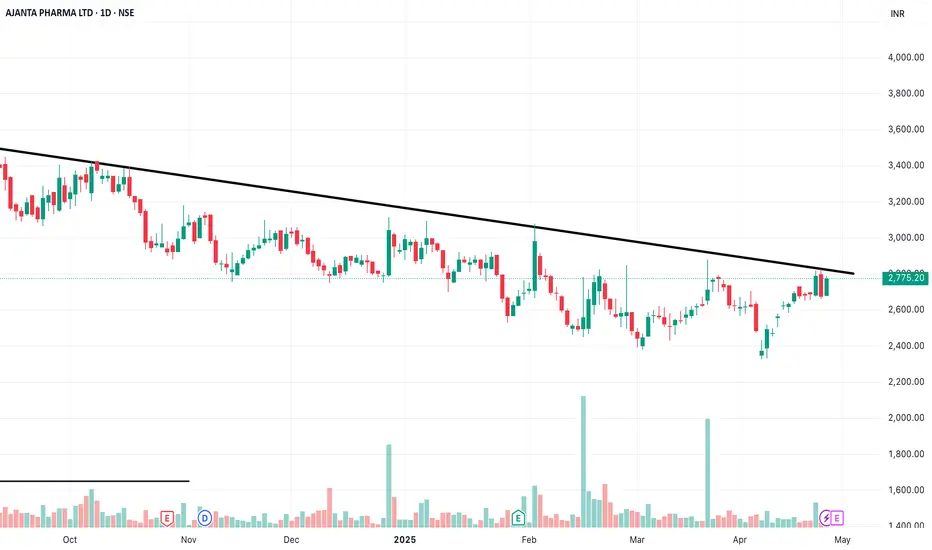
AJANTA PHARMA CMP 2775 Having trend line breakout and with this Breakout , with this breakout it may lead to all time high , Pharma industry is all time favourite and ready to move with appropriate correction.
Ajanta Pharma LtdDate 08.03.2025
Ajanta Pharma
Timeframe : Day Chart
Technical Remarks :
1 Currently under wave 4 as corrective wave/phase
2 Wave 2 correction was lower retracement & wave 3 was extended therefore, wave 4 corrective phase could be deeper as behaviour of wave/s
3 Formed death crossover with 20 ema & 200 ema, bearish crossover
5 At 38%, 2379 is very critical zone, if slips below it then no bottom fishing or averaging below it
Some Key Highlights about Company :
1 PE at 35 II ROCE at 31% II Book value 294 II OPM at 28%
2 Company is almost debt free.
3 Stock is trading at 8.71 times its book value
4 Promoter holding has decreased over last 3 years: -4.08%
5 FII = 9.26%, DII = 17.2%, promoter = 66.26% & Public = 7.45% (holding pattern)
Regards,
Ankur

AJANTA PHARMA: Risky Bet for 30% upside potential.Price is showing strength.
Expecting the Breakout of the channel.
Price is bouncing from the Ema and also from the demand

BUY TODAY SELL TOMORROW for 5% DON’T HAVE TIME TO MANAGE YOUR TRADES?
- Take BTST trades at 3:25 pm every day
- Try to exit by taking 4-7% profit of each trade
- SL can also be maintained as closing below the low of the breakout candle
Now, why do I prefer BTST over swing trades? The primary reason is that I have observed that 90% of the stocks give most of the movement in just 1-2 days and the rest of the time they either consolidate or fall
Trendline Breakout in AJANTPHARM
BUY TODAY SELL TOMORROW for 5%

AJANTA PHARMA LTDBuy Ajanta above: 3351 only.
All important points are marked.
𝐃𝐢𝐬𝐜𝐥𝐚𝐢𝐦𝐞𝐫: 𝐈𝐧𝐯𝐞𝐬𝐭𝐦𝐞𝐧𝐭 𝐢𝐧 𝐬𝐞𝐜𝐮𝐫𝐢𝐭𝐢𝐞𝐬 𝐦𝐚𝐫𝐤𝐞𝐭 𝐚𝐫𝐞 𝐬𝐮𝐛𝐣𝐞𝐜𝐭 𝐭𝐨 𝐦𝐚𝐫𝐤𝐞𝐭 𝐫𝐢𝐬𝐤𝐬, 𝐫𝐞𝐚𝐝 𝐚𝐥𝐥 𝐭𝐡𝐞 𝐫𝐞𝐥𝐚𝐭𝐞𝐝 𝐝𝐨𝐜𝐮𝐦𝐞𝐧𝐭𝐬 𝐜𝐚𝐫𝐞𝐟𝐮𝐥𝐥𝐲 𝐛𝐞𝐟𝐨𝐫𝐞 𝐢𝐧𝐯𝐞𝐬𝐭𝐢𝐧𝐠. 𝐒𝐭𝐨𝐜𝐤𝐬 𝐬𝐮𝐠𝐠𝐞𝐬𝐭𝐞𝐝 𝐢𝐧 𝐭𝐡𝐢𝐬 𝐠𝐫𝐨𝐮𝐩 𝐚𝐫𝐞 𝐟𝐨𝐫 𝐞𝐝𝐮𝐜𝐚𝐭𝐢𝐨𝐧 𝐩𝐮𝐫𝐩𝐨𝐬𝐞. 𝐖𝐞 𝐝𝐨𝐧𝐭 𝐦𝐚𝐤𝐞 𝐚𝐧𝐲 𝐩𝐫𝐨𝐟𝐢𝐭𝐬 𝐟𝐫𝐨𝐦 𝐭𝐡𝐢𝐬 𝐫𝐞𝐜𝐨𝐦𝐦𝐞𝐧𝐝𝐚𝐭𝐢𝐨𝐧𝐬 𝐞𝐯𝐞𝐫𝐲𝐭𝐡𝐢𝐧𝐠 𝐬𝐡𝐚𝐫𝐞𝐝 𝐡𝐞𝐫𝐞 𝐚𝐫𝐞 𝐜𝐨𝐦𝐩𝐥𝐞𝐭𝐞𝐥𝐲 𝐨𝐟 𝐟𝐫𝐞𝐞 𝐨𝐟 𝐜𝐨𝐬𝐭.

Ajanta Pharma looking good The stock has taken a support at 2175 around and can go upwards from here.
Talking about fundamental analysis, the stock has a net profit margin which fluctuates between 15-20% on yearly basis which is good for investment. The revenue has been increasing continuously for the past 5 years and the net profit looks good too.
Talking about the technical analysis, the stock is not in the overbought zone and has taken a support on the weekly chart itself.
CMP 2311
Can be held for a medium to long term perspective.
Note: This is not an investment advice, it is just an educational study from my perspective. I am not SEBI registered.

Crossover long #RISKMANAGE
IF 50K CAPITAL
Position size(no of share) 4
Investment of capital 9592
MAX LOSS - 500
PROFIT ------(1500+)
RISK TO REWARD (1:3)
ENTERY - 2398
SL - 2273
TARGET- 2773

Swing Trading Opportunity in Ajanta PharmaRefer the chart for Entry,Target and SL.
NOTE: This trade is only for Equity Swing buy and not to be considered for options trading.
Please do follow Position Sizing and Risk Reward Ratio while planning any trades.
Note: This information is for education purpose only and please do your own research and consult your financial advisor prior to taking any action.
TO CONNECT WITH ME CHECK OUT MY BIO.
If you like this Idea, Please do like my ideas and share it with your friends. check my bio.
Please boost my ideas and send cheers as it acts as a motivation to keep posting my analysis.
Thank you

[Swing Trade] AJANTPHARM 2412AJANTPHARM seems to be on verge of BO. Would it break the ATH? i see another 6%+ move in this counter after a bit of retracement.
DYOR - This is not stock buy reco

Ajantha pharmaBased on price moving and Ema
positions Up move possibility is higher
This is only for educational purposes.

Flag breakout with volume confirmation & double the profit of Q4#Freshview Dt. 04.05.2024
#AJANTA PHARMA CMP 2394+
Weekly Chart
Flag breakout with volume confirmation and after double the net profit for Q4.
AJANTA PHARMA LTD - APPROVAL OF BUY-BACK OF EQUITY SHARES AT A PRICE 2770 RUPEES PER SHARE
AJANTA PHARMA LTD - BUY-BACK UP TO 2.85 BILLION RUPEES
Price Momentum
2190-2240-2380-2540-2660-2770-2920-3000+
I hope for the best
Stay connected
#TEJGYAN

Ajantha Pharma:Channel Breakout After 4 Attempts -Bulls vs Bears
What is your inference on Ajantha Pharma's channel breakout; 4 Attempts - 3 failures, One Success????

BREAKOUT IN AJANTA PHARMA 📌SWING TRADE FOR NEXT WEEK 🚀
Hello Traders⚡
I am a Swing Trader by Passion i only trade on Momentum Stock's.
📌I Post Daily SWING CHARTS Analysis on My Trading view profile..
So let's Start
📌TRADE ANALYSIS OF AJANTA PHARMA
• Potential Breakout Chart
• VCP Pattern
• Short Range Consolidation
• Price Can Take Retest from support Line
• Overall The Price Is Moving In HH-HL Formation
• Volume Buildup Near BO Zone
• Looks Good For 10-20% Upside Levels After The Breakout
📌 If you have any questions about any stock you can comment on post 📱
📌Disclaimer:-
This all chatrs analysis are only for educational purposes only
I do not provide any CALL or Tips

Ajanta pharma at SupportThere is a one more stock Which is showing a great opportunity and forming descending triangle, stock is near support and ready to blast. what is your view please comment it down. We are NISM Certified. All views shared on this channel are my personal opinion and is shared for educational purpose and should not be considered advise of any nature.

AJANTAPHARMA - SWING TRADE - 23rd December #stocks#AJANTAPHARMA (1D TF)
Swing Trade Analysis given on 23rd December, 2023
Pattern: RECTANGLE BOX BREAKOUT
- Volume Spike Buildup - Done ✓
- Breakout of Resistance - In Progress
- Retracement & Consolidation - In Progress
#stocks #swingtrade #chartanalysis #priceaction #traderyte


AJANTPHARM | Swing Trade📊 Details
Ajanta Pharma is primarily engaged in development, manufacturing and marketing of speciality pharmaceutical quality finished dosages.(Source : 202003-01 Annual Report Page No:70).
Disclaimer: This analysis is solely for educational purposes and does not make me a SEBI registered analyst.
If you found this analysis helpful, I encourage you to like and share it. Your observations and comments are also welcomed below. Your support, likes, follows, and comments motivate me to consistently share valuable insights with you.
🔍 More Analysis & Trade Setups 🔍
For more technical analysis and trade setups, make sure to follow me on TradingView: www.tradingview.com

Trade-29/100-AJANTAP-R:R Experiment-Buybuying AJANTA PHARMA in DAILY positional trade
Good structure making HH-HL.
