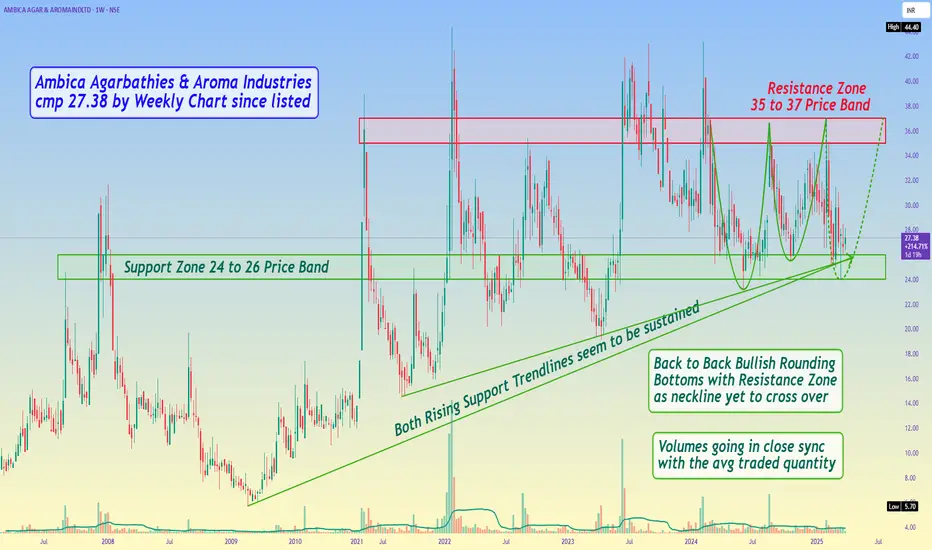
Ambica Agarbathies & Aroma Industries cmp 27.38 by Weekly ChartAmbica Agarbathies & Aroma Industries cmp 27.38 by Weekly Chart since listed
- Support Zone 24 to 26 Price Band
- Resistance Zone 35 to 37 Price Band
- Both Rising Support Trendlines seem to be sustained
- Volumes going in close sync with the avg traded quantity
- Back to Back Bullish Rounding Bott
0.29 INR
4.89 M INR
1.24 B INR
About Ambica Agarbathies & Aroma Industries Ltd.
Sector
Industry
CEO
Krishna Ambica
Website
Headquarters
Chennai
Founded
1946
ISIN
INE792B01012
FIGI
BBG000BWRSH7
Ambica Agarbathies & Aroma Industries Ltd. manufactures and markets incense products. It operates through the Agarbathi and Hotel segments. The Agarbathies segment manufactures incense sticks. Its products include durbar bathies, incense sticks, herbal bathies, natural incense, dhoops, and cones. The company was founded in 1946 and is headquartered in Chennai, India.
Related stocks
YR 2022 Idea #118: Long on AMBICAAGAR This is a public swing trade idea and is only for Learning and observational purpose. Please understand your risk and take full responsibility of your actions. I might trail my stoploss after I get an entry but even if my original Stoploss hits, i exit the trade with pre-planned loss (risk). At


See all ideas
Summarizing what the indicators are suggesting.
Oscillators
Neutral
SellBuy
Strong sellStrong buy
Strong sellSellNeutralBuyStrong buy
Oscillators
Neutral
SellBuy
Strong sellStrong buy
Strong sellSellNeutralBuyStrong buy
Summary
Neutral
SellBuy
Strong sellStrong buy
Strong sellSellNeutralBuyStrong buy
Summary
Neutral
SellBuy
Strong sellStrong buy
Strong sellSellNeutralBuyStrong buy
Summary
Neutral
SellBuy
Strong sellStrong buy
Strong sellSellNeutralBuyStrong buy
Moving Averages
Neutral
SellBuy
Strong sellStrong buy
Strong sellSellNeutralBuyStrong buy
Moving Averages
Neutral
SellBuy
Strong sellStrong buy
Strong sellSellNeutralBuyStrong buy
Displays a symbol's price movements over previous years to identify recurring trends.
Frequently Asked Questions
The current price of AMBICAAGAR is 25.45 INR — it has increased by 1.11% in the past 24 hours. Watch Ambica Agarbathies & Aroma Industries Ltd. stock price performance more closely on the chart.
Depending on the exchange, the stock ticker may vary. For instance, on NSE exchange Ambica Agarbathies & Aroma Industries Ltd. stocks are traded under the ticker AMBICAAGAR.
AMBICAAGAR stock has risen by 0.79% compared to the previous week, the month change is a −3.27% fall, over the last year Ambica Agarbathies & Aroma Industries Ltd. has showed a −10.70% decrease.
AMBICAAGAR reached its all-time high on Jan 28, 2022 with the price of 44.40 INR, and its all-time low was 5.70 INR and was reached on Feb 25, 2009. View more price dynamics on AMBICAAGAR chart.
See other stocks reaching their highest and lowest prices.
See other stocks reaching their highest and lowest prices.
AMBICAAGAR stock is 2.96% volatile and has beta coefficient of 1.32. Track Ambica Agarbathies & Aroma Industries Ltd. stock price on the chart and check out the list of the most volatile stocks — is Ambica Agarbathies & Aroma Industries Ltd. there?
Today Ambica Agarbathies & Aroma Industries Ltd. has the market capitalization of 436.31 M, it has increased by 1.14% over the last week.
Yes, you can track Ambica Agarbathies & Aroma Industries Ltd. financials in yearly and quarterly reports right on TradingView.
AMBICAAGAR net income for the last quarter is 11.35 M INR, while the quarter before that showed −19.35 M INR of net income which accounts for 158.66% change. Track more Ambica Agarbathies & Aroma Industries Ltd. financial stats to get the full picture.
No, AMBICAAGAR doesn't pay any dividends to its shareholders. But don't worry, we've prepared a list of high-dividend stocks for you.
As of Oct 12, 2025, the company has 392 employees. See our rating of the largest employees — is Ambica Agarbathies & Aroma Industries Ltd. on this list?
EBITDA measures a company's operating performance, its growth signifies an improvement in the efficiency of a company. Ambica Agarbathies & Aroma Industries Ltd. EBITDA is 98.09 M INR, and current EBITDA margin is 8.37%. See more stats in Ambica Agarbathies & Aroma Industries Ltd. financial statements.
Like other stocks, AMBICAAGAR shares are traded on stock exchanges, e.g. Nasdaq, Nyse, Euronext, and the easiest way to buy them is through an online stock broker. To do this, you need to open an account and follow a broker's procedures, then start trading. You can trade Ambica Agarbathies & Aroma Industries Ltd. stock right from TradingView charts — choose your broker and connect to your account.
Investing in stocks requires a comprehensive research: you should carefully study all the available data, e.g. company's financials, related news, and its technical analysis. So Ambica Agarbathies & Aroma Industries Ltd. technincal analysis shows the sell today, and its 1 week rating is sell. Since market conditions are prone to changes, it's worth looking a bit further into the future — according to the 1 month rating Ambica Agarbathies & Aroma Industries Ltd. stock shows the strong sell signal. See more of Ambica Agarbathies & Aroma Industries Ltd. technicals for a more comprehensive analysis.
If you're still not sure, try looking for inspiration in our curated watchlists.
If you're still not sure, try looking for inspiration in our curated watchlists.